I am monitoring and logging the hub's response time to a request for a list of devices. I know this is not a direct correlation to hub performance, but with no CPU usage data this is something, and it does usually correlate to observed performance issues (motion lights slow to turn on, Google home saying it can't reach Hubitat, etc).
Every time a platform update becomes available I am notified by hub response times exceeding my warning thresholds. Then that evening it usually fails to run my goodnight rules correctly. The next day I check and sure enough a platform update is available.
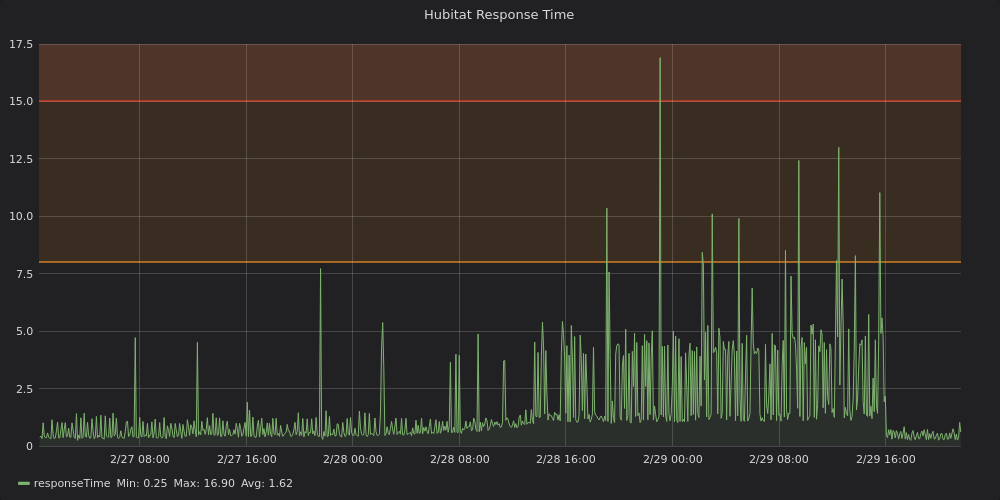
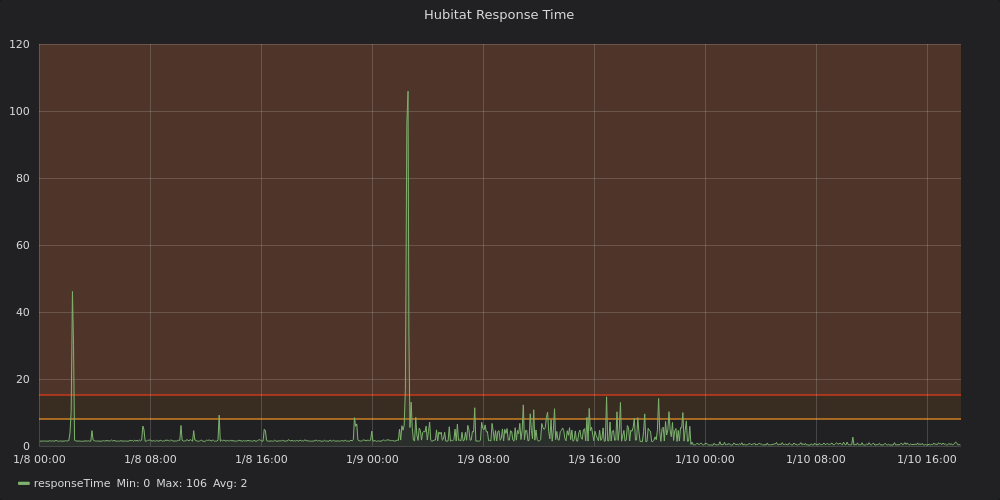
Attached is a log of response times. In this case the update was released on the 27th, it took awhile then the response times climbed up a lot. Last night (28th) my goodnight rules would not run, so I locked the doors and turned off lights manually (like it was the stone ages). I updated on the 29th at about 1600, and the system started running much better. This is the same behavior as when every platform update is released.
I would say this was reading into data too much, but like I said the response time corresponds with observed issues with the hub. This occurs every update, and was anecdotally observed before I started monitoring the response times. I don't think just the fact that an update is present should slow the hub.
I guess I should write why I'm posting. I want to see if anyone else has similar issues, but also just make the developers aware so they could look into it, because it is genuinely frustrating, especially for my wife who doesn't care about the update and just wants it to work.
Also the fact that it will fail to lock the doors in rules where it is supposed to while it is in this state is troublesome...
I have 6 hubs and half are "production"; two are "development" and the newest is going to be added into production but hasn't yet, so it's very lightly loaded.
The three Production hubs would be the focus on my comparison...
Unfortunately I don't see significant slowdowns as discussed here. Me specifically, I don't see slowdowns, but it's possible my family does and just doesn't say anything.
I've had all of my production hubs remain on v2.1.7 -- in other words they've had an update pending, for months. I upgraded to 2.1.9 last night, on one of them, tonight on one more, but the third hub is still on v2.1.7, with a pending update as I said, for months.
I cannot see the correlation. That doesn't mean it doesn't exist. Just that I'm one who doesn't have the combination of factors. It DOES feed into my hypothesis that there are multiple slowdown causes.
Hmm... So if many people download new firmware, and the cloud service gets overloaded, it will impact the local hub while waiting for response from HE cloud? Can that be a correlation? Same server for firmware downloads as the Cloud dashboards, maybe?
Wonder what happens if you take the HE off the internet during this periode, does it get fast again?
It cannot be that the hub waits to excecute before it has had a confirmation of something to the cloud, could it?
Why the availability of new firmware should impact performance, baffles me, and smells wierd...
But you are right, I too see some strange stuff on my hub, and community posts also increase regarding lag and faults during the same periode, so you might be on to something here... Nice catch!
The only thing I can think of that goes to the cloud, is the dashboards, but is it more? Would be cool to see if disabling dashboards to be synced to cloud, solves it.
I don't use dashboards at all (everything integrated to Google Home for ease of adoption from the family)
I would be interested to see if it speeds up without internet, I would have to come up with something interesting to make that happen since I need the hub connected to my network to monitor the response times...
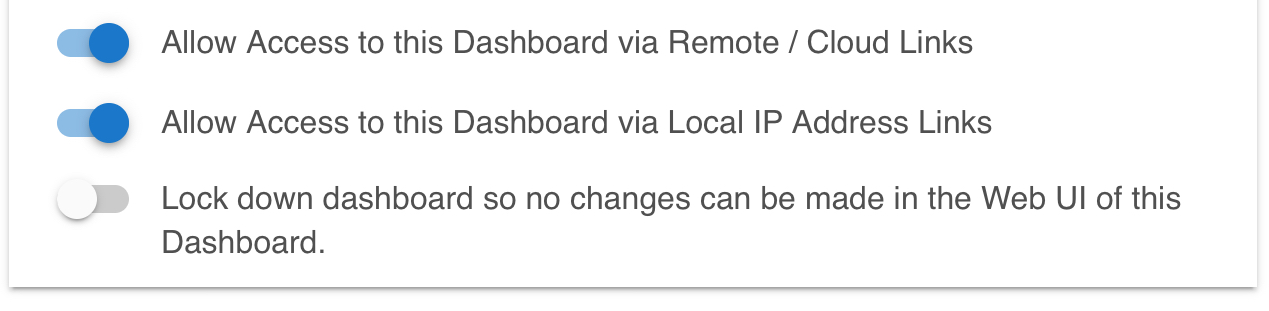
By turning off the «Allow Access to this Dashboard via Remote / Cloud Links» option, does that stop communication to the cloud all together?
You find this under advanced options on each dashboard created.
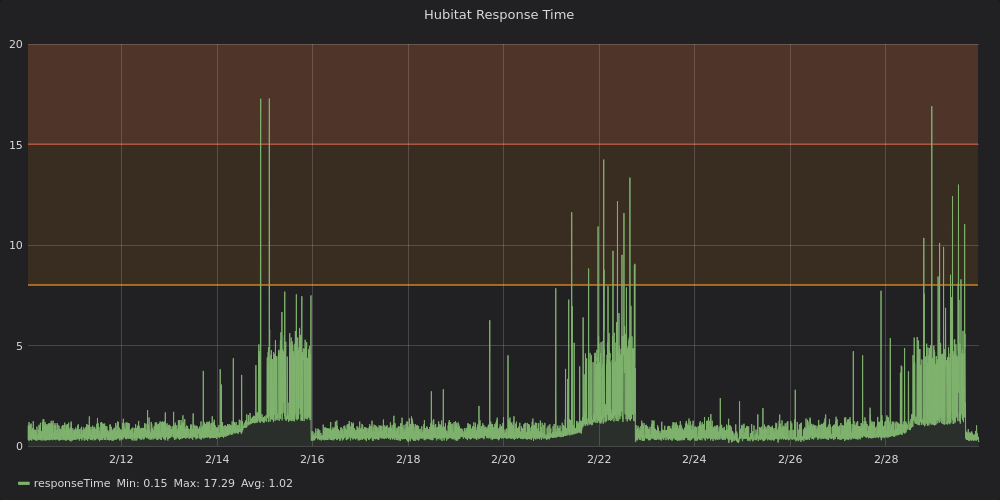
By the way, do you have a longer history in Grafana( I guess that’s you logger graph here) that maybe shows this happening for previous updates? The latest 2.1.9.115 came out quite fast after 2.1.9.114. Would be cool if you did.
That might explain why you do not experience slowdowns? Maybe more stable or without new code that might be the culprit? Who knows...
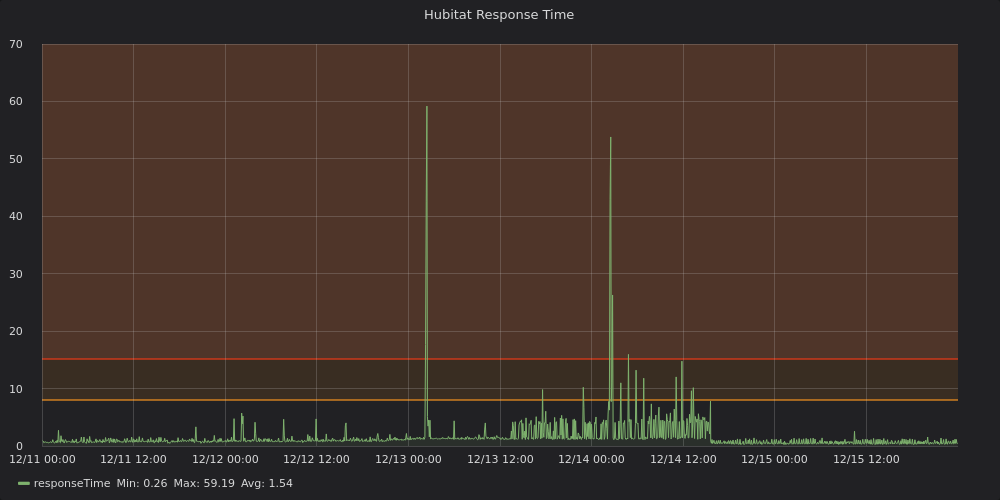
However looking at that I saw similar stuff on the 15th, so I went further back and saw stuff on the 8th and 1st... so a weekly problem. Some of these I noticed personally, but I've also been out of town, so who knows.
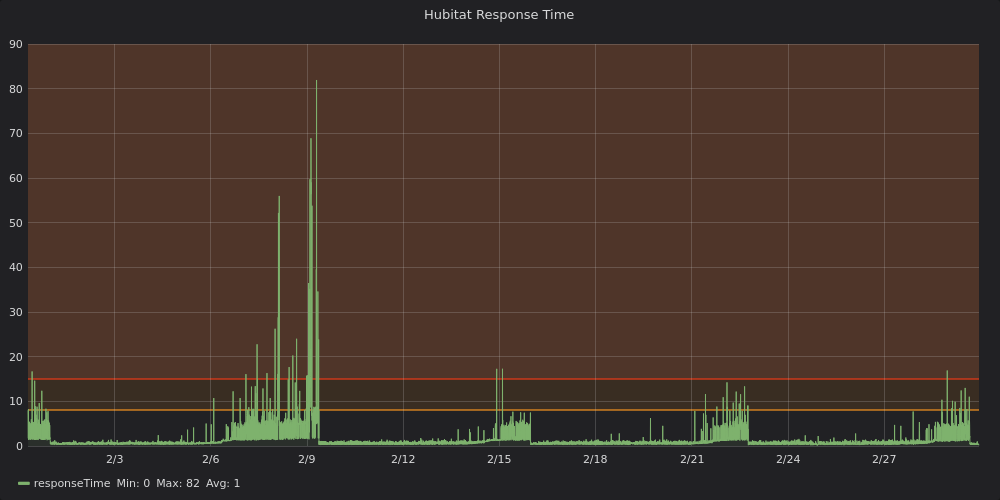
I think this means that starting in February I have had some issue that is weekly recurring, popping up on Saturdays, and it was coincidence that it happened this week and last with updates being released.
I went further back and prior to February this weekly issue dissappears (so I need to find what changed there) But going back to the last two updates I see that the issue does occur here on January 9th.
How do you do this exactly? Because if you are just calling the http time to load the devices page I can easily explain why you experience this.
Btw, I too have a suspicion that the update notification can impact response time of the hub, but haven't noticed it with all updates. Only two times, and the last three updates I didn't anymore. So I expected they've solved it. There is another topic or metion about this from a couple of month ago if I remember correctly.
I know that using this http time is not a direct correlation with actual hub performance (I get warnings sometimes that my hub response time is too long but notice no performance issues). However, when I am talking about these issues with updates, I am not just referencing my logs, but also my experience at that time.
The problem is that as soon as there is an update all admin pages get that red notification on top. To load that it has to do some cloud calls to see how many updates are ready for you, that takes time. In case of no updates the call to the cloud takes less time and no notification is shown.
So does it only check for what number to display once it has checked to see if it should display any number at all? Otherwise I would think it would always slow things down checking to see if there was a notification to show.
Also I don't think that alone will cause the average page load time to go from being too short to really measure to then being 5 plus seconds. I know it isn't a fully accurate way to measure, which makes the data quantitatively innaccurate, but does not reduce the gualitative utility of the data. I agree first byte might be more accurate, but it also might be stuck in the noise floor most of the time. Measuring the whole load time has proven good enough to show trends, that mostly agree with observed performance of the hub.
Also, the only reason I started logging this was because of observed slow downs in hub performance. I honestly don't really look at the warning about response time unless I notice actual problems with the hub, or I am out of town (sometimes a reboot will get things back to normal so I don't hear about it from the family when I get home).
Yep, before I logged this I would notice that a goodnight routine would miss a light or something like that (or the front door, which I will harp on again, because that is very annoying). When that happened I would pull up the web UI and sure enough, an update is available.
Just to throw in my 2 cents. I had that little red flag on my hub for a year since July of 2019. I just upgraded to the latest a day ago. It doesn't seem any different.