I'm experiencing some seemingly random delays in responsiveness. I've got 55 ZWave devices and 7 Zigbee, the problem seems to be Zwave. I had a couple of errant dual outlets, but removed those. Nothing seems to be chattering too much on the mesh. I'm not sure if it's related but it seems to have started after I installed the motion app and moved four motion rules and 5 vacancy rules from Rule Manager.
Has anyone had issues with delays using Rule Manager?
I've been watching blogs, but is there a way to monitor ALL traffic on the mesh? And is there a way to monitor CPU usage in the hub to see if it's a processor load issue?
As far as I am aware, a separate tool is required to monitor all traffic on the Z-Wave mesh. I use the Z-Wave toolbox for that purpose and it did help me find the cause of some issues.
As for the processor, there is a great app from @thebearmay that can give you great stats on the hub:
Can you share a screenshot of your Z-Wave Details? There are quite a few people on the community with a good grasp of how Z-Wave works and that could help you diagnose the issue if that would be of value to you.
Thanks for the info. I may have to break down and spend the $$ but the Z-Wave Toolbox seems a bit pricey and over-featured for what I was looking for. Hopefully I can cobble up some other solution to monitor the network traffic.
And thanks for the lead on the Hub Information. Question is - it's a driver not an app? So forgive my ignorance, but what device do I attach it to to monitor the hub?
The Z-Wave details screen is far too big for a screenshot! But if I can create a map of the network that would probably help me visualize it. Again, back to maybe I bit the bullet on the ZWave Toolbox, but I was hoping for a more cost effective solution for something that wouldn't be used very often.
Create a virtual device and change to this driver.
Have you looked at your logs? You can see what devices and apps are using the hub’s resources from there.
Edit: if a device is spamming the hub, the “events” tab should show it.
I've been in touch with them on and off over the last year with no fix for the slowdowns. Haven't bothered with this error yet. I'm fairly up to date on firmware. Ready to toss it all of I'm being honest. Went from ST to hubitat because of all the issues St had. Worked great for a year or so then nothing but problems since then.
You probably should update to the latest firmware.
The issues you are experiencing aren't normal. And you shouldn't have to live with them for over a year, or get so frustrated you want to ditch the whole thing. There is something unusual happening there.
I would start a new thread to be fair to the original poster and so everyone can focus on your particular set of circumstances. When you do that, please include screenshots of your Zwave details page (assuming it is a zwave issue???). Surely there will be more questions about what devices and apps you use, and what troubleshooting steps you have taken.
I was getting ready to post the network structure (I made a single .jpg of the details) but the system has been running fine for over a week. As I noted - it seems very random. Sometimes doing a ZWave Repair and a Hub Reboot help - sometimes they have no impact. That's why I was looking to see if there are tools I could use to monitor the network and the processor to see if there is any errant behavior when I see problems starting.
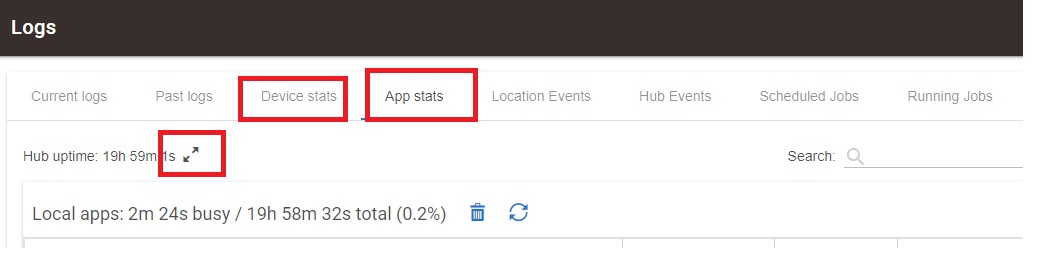
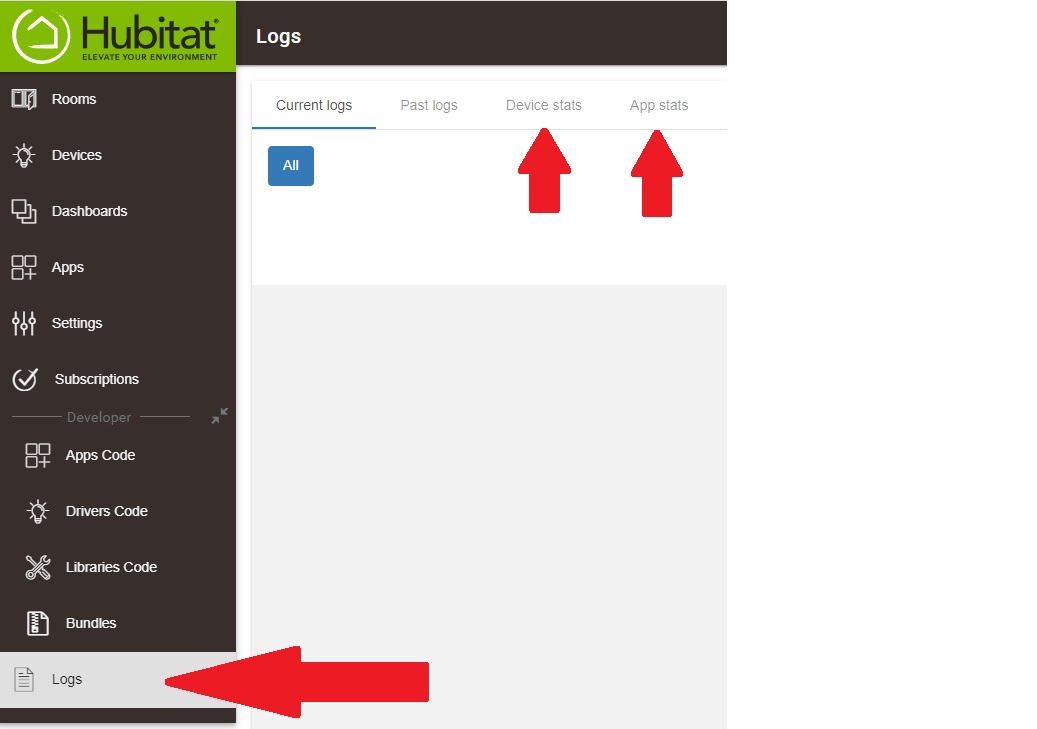
While not exactly what you are looking for I suspect, did you go to the Logs tab, and look at Device Stats and App Stats? Expand the double arrow (shown below) and select all stats.
There may be a device or app using excessive processor time and causing delays. Start with that and see if there is anything apparent.
Please do post your Zwave details page even if it isn't acting up right now.
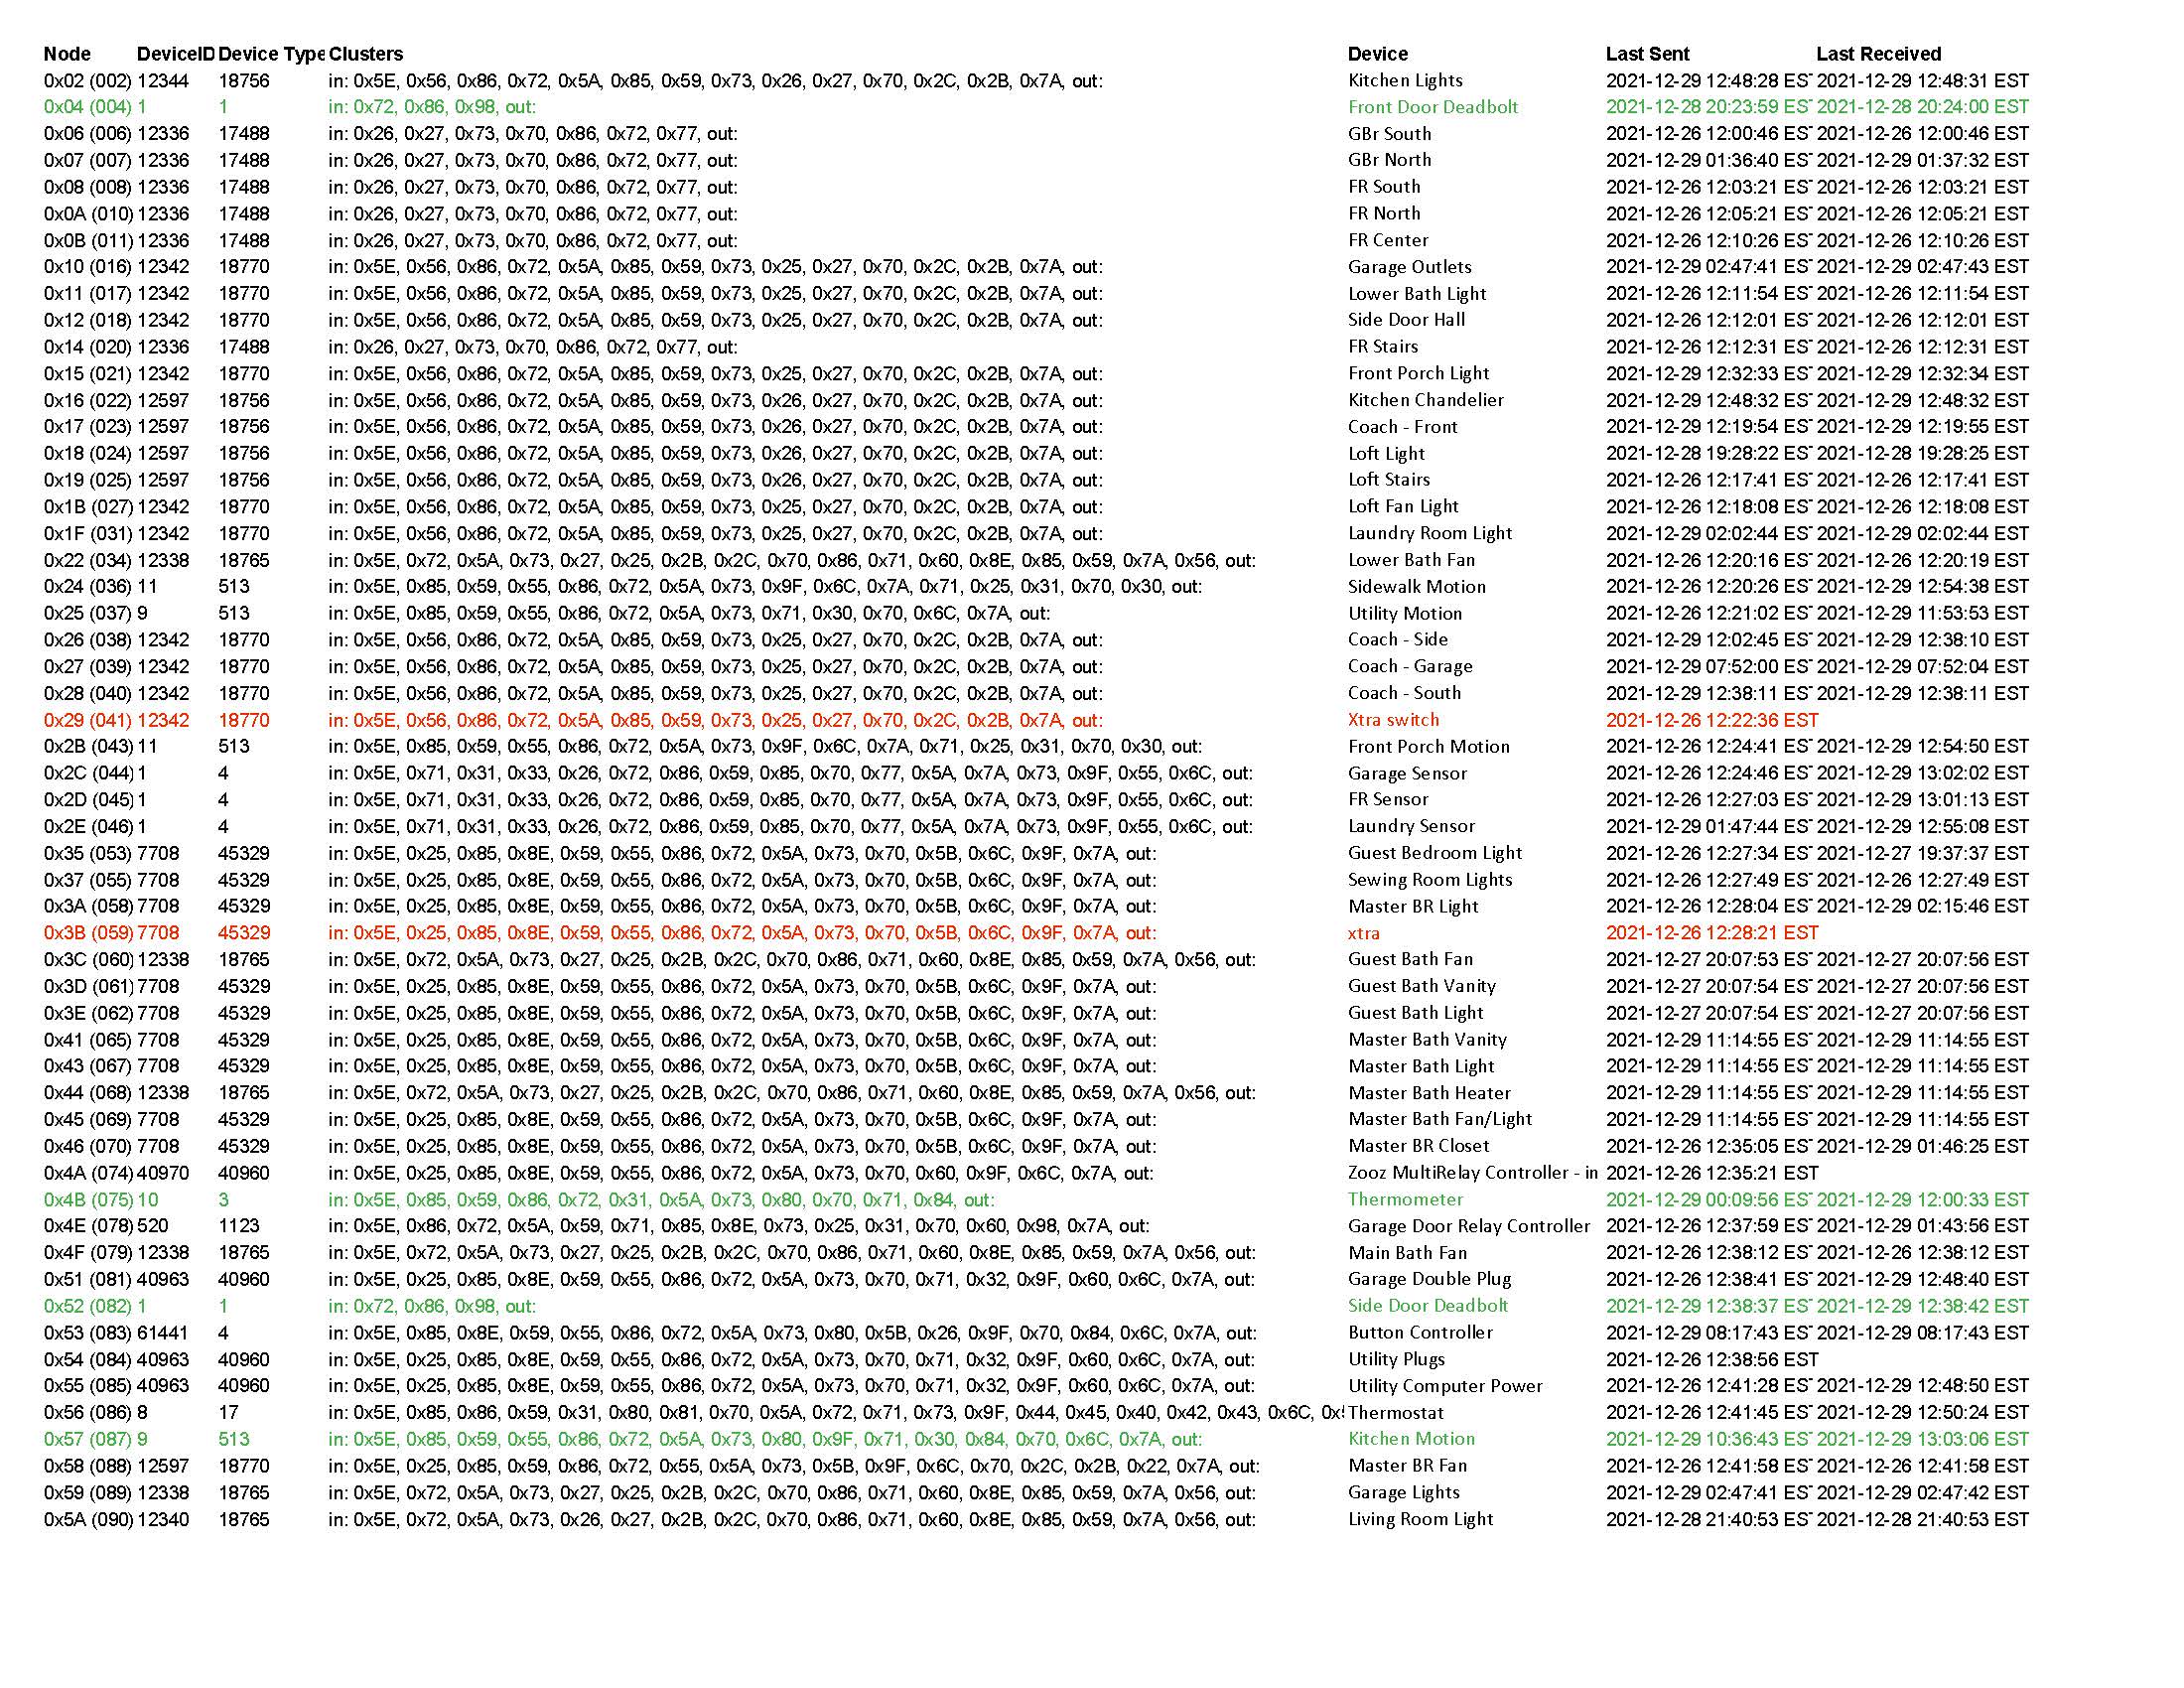
Thanks, I have been looking at the logs, but those aren't real-time debugging tools. The time, for example, is cumulative - I haven't found if there's a way to see what is using CPU time right now, or better yet a display that can monitor over time. That's what I was looking to see if I could find. I've attached a jpeg of the network - I hope you can zoom in on it. I've annotated it - the green are the only battery devices, and the red are devices that aren't actually connected right now.
Wrong logs to find that. My screenshot above is from the Logs tab, not the Zwave logs. Try those, and turn on all stats using the double arrow next to Hub Uptime in my previous screenshot.
Exactly - but those logs report time since the last reboot. Is there a way to monitor the amount of time over the last x interval - say a rolling one minute? Or something more current to see what is happening right now in the hub or on the network. For example, the kind of information provided by the simple Task Manager in Windows.