I thought the maximum refresh rate for cpu load was 5 minutes. I’ve found that less is more with hubinfo. It can be pretty resource heavy if you’re not careful.
1 Like
yes, just for this particular instance. its usually set to default 5 mins. My hub typically ranges between 4-8%. Even when running at lower cpuPct is still above 10% which is not normal.
I think I am seeing a pattern here?
-
Does everyone with the issue have HUB Mesh enabled?
-
Is it strictly a C5/C7 combo issue?
I found my C5 was showing missing mesh devices.
a.) 2 of which were not actually missing.
b.) None of the devices were used in any apps on the C5.
c.) 2 of them were present and properly enabled in HUB mesh on the C7.
d.) 2 no longer existed on the C7 (and had not for months).
So, I simply removed them on the C5 then re-added the present devices on the C5 again, not a single change to the C7. the C7 was the only hub actually showing the load issue. the issue appears to have now stopped.
It would seem that the hub mesh mapping somehow became corrupt at the .132 update? I surmise this as that’s when the issue started. i guess the C5 is (was) polling for these devices with bad ids or something and the C7 was not able to process unknown ids?
I would guess we need to see if the issue is only where hub mesh exists?
I do have hub mesh enabled but am not currently using it. Im going to switch it off to see if it makes any difference.
Edit: No difference after 12 hours. One of my hubs currently reports severe load again.
I have been experiencing it and I do Not have HUB Mesh enabled.
I'm using hub mesh on 2 C5's and have never had any missing devices.
Argh, I’m on .134 and severe loads are back.
@gopher.ny you have my hub ID, feel free to look at the logs.
1 Like
Same here. on 134 and the issue has returned.
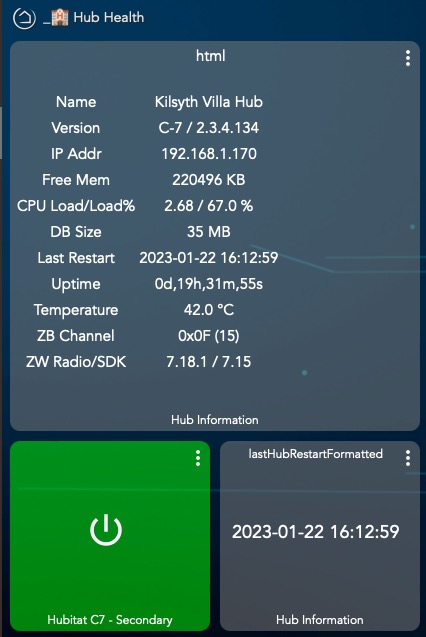
Platform Version
2.3.4.134
Hardware Version
Rev C-5
Solo unit - was having severe load issues until I used the reboot option on the settings page of the hubitat. Since then - 4 hours so far and no severe load warnings.
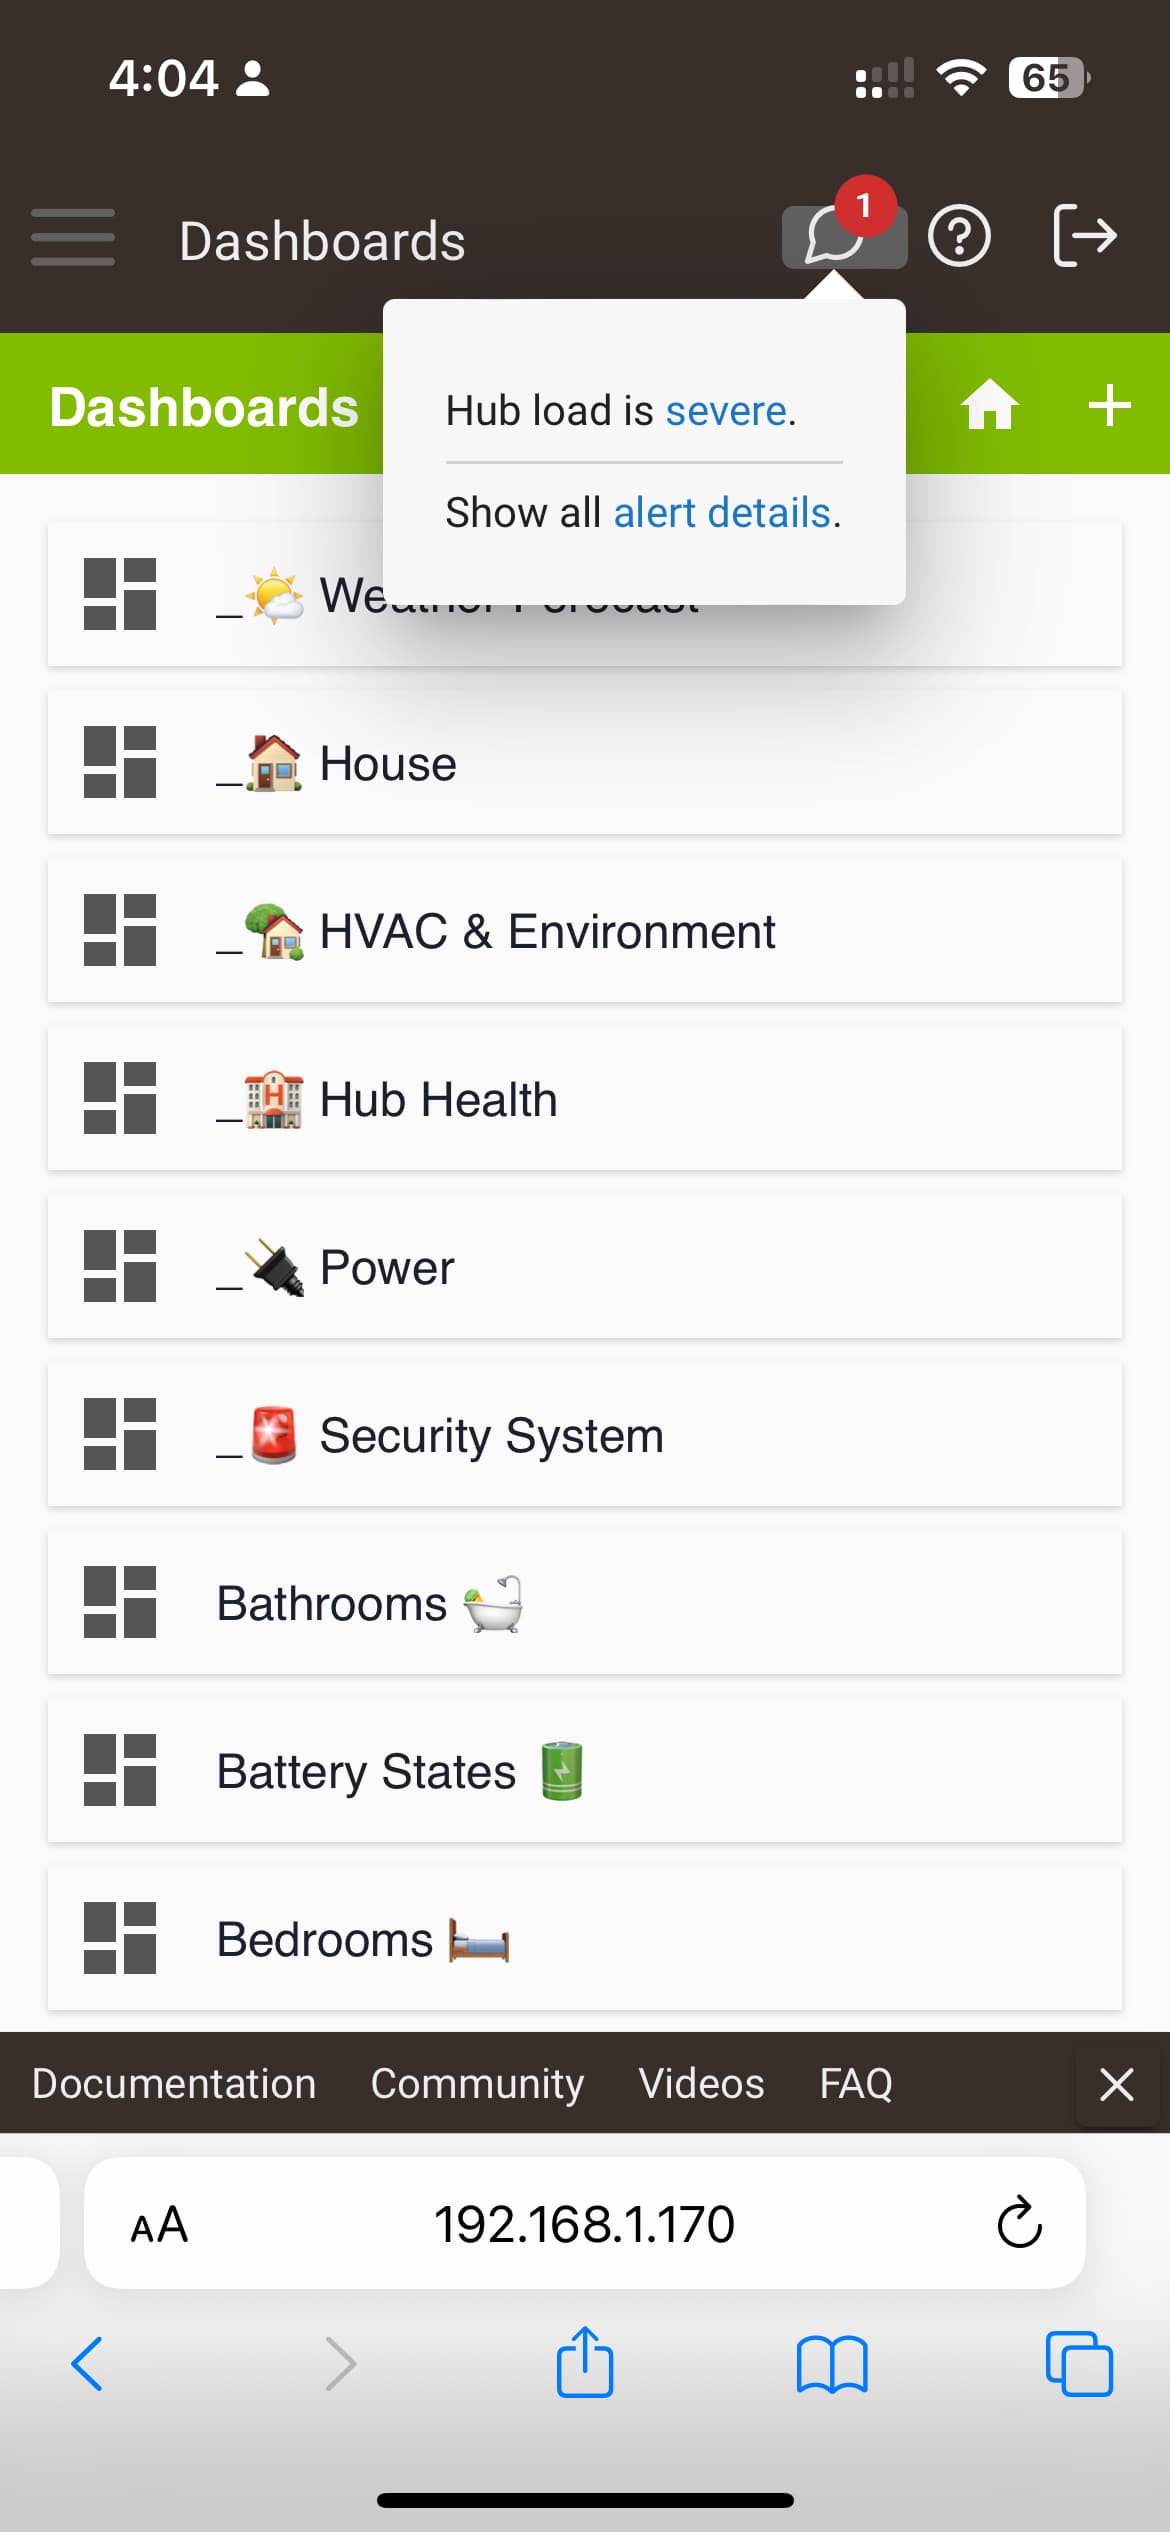
where can i see all these cpu stats people are looking at?
http://192.168.81.203/hub/cpuInfo
ie fill in your ip address
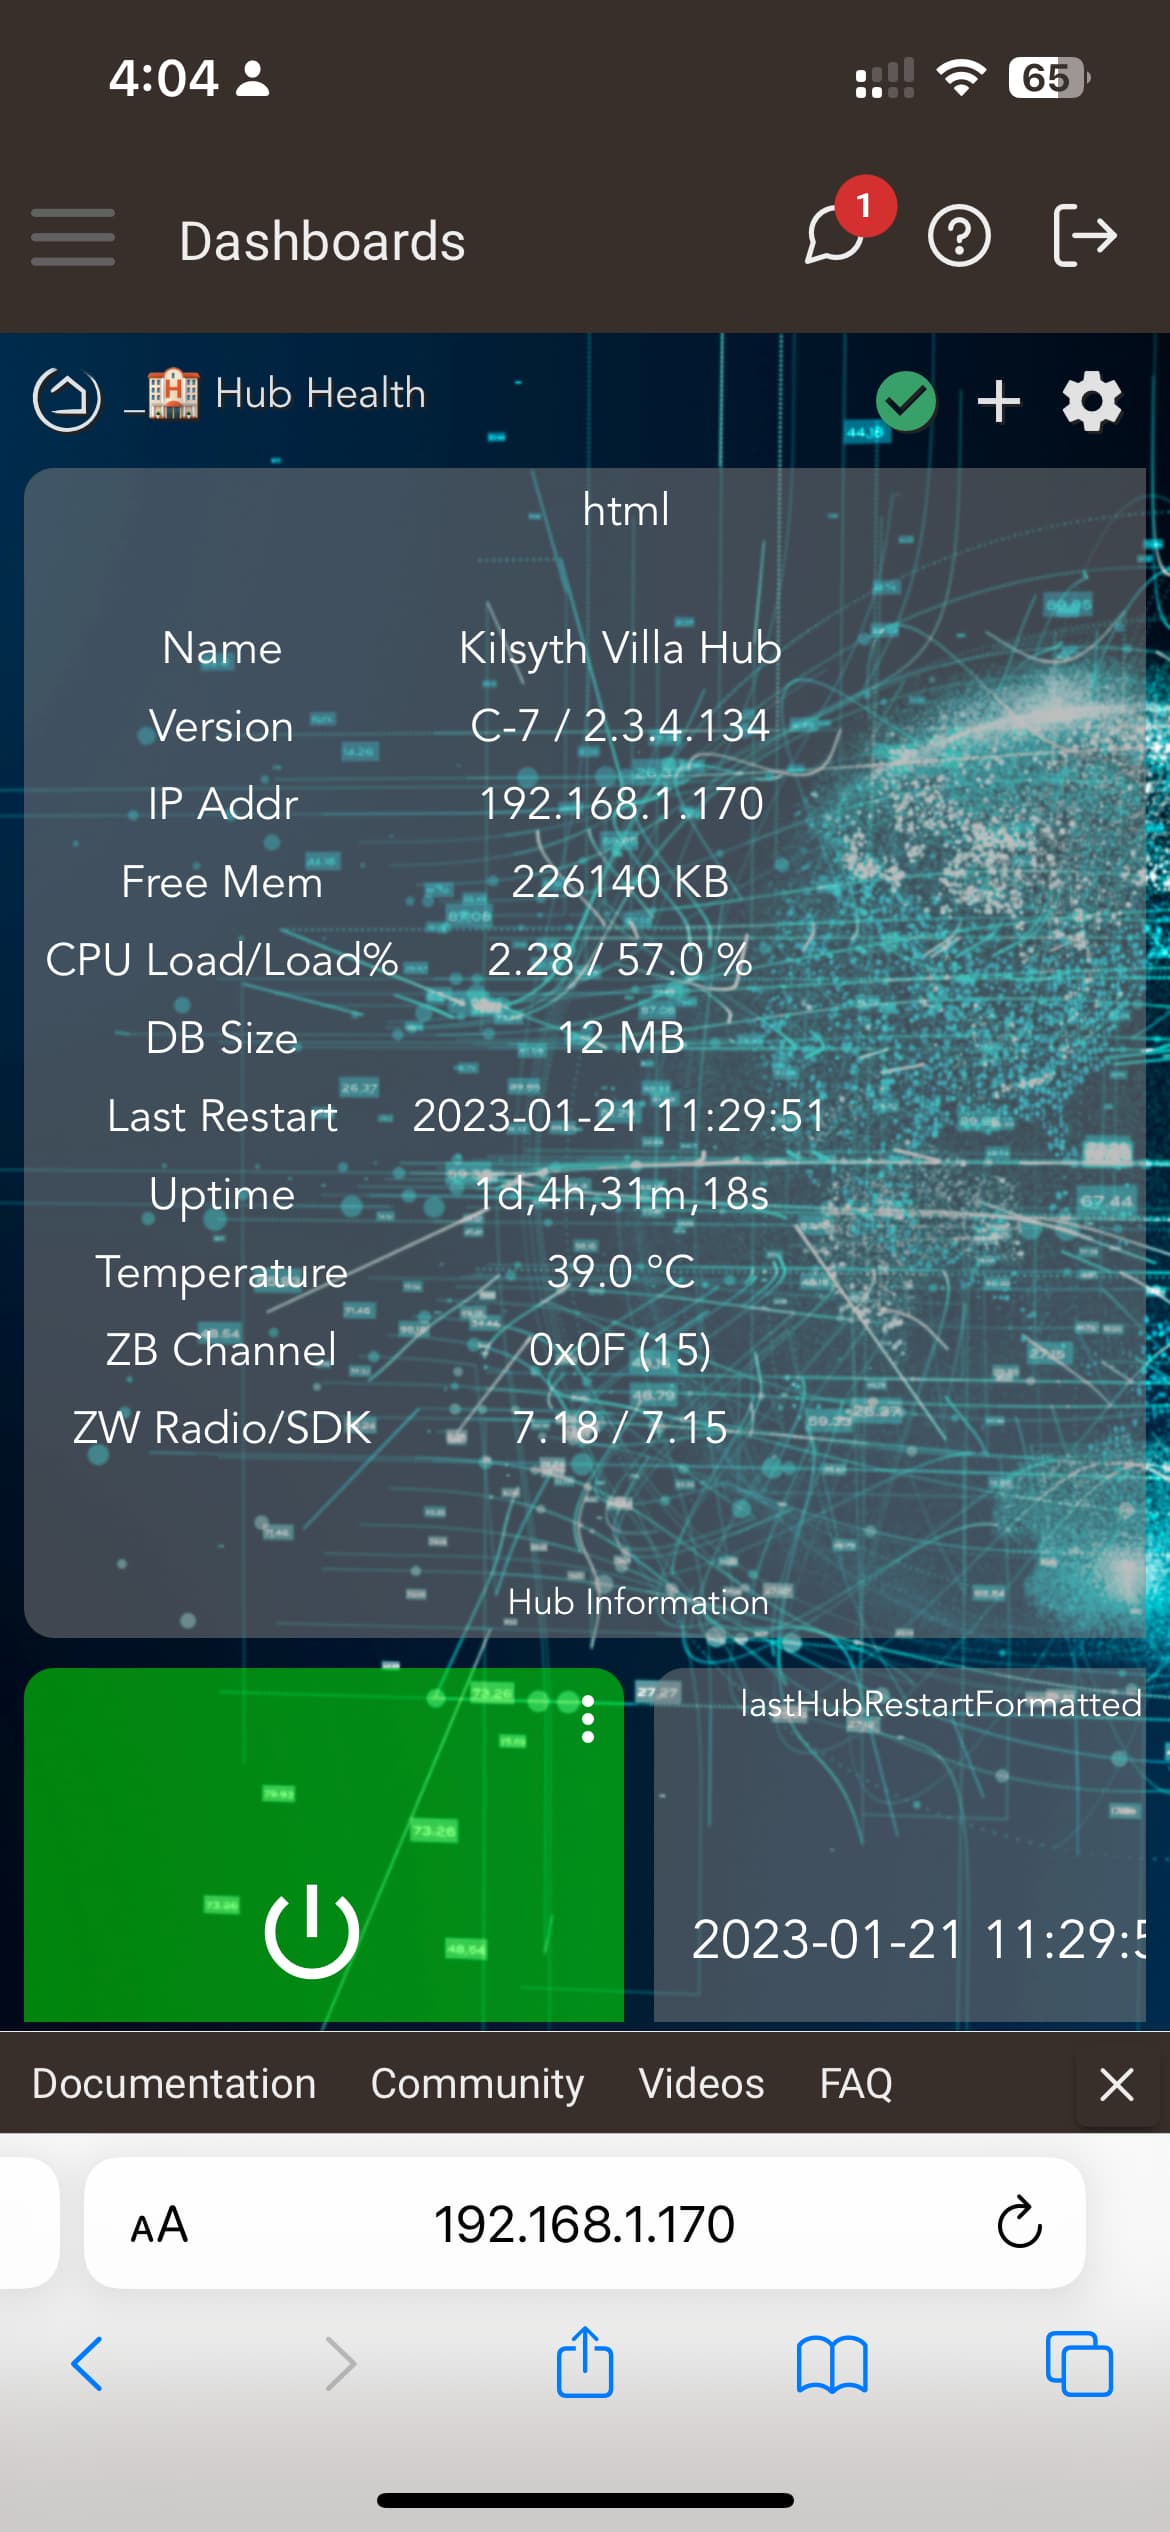
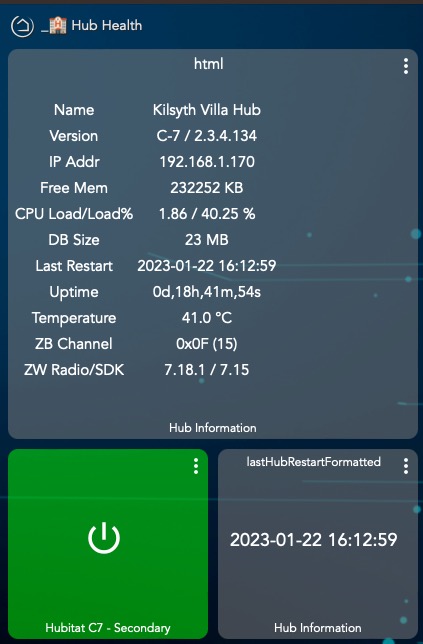
Install @thebearmay 's Hub Information driver.
2 Likes
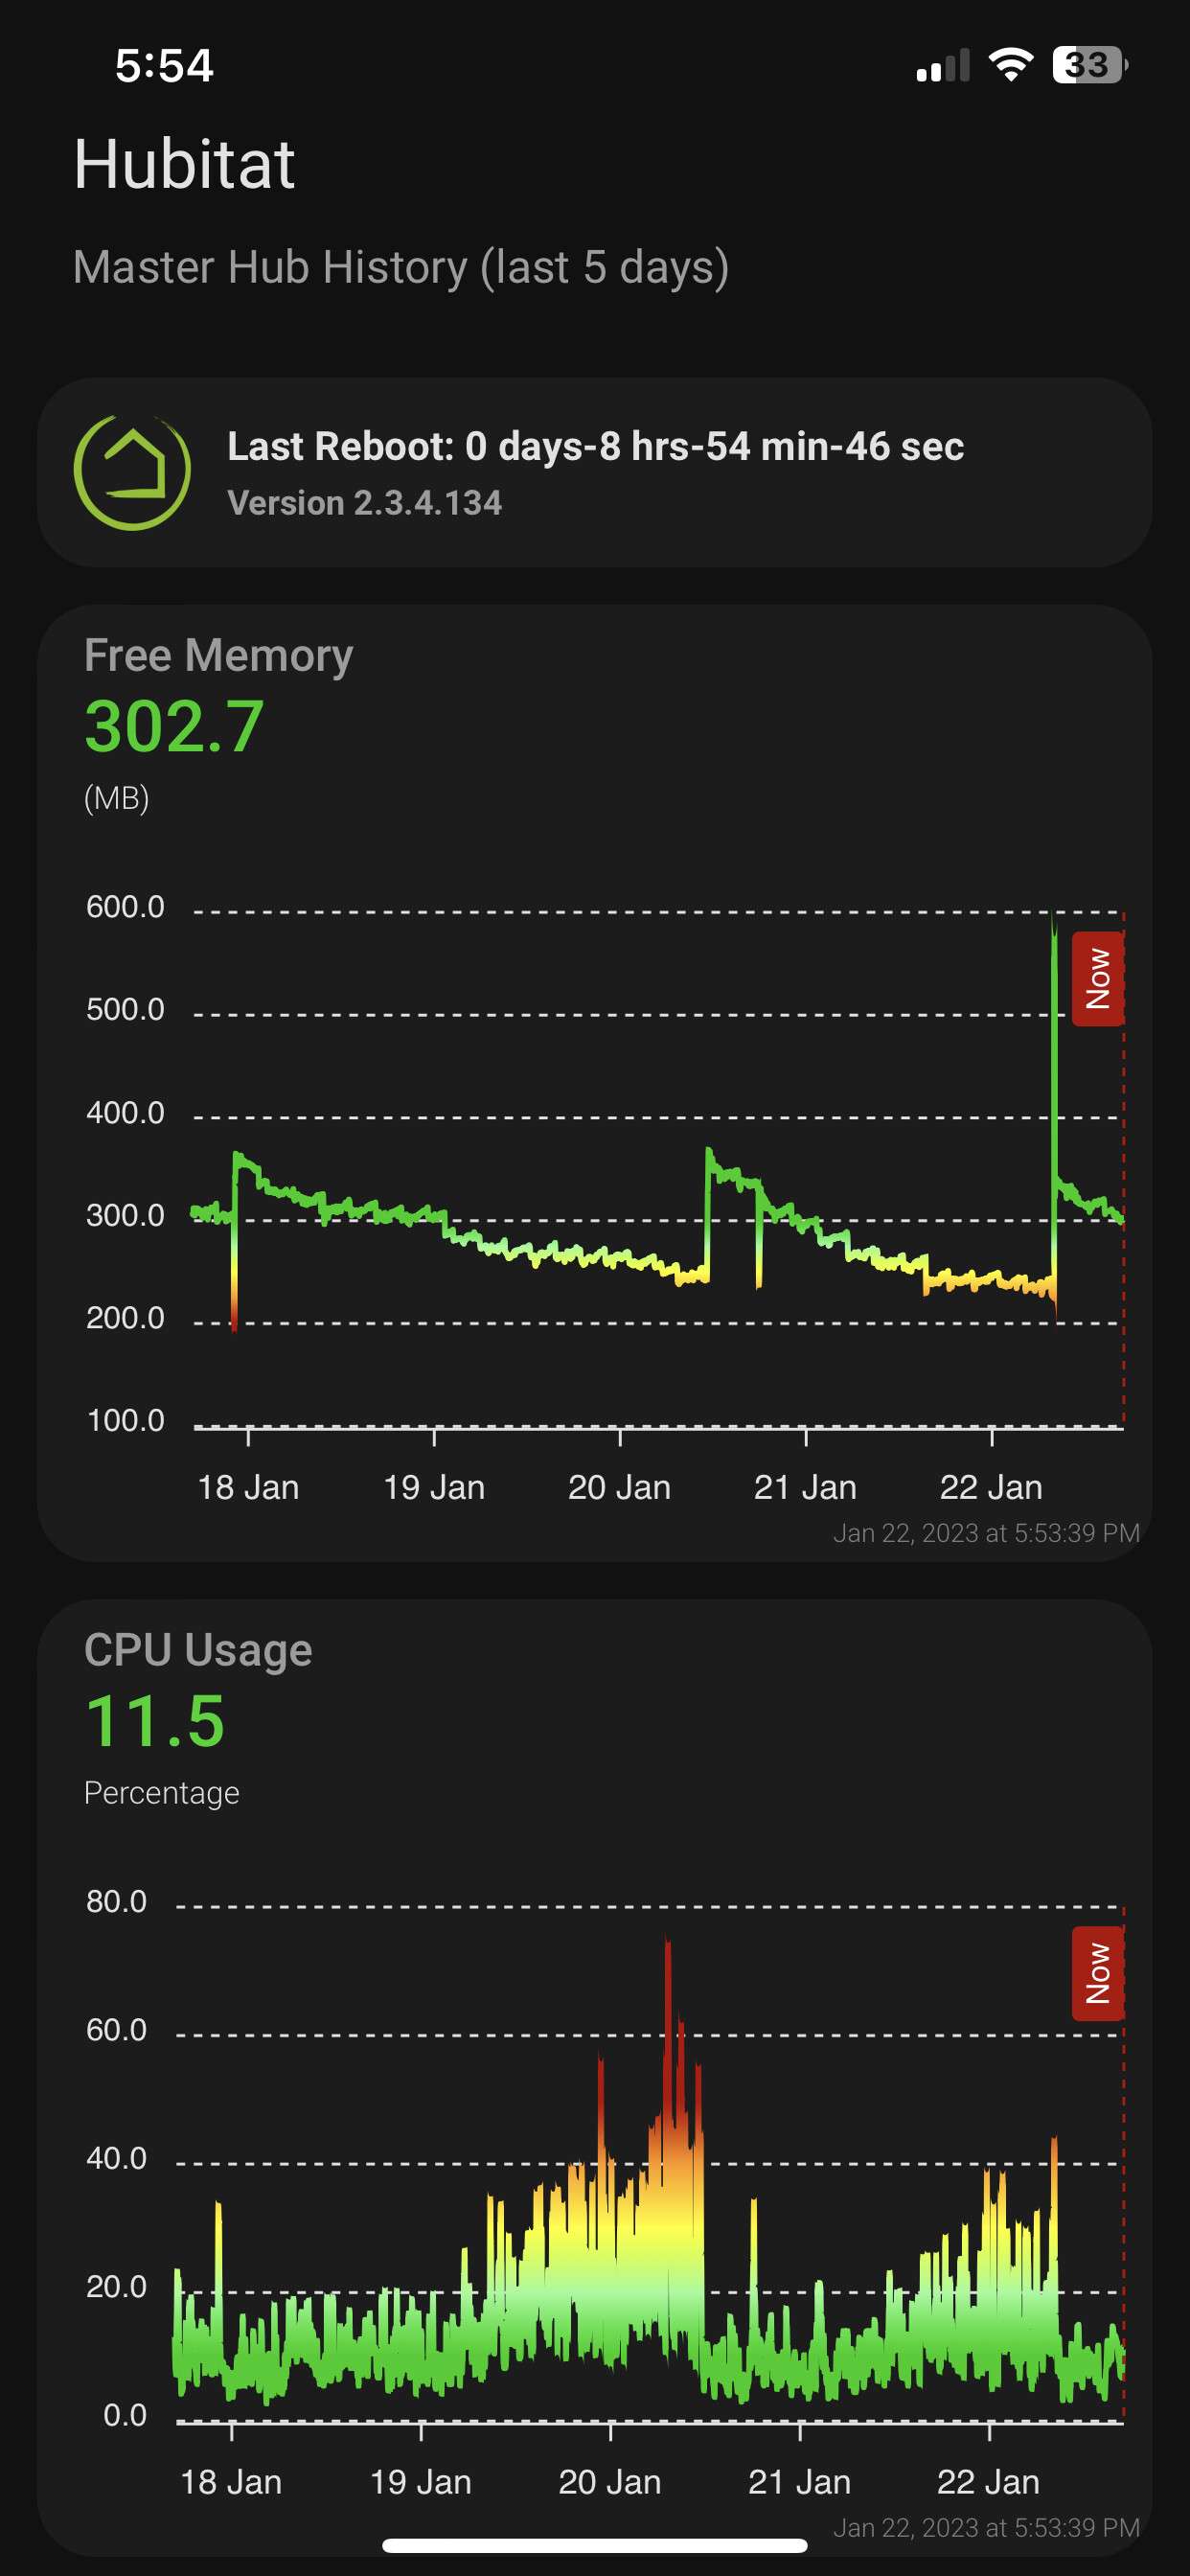
I seem to be seeing the severe load when available memory drops below about 240kb - if I reboot, then things are fine again:
Today's peak:
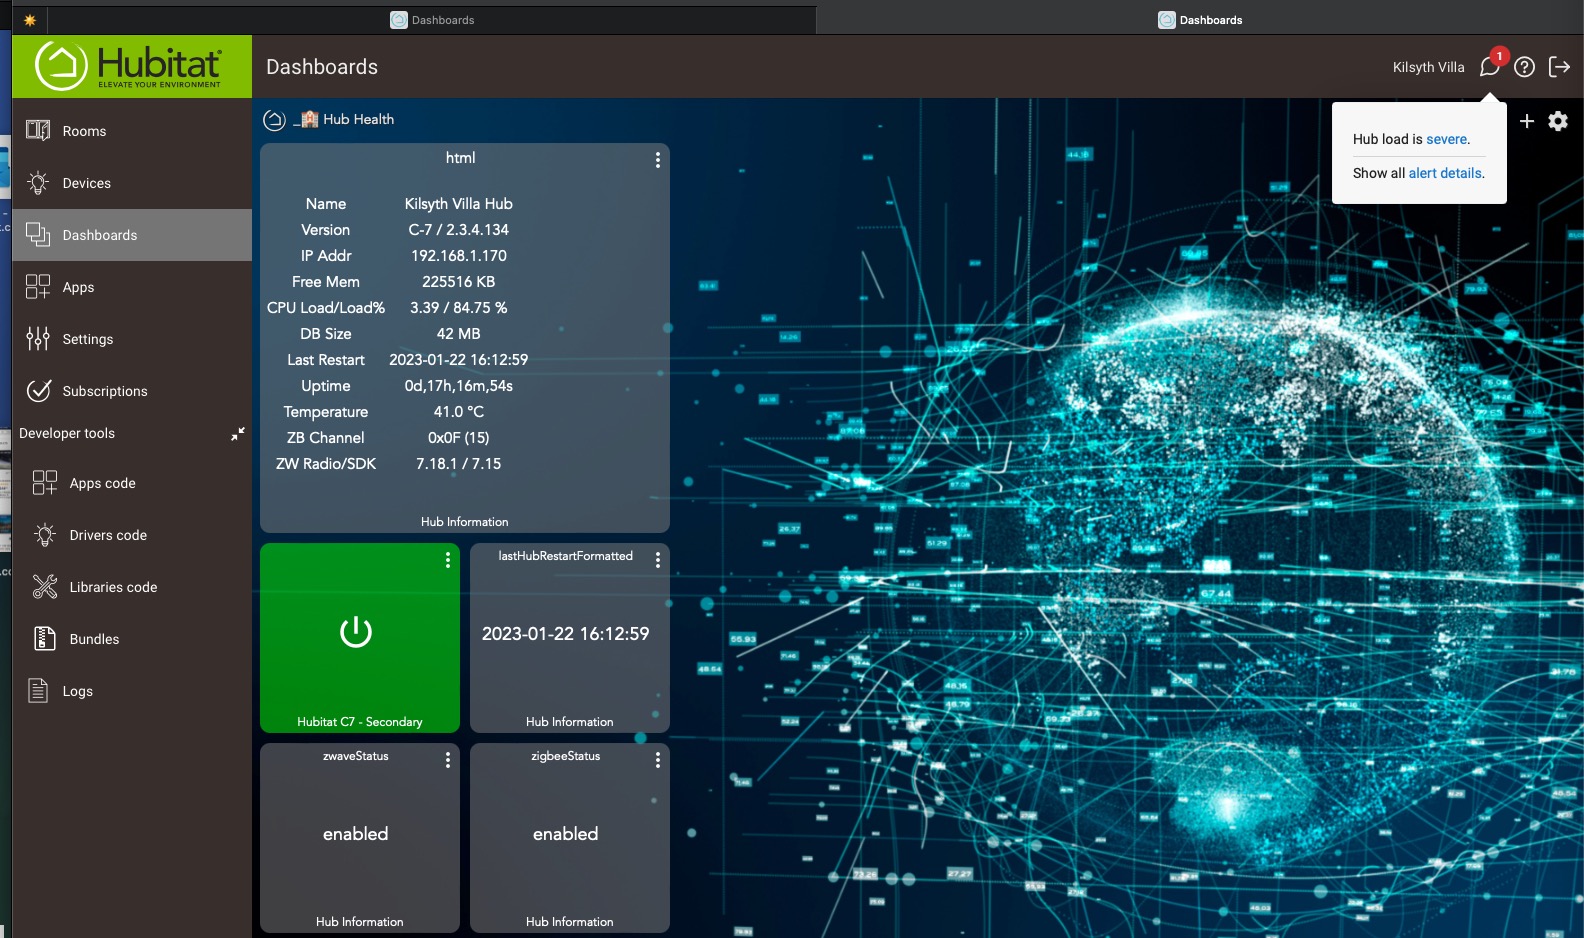
The load of 3.39 is the issue. That could be a high number of apps/drivers waiting on responses to calls - generally internet integrations, or a runaway task/app/driver.
1 Like
i wouldnt call 40% calm. i have 300 devices and many cloud and have never seen that high.
hopefully they will find the cause soon.. it doesnt appear to be a device or app as none show that high.. seems like some kind of underlying os thread but not everyone has it so it must be caused by some combo of devices or apps.. Very hard to track down..
2 Likes
Yeah, it's not ideal, I've only got 145 devices on my primary hub.
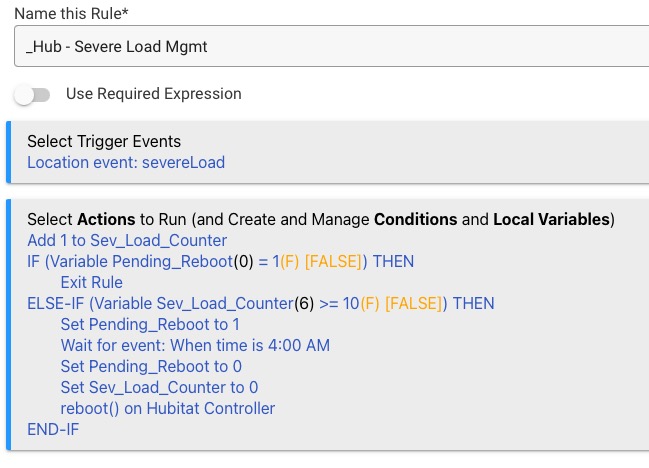
It's definitely still an issue too - this morning I knocked up a Severe Load management rule, and it's triggered six times before lunch. I think I'll just set it to kick the hub over when it gets to 10 alerts, regardless of the time of day.
I spoke too soon, the high CPU issue still exists, I have a rule that reboots the hubs if free memory drops below 225 MB and the hub rebooted after 37 hrs of uptime.
225 may be too low mine both go below 200 and still work fine. I thinl the threshold is lower with the addition of the homekit.
Keep an.eye.on.it but i wouldnt auto reboot.