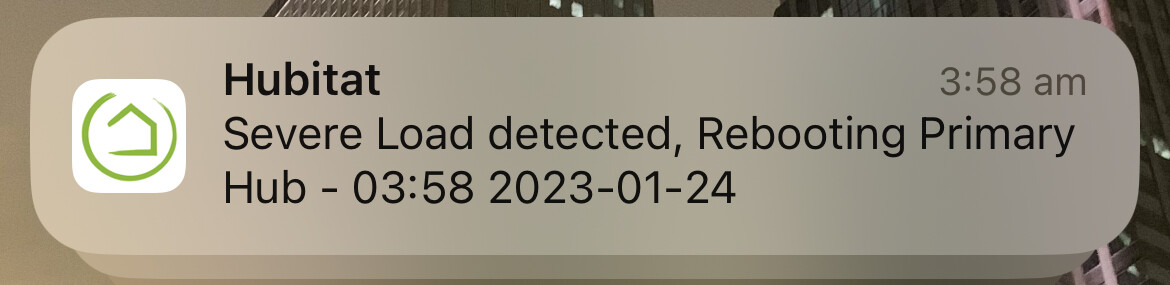
I would, I have mine reboot when it's below 225 free at 4am, If I dont, performance starts degrading rapidly.
EDIT: My primary C7 got to 10 Load Alerts and rebooted - it's looking healthier now:
I would, I have mine reboot when it's below 225 free at 4am, If I dont, performance starts degrading rapidly.
EDIT: My primary C7 got to 10 Load Alerts and rebooted - it's looking healthier now:
Like you I have over 300 devices. I have found that the response time of some of my devices slows considerable when free memory gets around 200 MB so I reboot at 225.
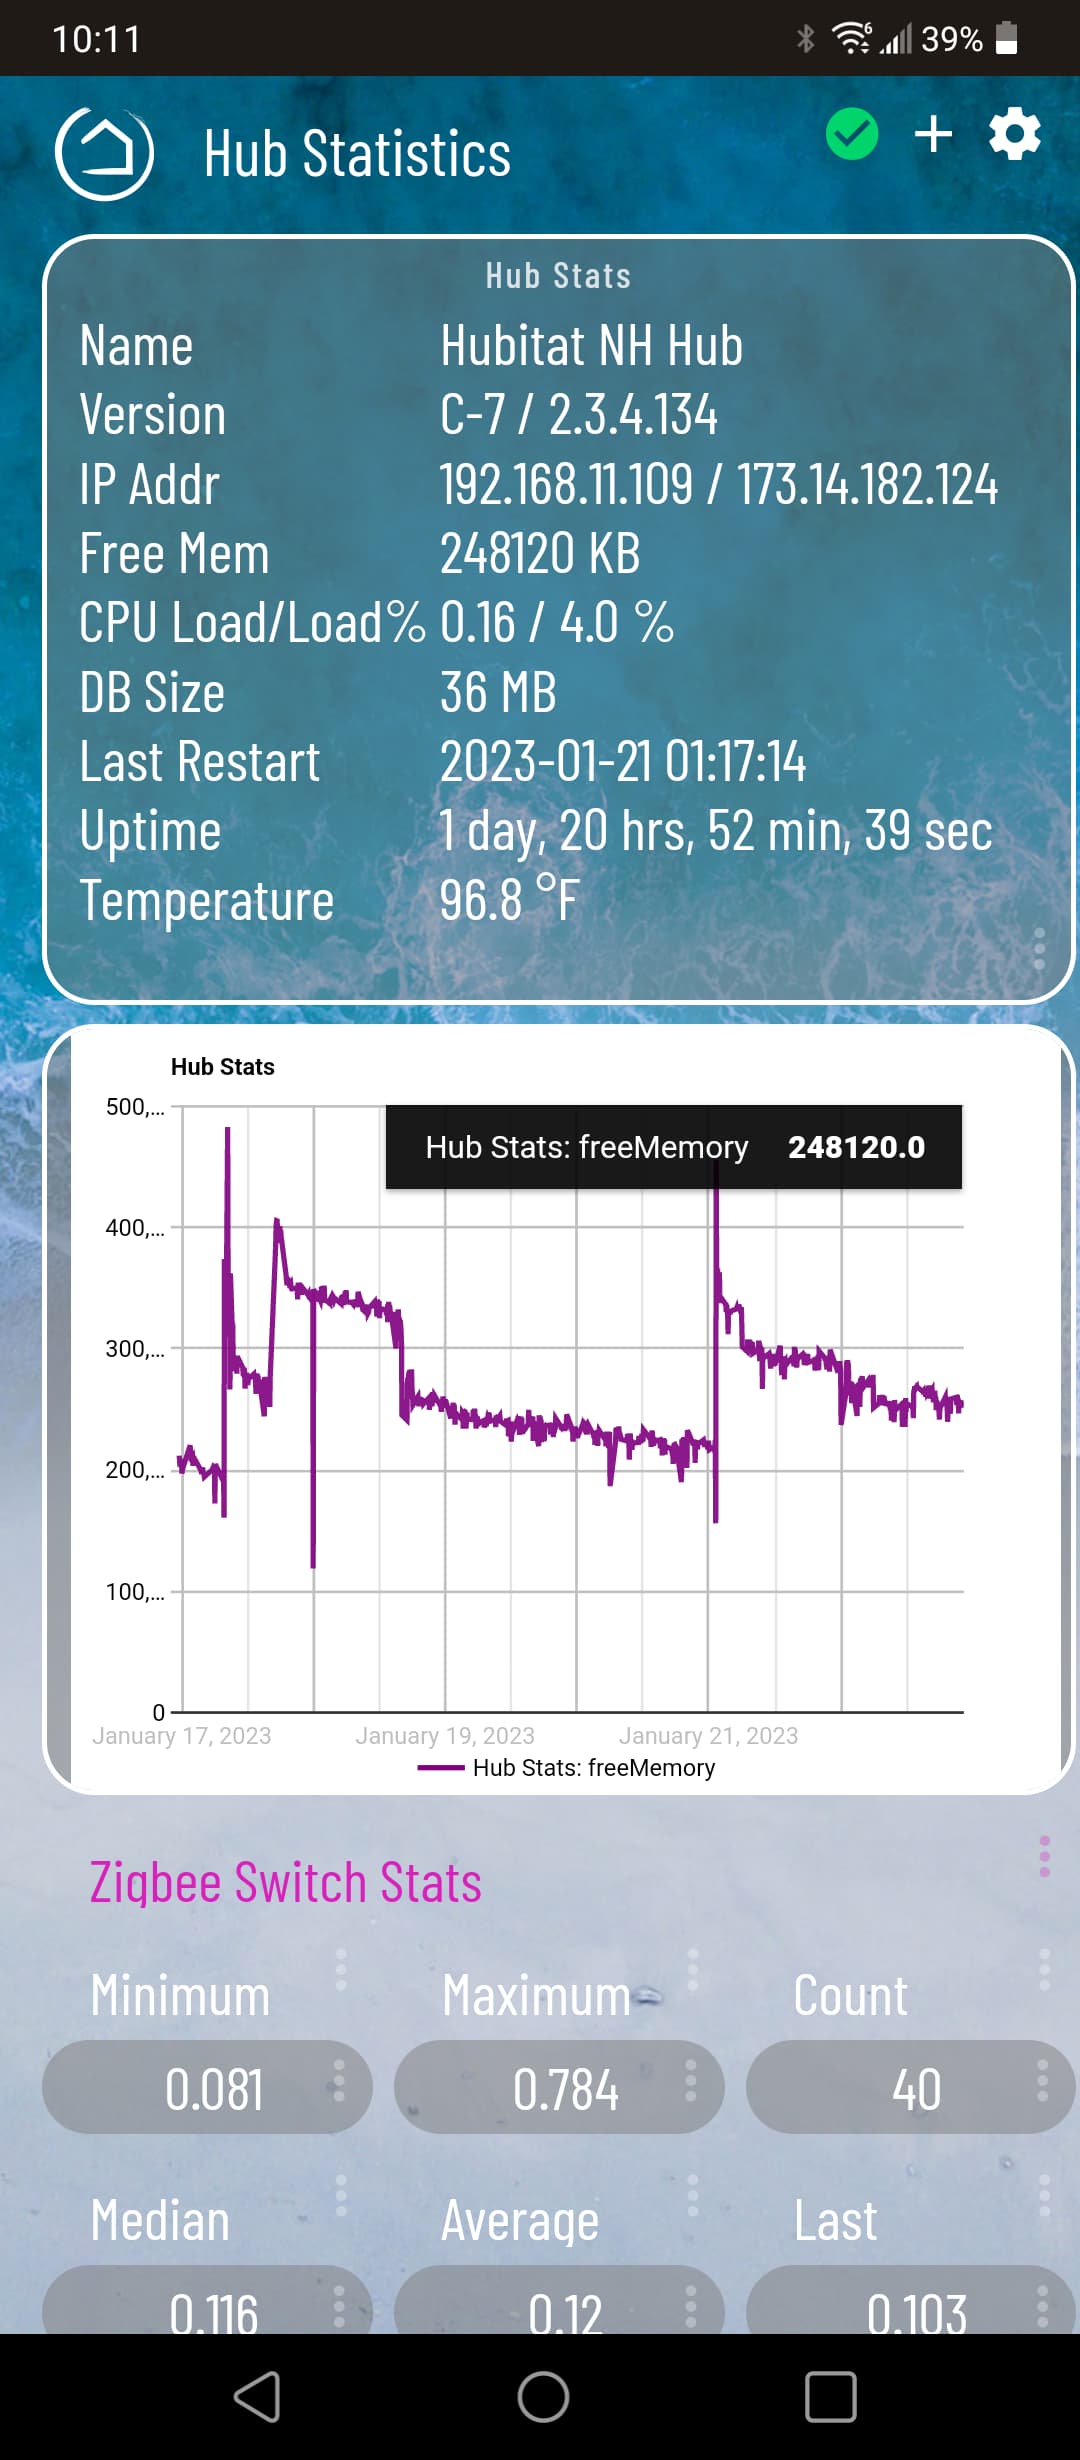
It seems like you are starting off in a hole as far as memory goes. After a reboot, my hubs are both over 400. After a couple days they might settle out around 300. If they drop too much below, then cpu usage starts climbing, I assume due to the hub trying to free up more memory. Your database is also much larger.
If I reboot a second time, I get more memory free - I have no idea why that is.
Havent noticed that. I pole once an hour both zwave and zigbee device.and the only slowdowns.are.around the 2 am maint cycle.
Not since .133 iirc.
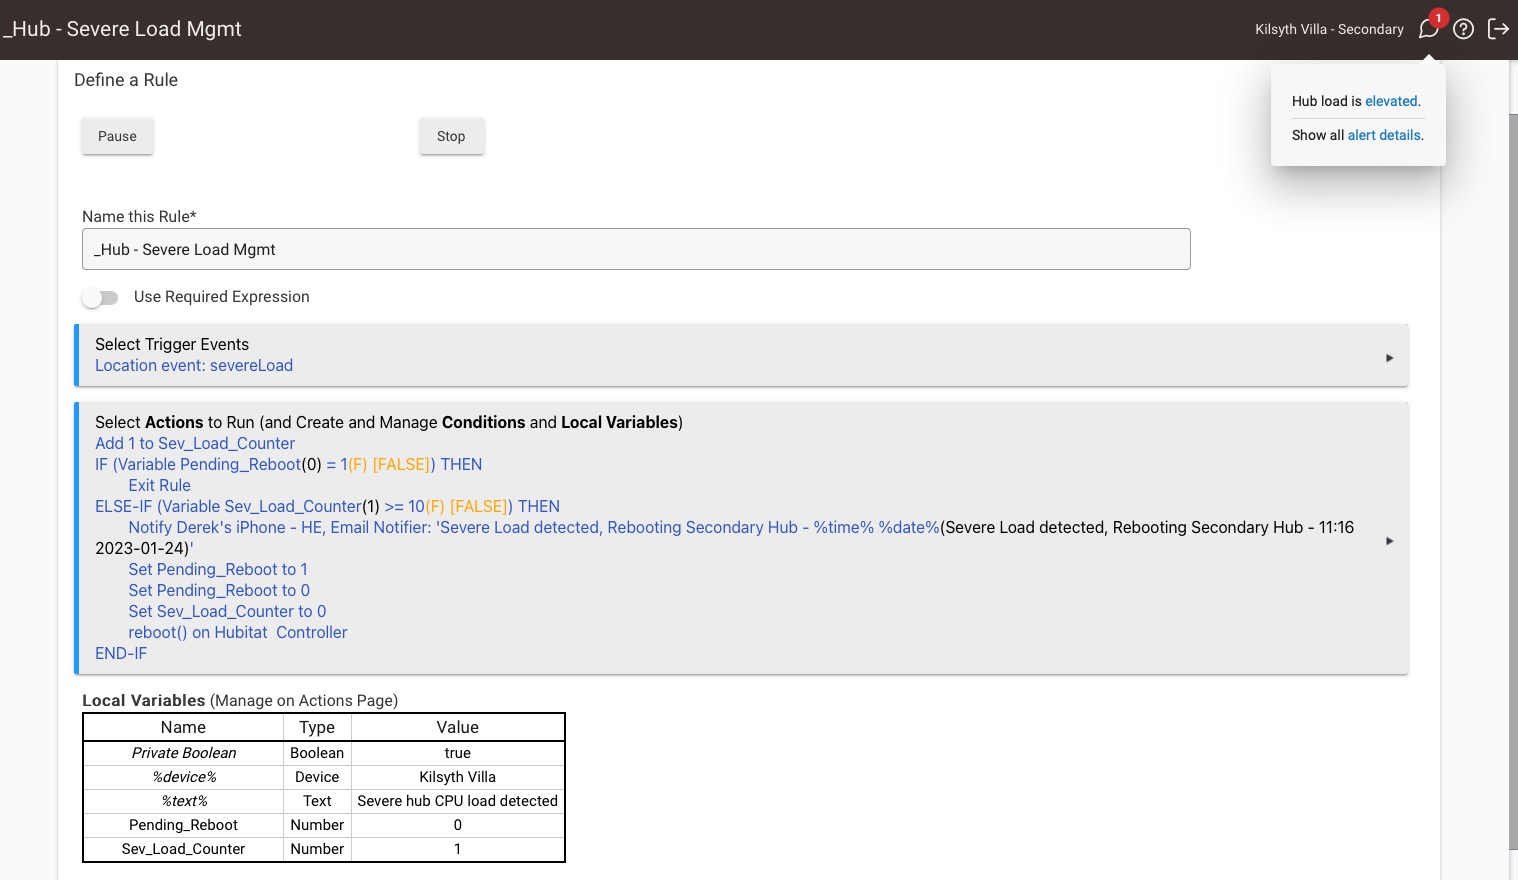
I'm now seeing them on my Secondary Hub. That said, it doesn't seem to be causing any noticeable issues as yet.
The weird thing I've just noticed, is on my secondary hub, there's nothing in the logs. On my Primary hub, they show up in the "Location Events" section.
I might be missing something - I am trying to understand what is going on with my Hub performance. Same thing here...no apparent app hugging the CPU. Rebooting would generally remove the "Load elevated" message.
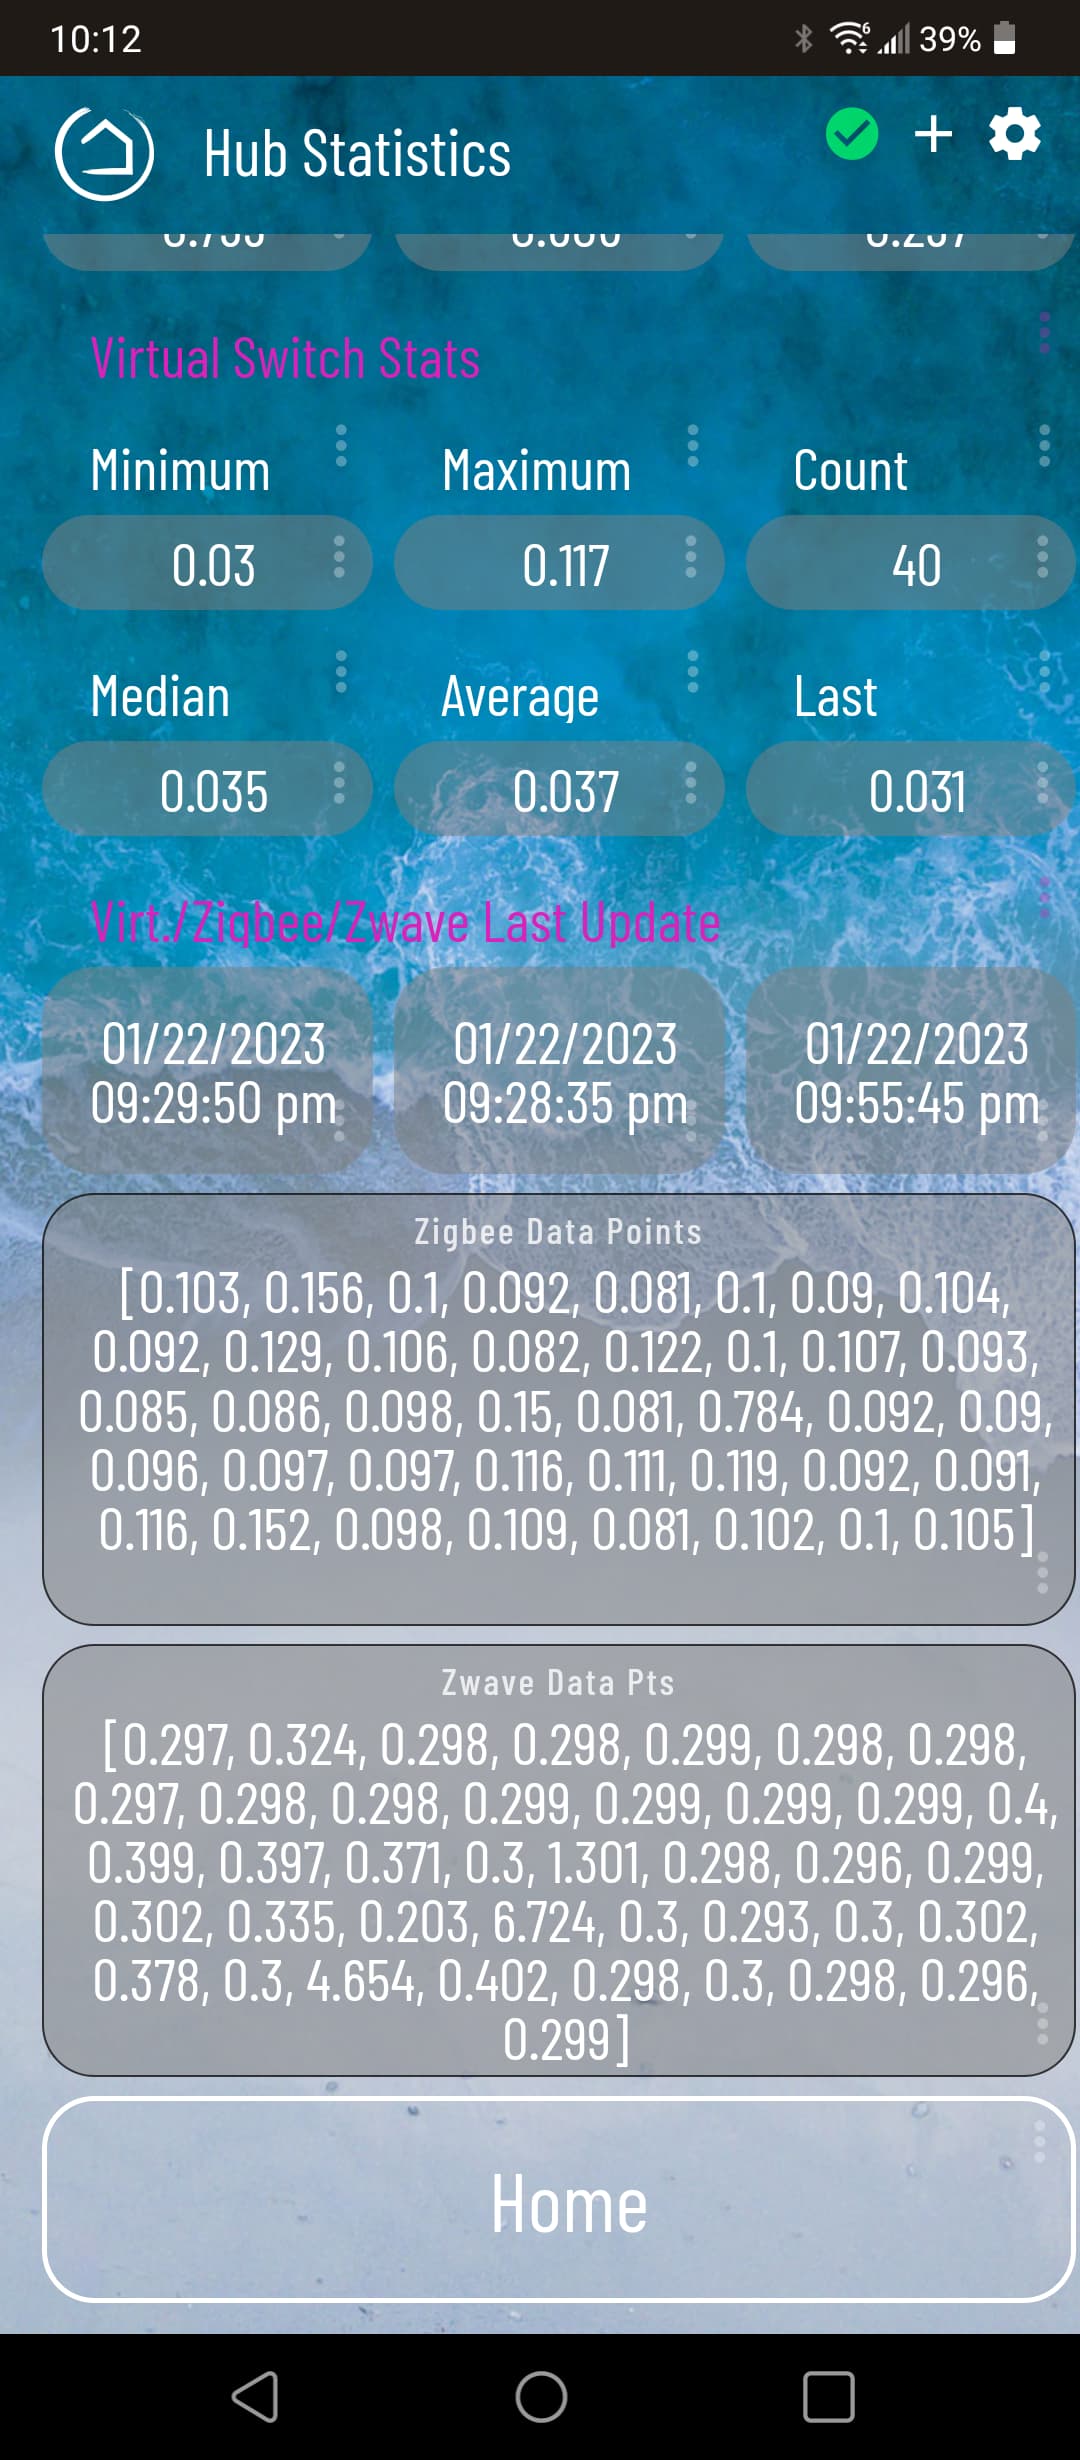
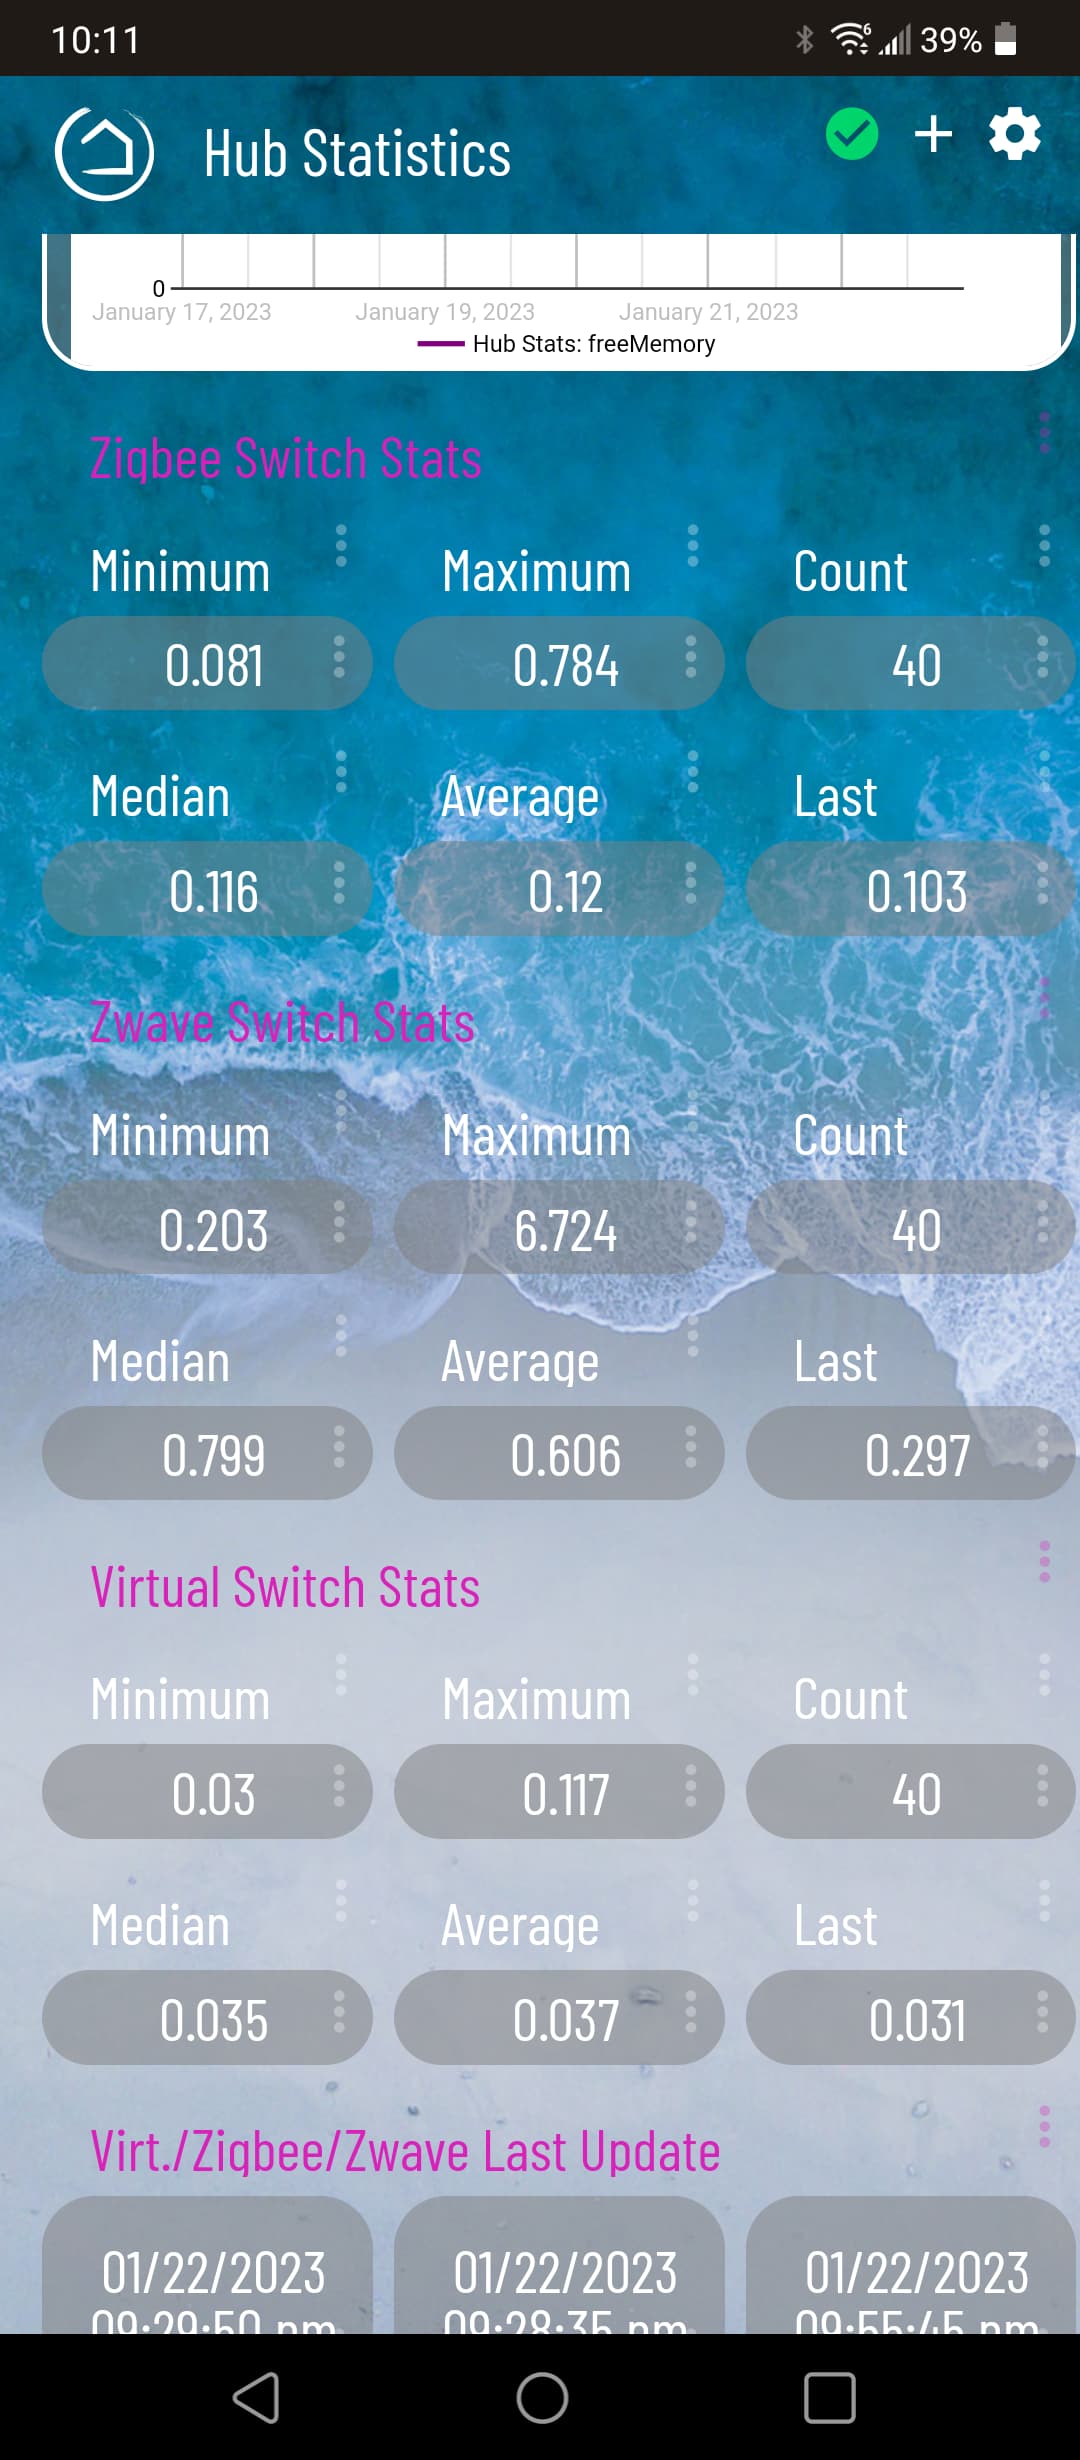
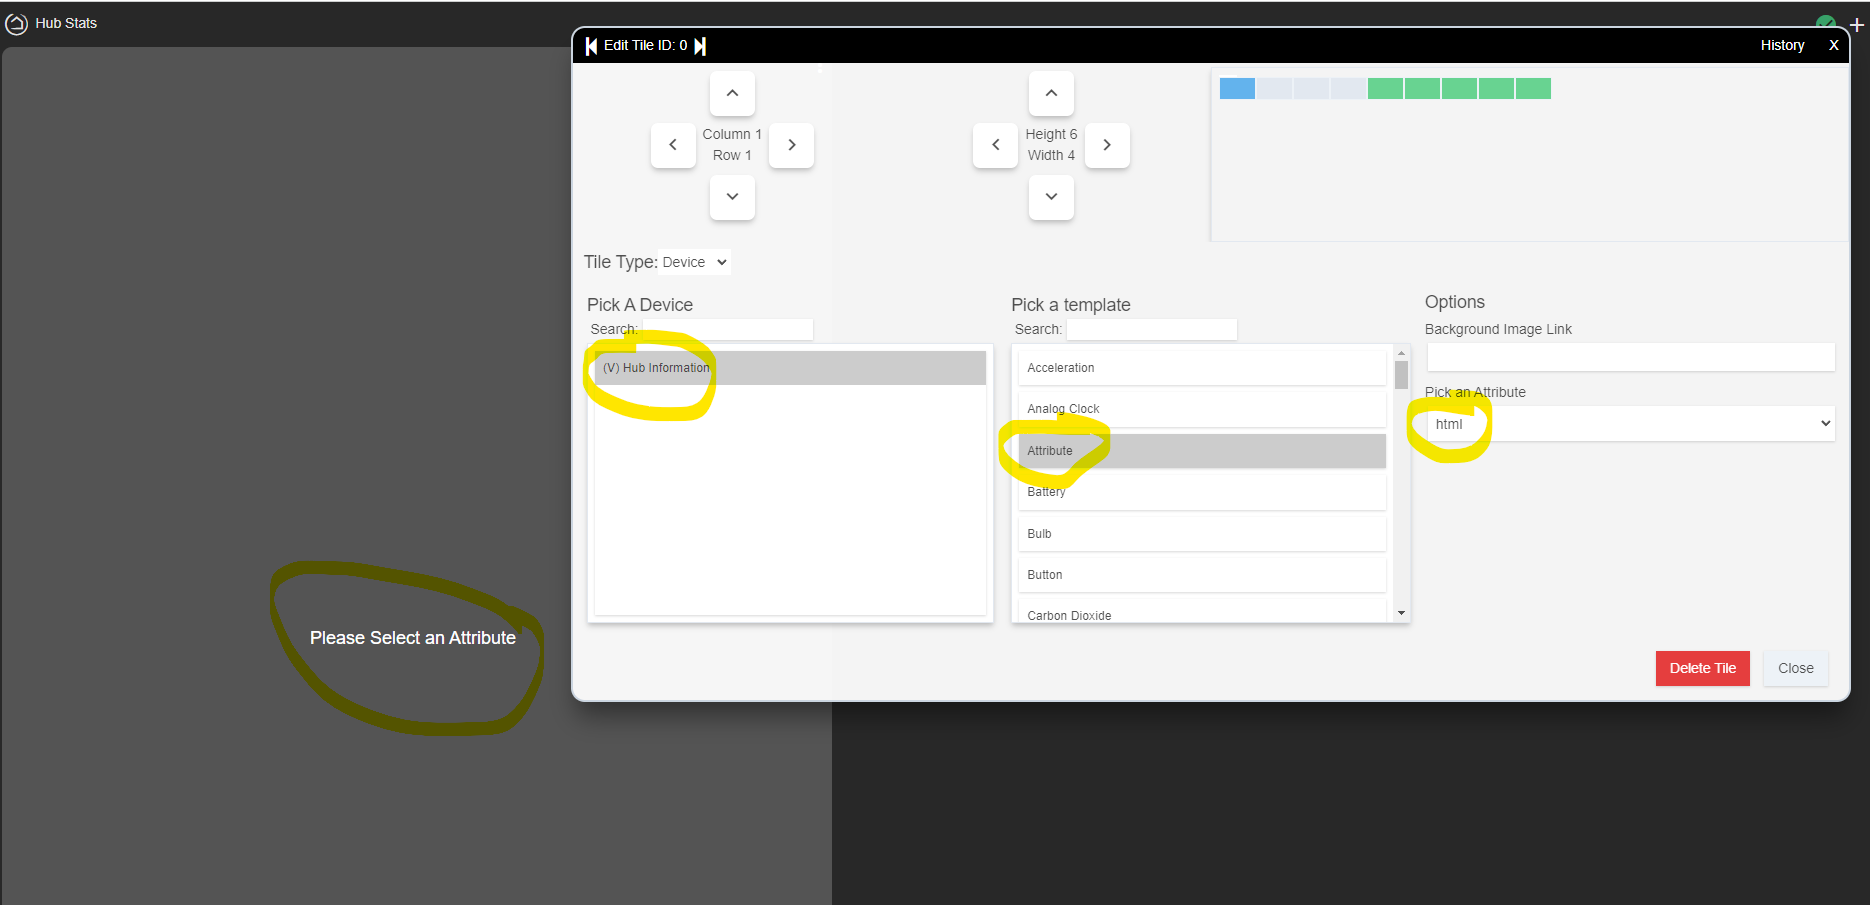
Question - Where do I get this CPU/MEMORY tool / graphic to try to diagnose ? Many people uses different method on this thread... a bit puzzled !
You can get the info using Hub Information Driver V3, then create a virtual device and assign that driver to it. I just have a few dashboard tiles displaying certain attributes but some export the data to influx db and Grafana (I almost sound like I know what I’m talking about  )
)
Yeah, for me graphing is the next frontier, but even I could come up with this using [RELEASE] Hub Information Driver v3 .
There are many ways to do this so it becomes a matter of preference. My dashboards are created using Home Assistant which requires additional hardware. If you’re just starting out I would stick with devices and integrations that are native to HE.
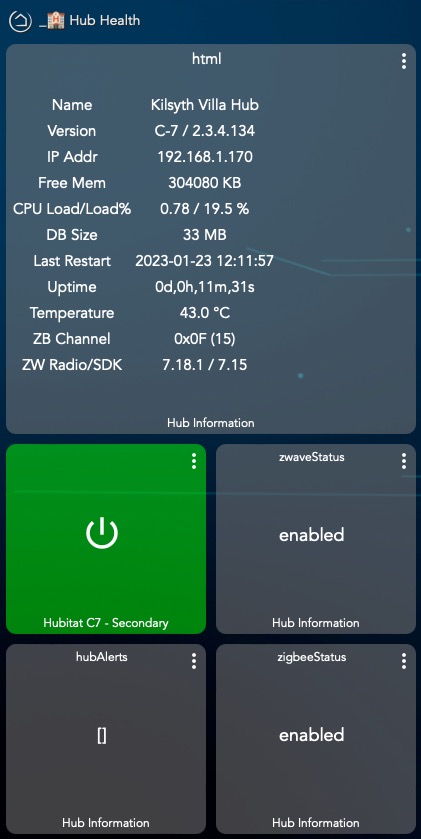
I am new to HE, so I will use this driver - It installed properly, and comprehensive with the little guide included. Just wonder how to get to that Dashboard Tile though ![]()
Even I did it. It's a snap. Reading the directions link on the device driver helps. Ultimately, on the dashboard, you create a tile with 'html' as a attribute. You have to enable the two relevant toggles on the device page -html and html template...something like that. Don't forget to save preferences like I did. And it just pops into your tile!
edit; It sounds like you already added a virtual device "Device" and changed the driver to Hub Information.
That is the part I was missing -
seems to have only one toggle switch now for HTML attribute generation.
I see it in the dashboard now. Not very familiar with this multi attribute in a tile - I'll need to dig how to do this rather than having one tile per attribute, but If I go in the template I see all the information avalaible from the driver... just need to figure out how to "pretty" display it now ![]()
Thanks
Yeah, you're right, one toggle.
You make sure the device is listed in the dashboard app.
You create a tile, choose the device, pick 'attribute', pick 'html', and voila
You've gotta do some resizing of the tile of course, since it has so much info!
Can also use Dashboard CSS to change style elements, add backgrounds, etc.
Download the Hubitat app