Late to the game with this per usual but.. was playing around with the memory report page..
http://hubitat.local/hub/advanced/freeOSMemoryHistory
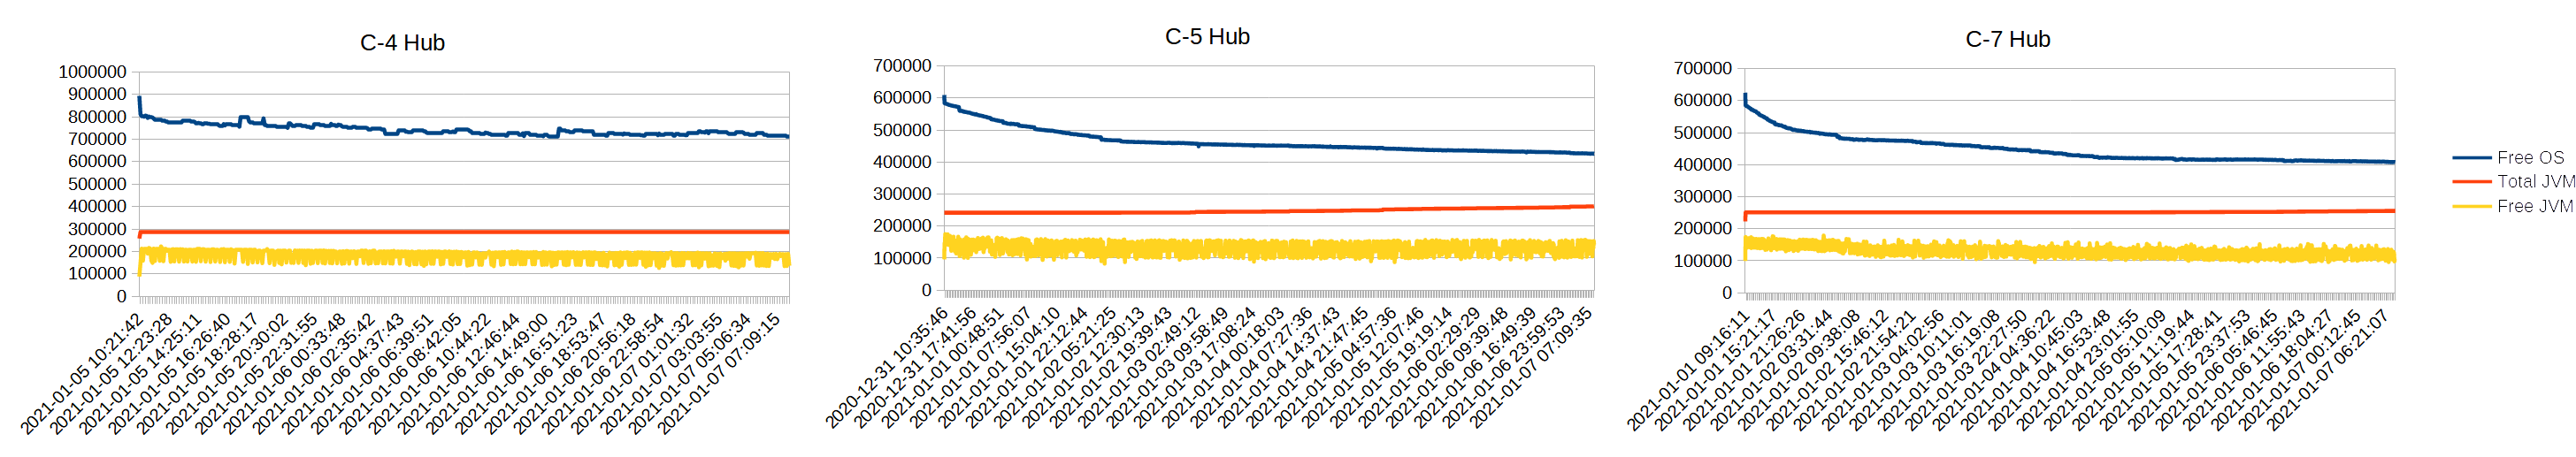
This is the result for my 3 hubs currently in use:
- C-4 has only Lutron, Maker, Alexa and Homebridge + hub mesh for 1 device. Z-Wave/Zigbee services disabled.
- C-5 is Zigbee, running Maker (2 instances), Groups, Lock Code Manager + hub mesh for 1 device. Z-Wave service disabled.
- C-7 Is Z-Wave+ Only, mostly no security. running Maker, HSM, ZW Mesh Details & Device Firmware Updater. Zigbee service disabled.
Over the timespan of the results showing a slow decline in free memory which I guess means at some point I will have to reboot these or maybe it's stabilizing hard to tell.
Could this indicative of a possible memory leak somewhere? Also interesting that the C-4 is showing more free memory - I thought it was the same on all the hubs.
4 Likes
Your graphs are all showing a start date of Jan 1; did you do a reboot on that day?
Although the graphs show a decline, it does appear that you're nowhere near the "critical" level...
The physical RAM is the same on all hub, however the C3/C4 hubs are running a 64bit version of the OS/JVM. As such, the base platform consumes more RAM, and thus these hubs have a 500MB swap space on the eMMC drive. The C5/C7 do not make use of SWAP.
2 Likes
what did you use to graph that.
Following because I have seen similar on my 3 hubs. My original C5 declines fastest, then the C5 I got right before C7 came out then my C7. Just curious if anything to worry about.
1 Like
Okay that makes a whole lot of sense thanks. I knew the C-4 was 64 bit but didn't realize or forgot about the swap.
1 Like
Was quick and dirty - used LibreOffice calc. Just cut and pasted the results of the freeOSMemoryHistory into the sheet, highlighted the columns and selected insert chart. Did this for all my hubs then created a new sheet copied all the charts into it, added titles and exported to png. Am going to add this to Node-RED with polling and keep it simple. Have not gotten into grafana yet but that will probably be the next step.
I may have but certainly have rebooted since then so it looks like it retains the data for a bit.
It is natural for memory to decline over time
- the longer the system runs, the more apps will get to run (ie, if first hour, your may only run 20 apps, but over the course of a day, you run 50 apps.)
- you are correct that there are limits at which you should reboot or else things will go squirrelly
The JVM does more optimizations and stores the optimized code based on how much things run.
There may well still be memory leaks, either caused by the JVM itself (bugs), or JVM settings or apps/drivers. I know there are more improvements that come each release on these items.
The stats pages have some "errors" in how they report (trend is correct, real numbers sometimes yes sometimes no). I think Victor is correcting these for upcoming releases.
A big control you have is how big you let you DB get. Reducing DB size in my view is one of the biggest controls you have. The default is 100 items per event type - reducing this to 5-15 (if appropriate for your app), can buy a lot of memory back (it requires the db cleanup to be run, and perhaps a reboot after that to fully take effect.). For me this changed a busy system from needing to reboot daily, to only needing to reboot every 5-15 days (the range here is the more I recompile things, the more likely I am to need to reboot sooner).
An interesting feature for HPM would be to be able to schedule HPM have a reboot after a bigger set of installs. In my case, I plan if I'm upgrading a bunch of apps, to have a reboot when I'm done.
2 Likes
That seems odd to me - why should I have the expectation that memory will decline especially on a Linux based system like this. Is it a JVM thing? You'd think there'd be some sort of garbage collection or something but with a resource limited device I dunno.
The "lightest" modern computer I've worked with are RPi's (2s thru 4s) and have never messed with embedded systems so clearly have no clue when it comes to stuff like this.
Note: with the C-4 I can totally see potential issues with memory management and swapping given the constraints.
1 Like
Yes, the JVM does run garbage collection.
Most hardcore, true embedded systems that I have worked on over the past 30 years do not have the same type of issues that JVM based solutions have. Every system I have worked on runs a lightweight, real-time kernel for an operating system. All applications are written in C/C++, and we typically allocate all memory statically at compile time to avoid memory fragmentation and memory leaks. In some cases, we have even written our own dynamic memory management routines, as there are always buffers created and destroyed at runtime for sending and receiving network packets, strings from serial devices, etc... We have systems running that haven't been modified for 10+ years, and they simply hum along 24 hours a day, 365 days a year, performing mission critical tasks. Of course, the hardware we run these platforms on is industrial in both design and cost. Some single board computers cost a few thousand dollars. Network switches that we use are $500 and up. IO Modules/boards cost $100 to $7,000 each. But you can get incredibly reliable systems, that pay for themselves by avoiding a single unplanned downtime event...
I think the flexibility that running a JVM brings to the table is valuable, but it appears to come with extra baggage as well.
5 Likes
That's very cool.. I love hearing about work being done like that.. a little beyond my paygrade but interesting nonetheless. Also gets back to the seemingly forgotten idea about actually paying attention to how much resources you use in an app.
So I think I'm going to set up a quick monitoring in NR and check to see if the mem dips below a certain amount then maybe force a reboot in the evening after the cleanup runs or maybe before. Would prefer that instead of rebooting nightly or weekly.
1 Like
I'm approaching critical reboot time myself on my Main C4. If it goes below 75MB of memory, it'll end up unresponsive. Would love to get this resolved without a reboot. Seems like a hammer approach. My LAN hub is fine.
3 Likes
So, if it is inevitable that memory decreases over time, then why not schedule a reboot on a fixed basis?
Once every week/once every two weeks/once every month - take your pick!
But, just do it, and you've mitigated the issue forever!
1 Like
That is most definitely the tried and true method so probably what I will end up doing. I kinda want to see how often I need to reboot though and also am wondering if rebooting frequently could hide other issues.
2 Likes
Because every time I reboot my zigbee buttons (Lightify) require a double press for them to turn lights on.
Interesting data.
One observation is that you have Maker on all 3 hubs. When I tried Maker, I had extreme slowdowns and lots of lockups. It all went away immediately when I removed Maker. I wonder if there is something going on with it? This was way back in probably the 2.1.9 to 2.2.2 timeframe, and I haven't re-installed Maker since.
I haven't really had trouble running maker so far  but anything is possible. Also I run Node-RED exclusively as my rules engine so kind of have to keep it right now..
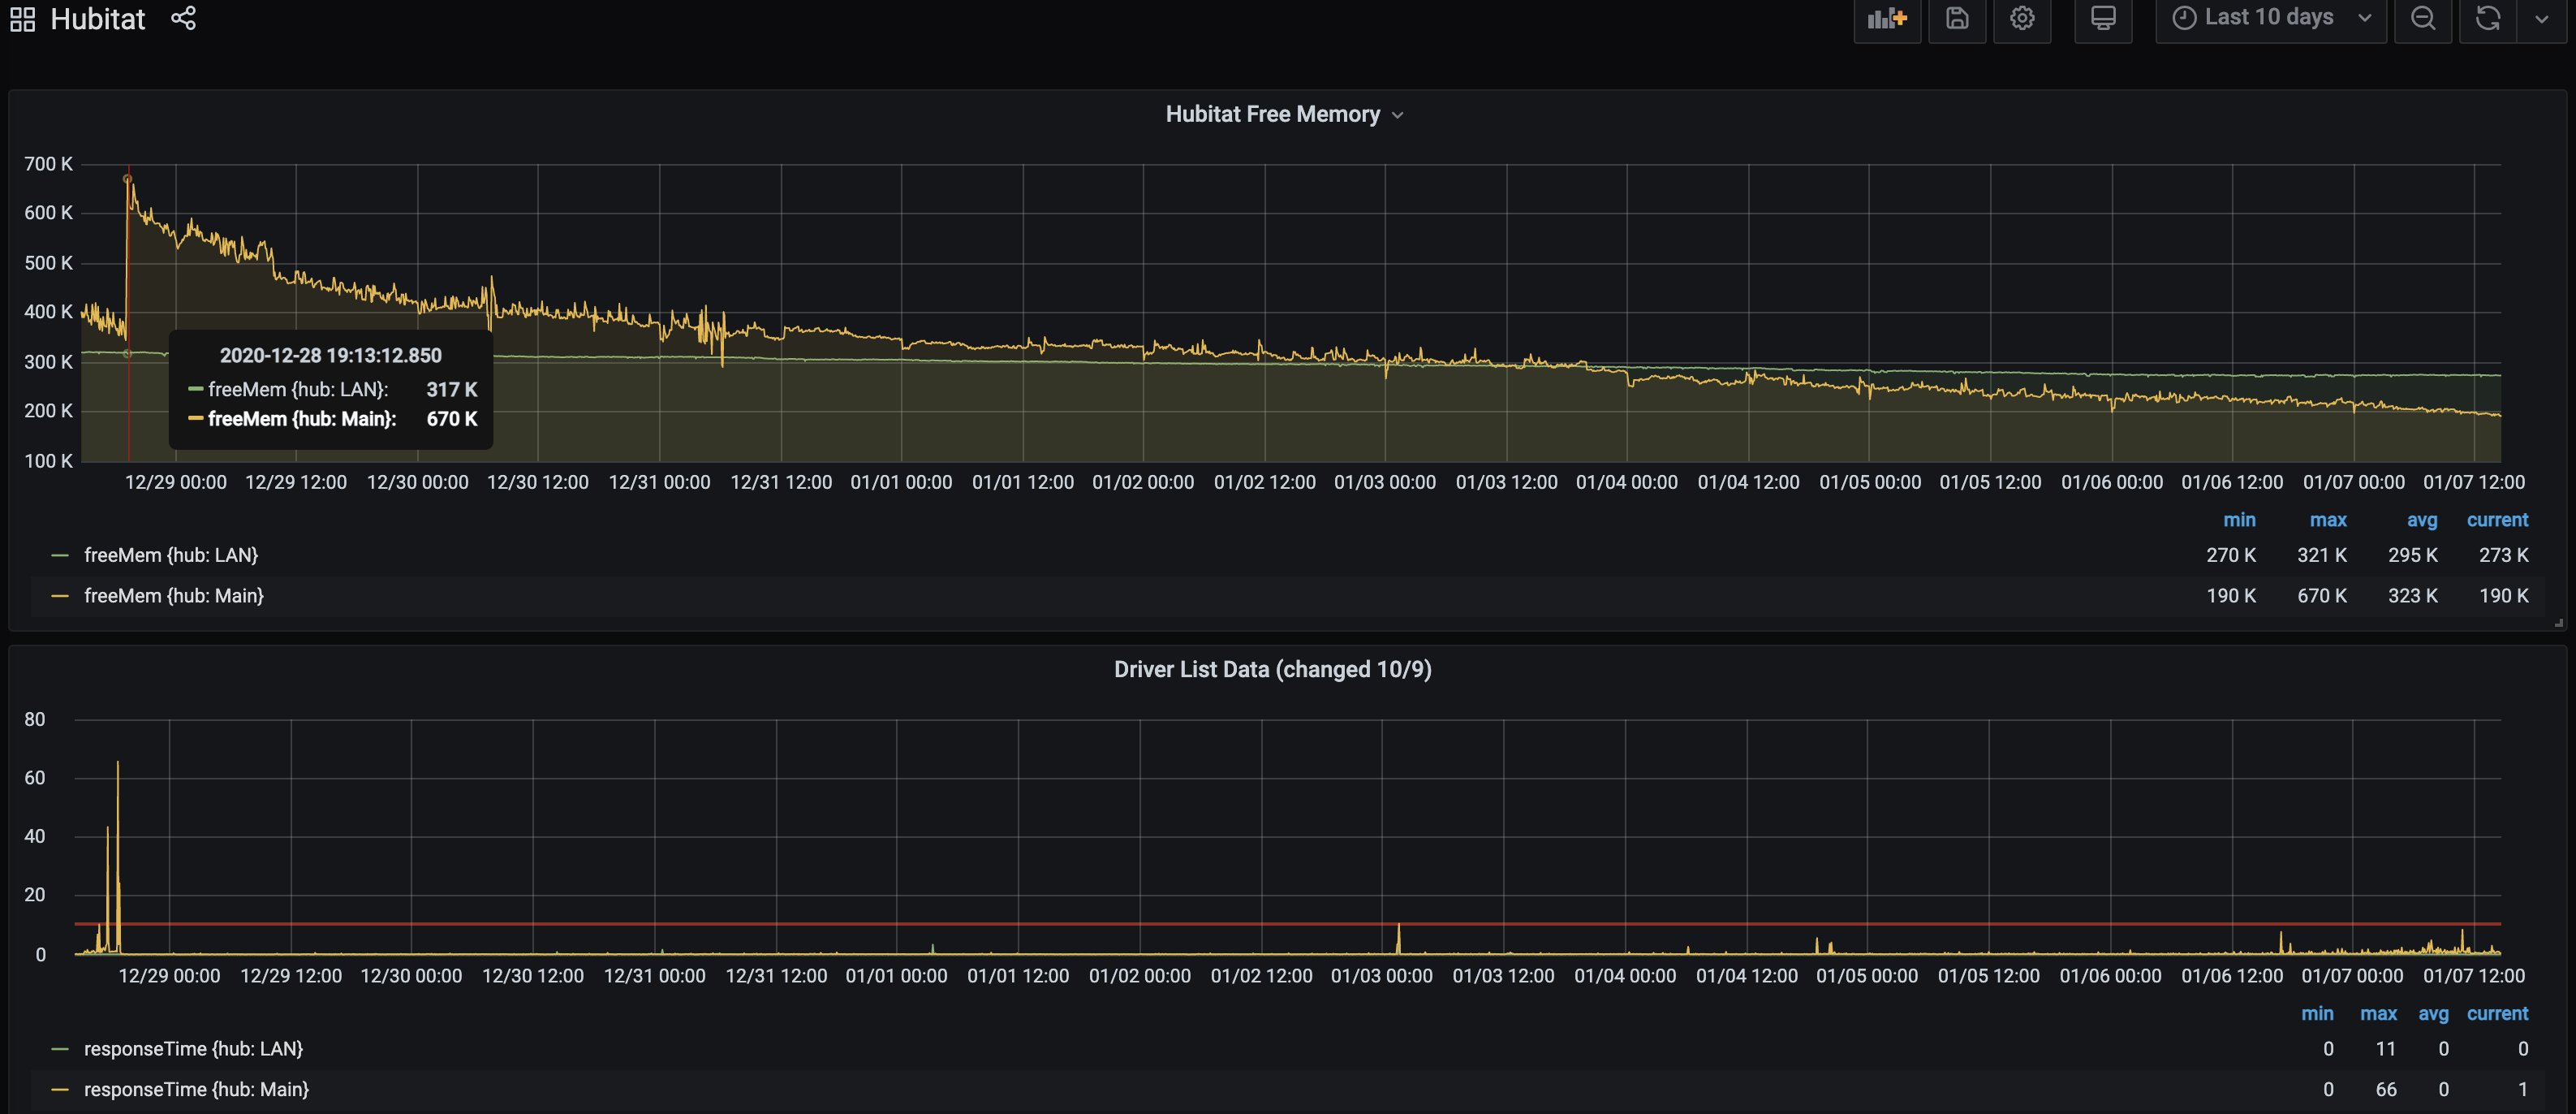
@brianwilson
If you don't mind me asking. how did you get that in Graphana. What is it's data source?
i saw the same recently on one of my hubs..i think the culpret was the shelly driver.. that is the only change i made recently and it was extremely slow today.. i removed it and rebooted.
1 Like