Sure, it's from a node-red performance flow from here: Node-RED Flow - Hubitat Performance Monitor I took his and tweaked it a bit so that it checks memory & response time and will issue a restart if performance drops below a certain threshold vs. just restarting it everyday.
1 Like
Which shelly driver, the Hubitat version?
i'm still on 2.2.3.148 and was using the shelly driver from them not the built in one..
after making sure the sluggishness doesnt return for a few days. i will try the built in one again and see. when i tried it status was not being updated without polling.
1 Like
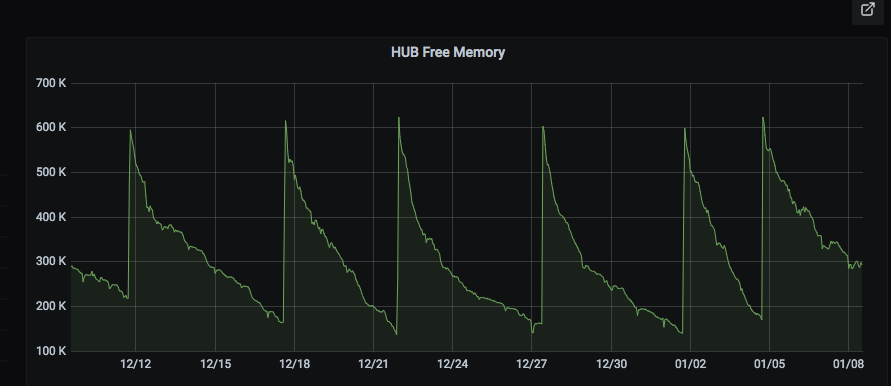
Here's my memory chart. Hub reboot needed at each of the low points on the chart due to unresponsive hub or zigbee is offline.
1 Like
Have you ever run hub stats?
I have not - just starting to get into it.
Post screenshots here once you do the stats, and maybe we can spot something...
And @cuboy29 I would be really interested to see your hub stats, that is a very unusual looking graph.
1 Like
Does anyone have an unused "empty" hub they can let run with only the OS? Would be interesting to see.
I do - 2 of them. The memory slowly goes down, then settles in at a flat line over time.
Unfortunately I just reboot node-red a few days ago, and I don't retain history on these graphs.
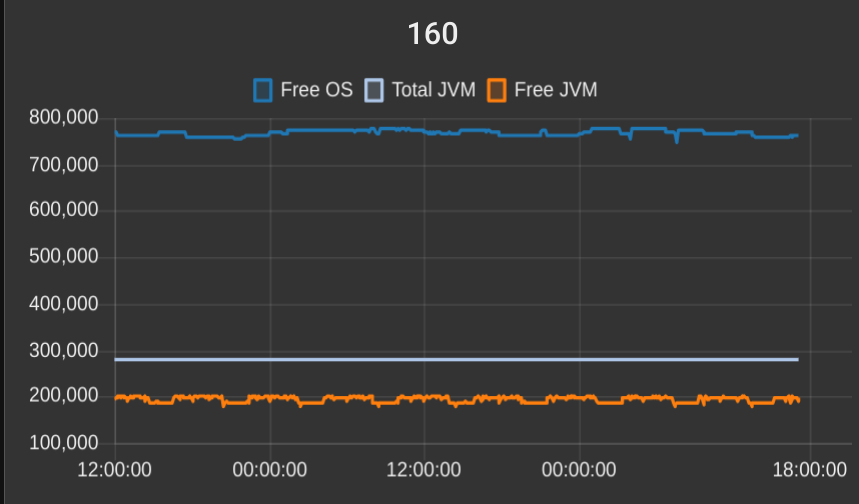
C-4 hub running since 12/11/20:
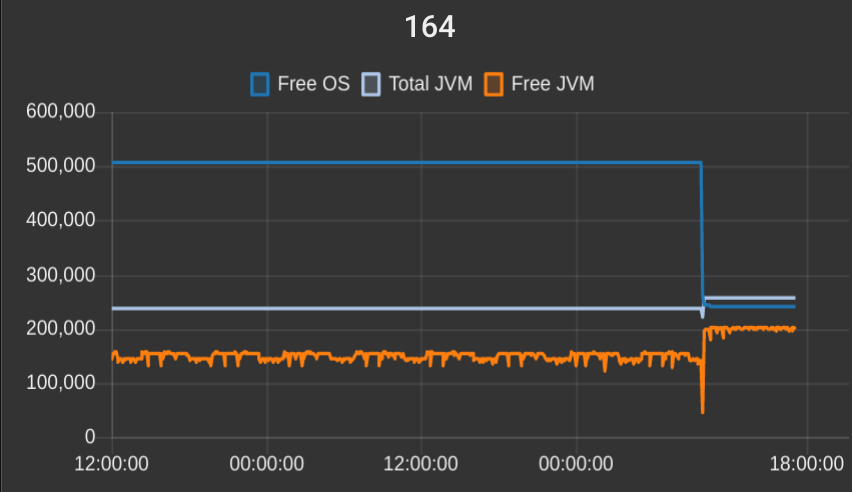
C-5 hub. This one I reboot today... For 'reasons'. Before the obvious reboot it had been running since 12/11/20.
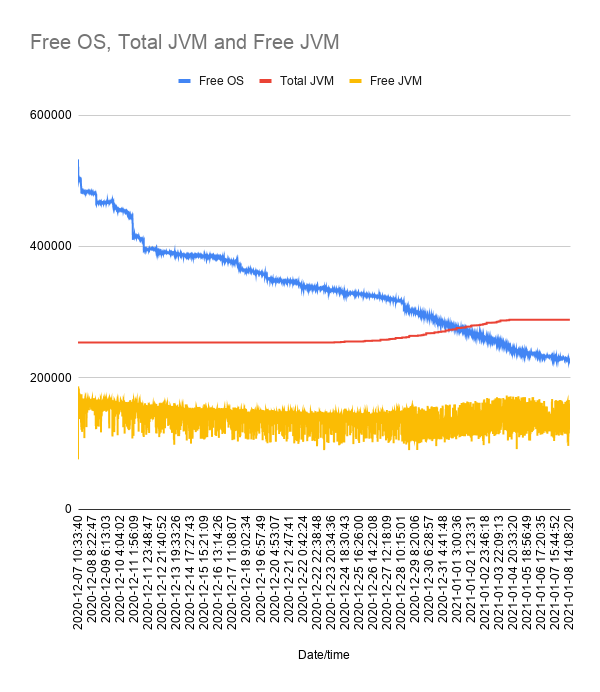
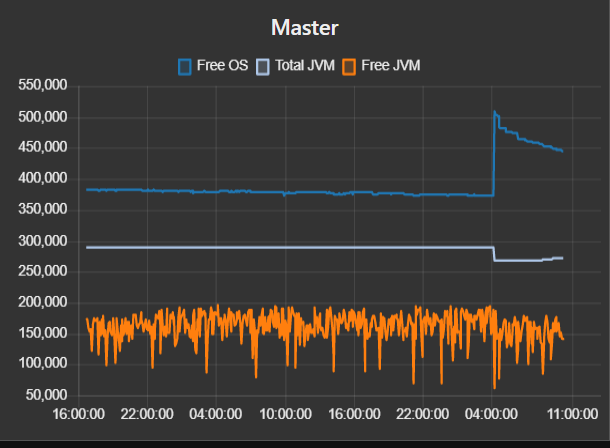
I got my hub a little over a month ago as well and decided to make my own graph to see my results. Very interesting.
Haven't had any indication that I'd need to restart yet. Low memory isn't necessarily a bad thing either. If the memory is there and the hub is using it for a good reason, than I have no complaints.
I'll keep a close eye on this and see how this goes into the future.
I would watch the Free JVM number. That is the only one I have seen correlate very strongly to hub crashes/lockups/slow response.
For me anyway - may not be the best indicator for everyone. When mine go much below 100k for anything other than a small dip it is usually lights out time.
2 Likes
I posted the stats and @gopher.ny looked into it already but didn't see anything interesting. He's recommending that I cycle power my hub twice a week for now since it's a C4 HUB.
I might jump to a C7 soon so waiting to see how things are for you guys with the C7 first 
1 Like
I see your "total JVM" increased. Up to now I assumed total JVM was hardware dependent. Kinda like total hard disk capacity.
Actually as I am reading this thread I have it stuck in my mind that the Hubitat folks are working on this and some major modifications of how the 700 series chip is handled.
1 Like
@JasonJoel - which endpoint do you poll to get the JVM memory stats?
http://192.168.x.x/hub/advanced/freeOSMemoryHistory
Then I throw out all of the data except the last row in the table. I poll every 5 minutes.
Still hoping @gopher.ny in the future adds an endpoint to only get the latest data, instead of fetching all history each time.
2 Likes
Thanks! What we need is a stats and health endpoint like: https://micrometer.io/
I was also suffering from a severe memory decline (halving over a period of a week after a reboot) but @lewis.heidrick's post here RM and a Reboot got me thinking about runcounts.
Turns out it was a maker API issue where I was sending MQTT data to node-red and then to a virtual device. A lot of the MQTT data was redundant but it kept refreshing the virtual device. Simply limiting the refresh to an appropriate rate and doing the same for all my MQTT links seems to have made a huge reduction in the loss of free memory.
So it really does highlight the need to optimise the IO to the hub wherever possible.
3 Likes
Yup which is why I point out those tools. They're often overlooked but very useful when you have no idea where to start.
3 Likes
That sounds odd to me, though... I do many hundreds, often well over a thousand, writes from Node-RED to the hub via Maker API every day. I haven't seen any memory leak from that.
How many times a day were you writing to that virtual device? Maybe I just haven't pounded it hard enough yet. lol
In the end, if that is what fixed your issue - then good! Just weird that Maker API would cause issues for you and not others.