I just tested mine and it works fine.
I'm sorry, I don't use it and I don't support it, but when I tested it out recently it worked fine. I can only assume you missed a step in setting it up, maybe step 12?
Thanks.
Much appreciated.
Hello. Is anyone using this app succesfully?
I am using it to record my thermostat activity. The first time I set it up, I quickly went through the instructions and it failed. The second time, I just went through the setup steps one by one and it works great.
Thanks @chuck.schwer
ok so I guess you have not detected any slowness or performance issues caused by the app right ?? just asking because as you know it is been told that some apps could cause issues and I am doing a sanity check to be safe to install it. So nothing detected so far? thanks
I have not noticed any slowdowns with this app.
1 Like
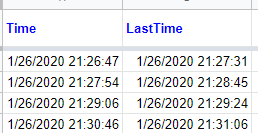
I managed to install the app with no problems but the only thing is that it creates 2 times:
time and LastTime when I select the interval to push data to google higher than 0 minutes. Any idea why? I would be expecting only one time:
Hi Chuck, just finished my little project to monitor some temperature sensors with Google Sheets and Google Data Studio for the dashboard. The installation of Google Sheets Logging was a breeze and I'm very pleased with the final result. Thank so much for this great tool. Let me know where I can send my contribution
Greetings,
I had a script running on SmartThings to do this, but finally kicked the SmartThings completely to the curb. I set this up on one of my Hubitat Hubs and everything is working well, with one issue. The logging spreadsheet will only log to 100 rows and then overwrites. Is there anyway to increase the number of rows that the script will write to? I looked through the code and couldn't find anything that looked obvious, mind you I am a novice at scripts. I have extended the spreadsheet to over 10,000 rows, but it only writes the 1st 100.
Any help is much appreciated!
1 Like
This is a fab app - just got installed and logging humidity/temperatures nicely for an Aqara sensor in a cold frame in the garden (where I'll be moving our tortoise in the Spring).
Question from a Hubistat novice: Is there a straight-forward way to adjust the frequency of logging? Ideally I would record one reading per hour.
I haven't come up against the 100 row limit yet, but I wonder if this is an issue, and if there is a work around?
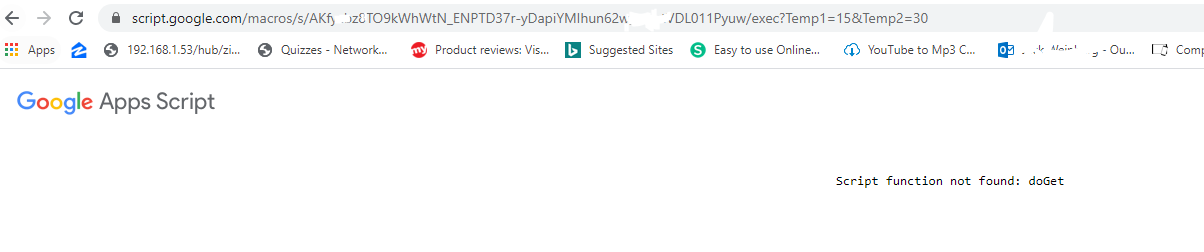
@jtmpush18, I'm getting the same error you had, did you ever figure out what caused this? I tried going through the instructions (some have change in the script editor) but it does look ok, but for some reason I keep getting this error that I just can't find an answer of to why?
Wow...
That was a long time ago...
Yes, I did eventually get it working, but how, I don't really remember.
May I suggest, by the way, instead the activity viewer driver?
I think that it does more or less the same thing.
LOL ya I figured but took a chance ![]()
I'll check that out and see if that would suit my needs, thanks!!!
@nclark Did you find an answer to this. I ran into the same issue and its because I didnt use the code snippet on github. The example in the image is just of what needs to be changed. Not the entire code. Check out the code.gs file. Got mine logging fine yesterday but still trying to figure out the fields and how it writes the date/ time.
@daniel.schaff_hubita, no gave up on it for now, not really sure what the problem is but it's most likely user error because of the options that changed on Google's side or something because most of the procedure described on the Github page does not match at all what I'm seeing on my screen. Also yes I did copy the Code.GS file from the Github page as you asked.
Thanks for the help anyway.
Is anyone still using it successfully? I Had mine paused and now that I wanted to activate it again, it does not look to work anymore
I had this working a year or so back. In Smartthings and then for short time in Hubitat before I changed some devices and screwed it up.
Wife wanted to know how her green house was preforming compared to outside temp.
I set up a day ago and got it working after a couple of attemps. I got erros for a couple of attemps, but finally was able to make step 16 work.
Now have to remember how to format data to make a graph for her.
I used the code and recomendations from [chuck.schwer]
Thanks for the tip, will retry now that someone got it working again, if it works, I'll do a step by step with current info!

