As you know I've been running 2.2.4 since the first beta release, and haven't had any significant issues. Today I woke up to a mesh that is lagging quite badly. Automations, direct control of devices from the device pages, and using voice via GH are all affected. Seemingly unaffected: Bond integration, Lutron Picos and Zigbee devices they control, and Zigbee motion/contact sensors are all fine.
So looks like a Z-Wave issue.
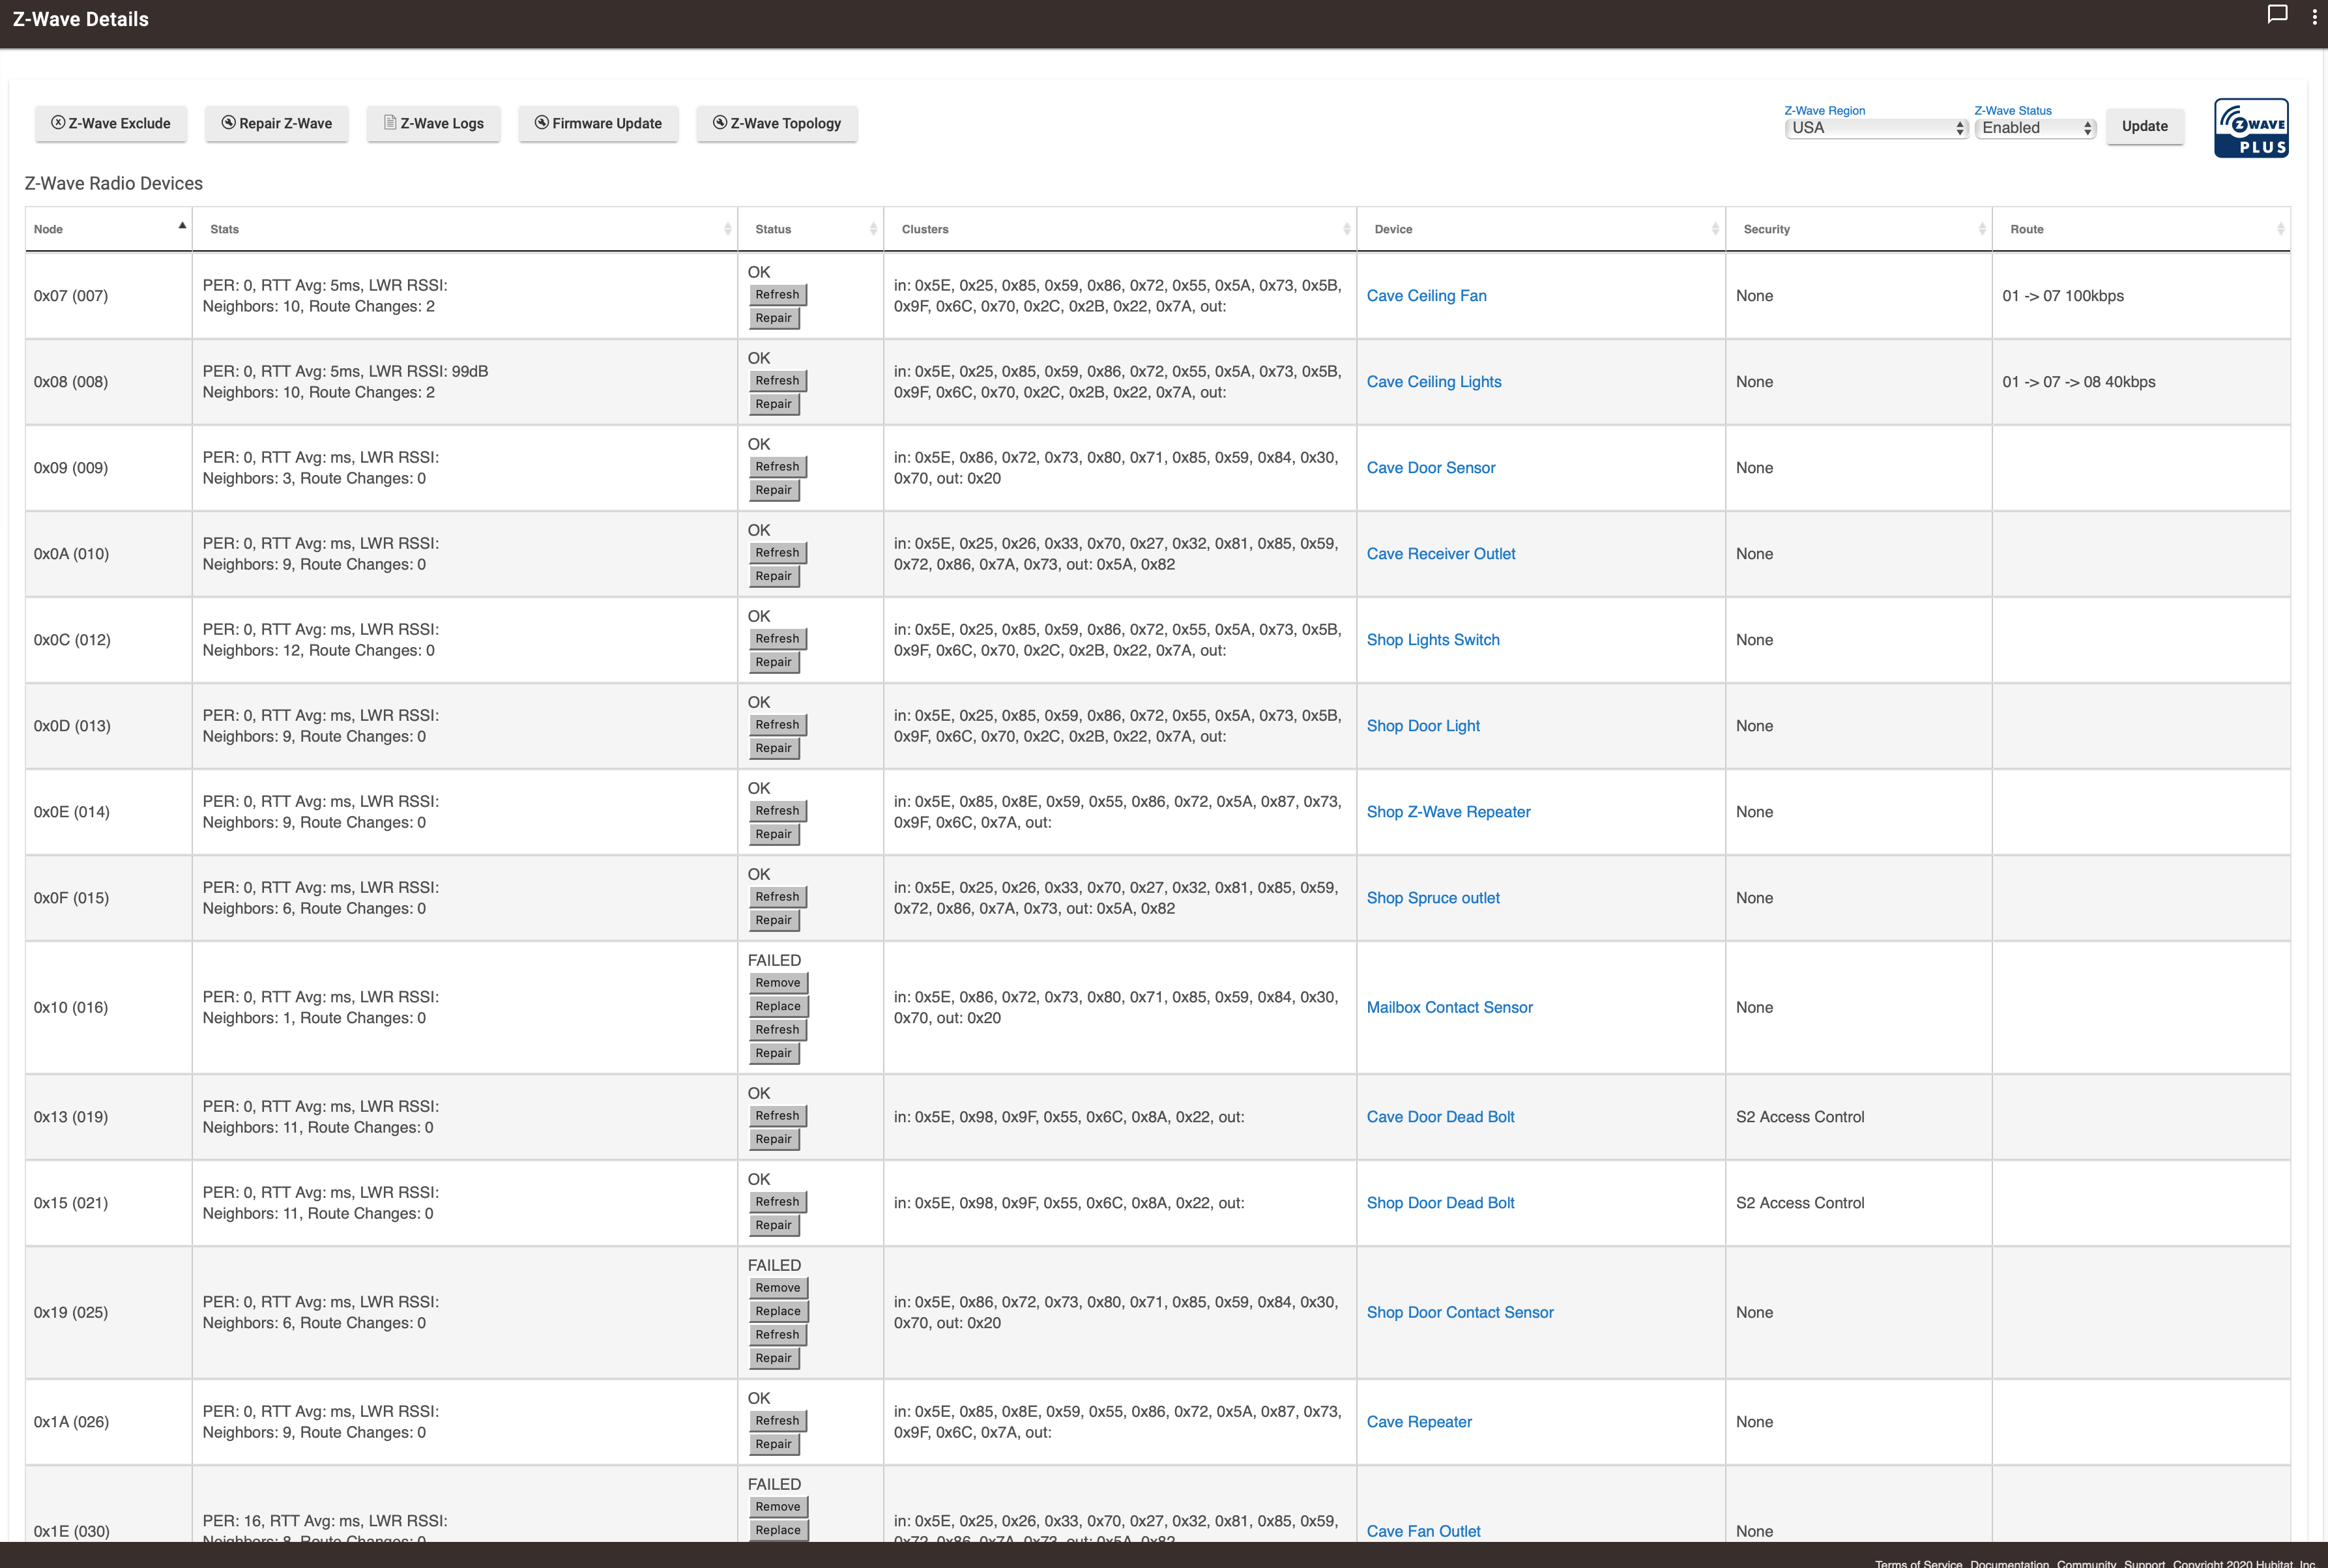
Z-Wave details page looks boringly normal, same as yesterday and the day before, etc. No new devices added or other changes to the mesh. Every device is 40 or 100 kbps connection, except two switches which have been at 9.6 for weeks w/out causing any issues on 2.2.3 and 2.2.4.
I've PM'd you both my hub UID in case you want to look at any logs.
Thanks...since the issues include the same non-responsive/lag w/direct control of devices from their device pages and via automations, it seems a broader mesh issue rather than directly GH related.
I'll soon start a new thread with more details about my unique experiences, but just chiming-in to share that I noted the same problem this morning. I have a fully "closed" ecosystem -- all local Zigbee and Z-Wave devices. Upgraded to 2.2.4 last night. This morning all my Z-Wave stuff was completely unusable. No (or extreeeeemely slow) response from automations, scenes etc. for Z-Wave devices nor direct control via the Devices page. ZigBee items unaffected. Womp
I don't have any Nest devices integrated other than one GH integrated via Chromecast integration, and via Community GH integration. No other Nest devices - my Protects and Nest thermostat are still on my ST hub.
There's nothing in my logs indicating any Google/Nest devices causing noise, or any issue in general that I can see. I did notice that I had a Zigbee lux sensor reporting lux every 10 seconds [oops!] but it's been doing that since I installed it weeks ago w/out issue. I just set it to five minutes as I had originally intended.
Indeed it'd be my pleasure. I'll share all the useful information I can think of with you guys as soon as I have an opportunity You can expect something within the next 24hrs.
@danabw You know me... I need some data to go off of or at least some sort of hint... Been running 224 as long as you and not experiencing any of the issues you describe. Maybe run hub stats? Check the hub memory?
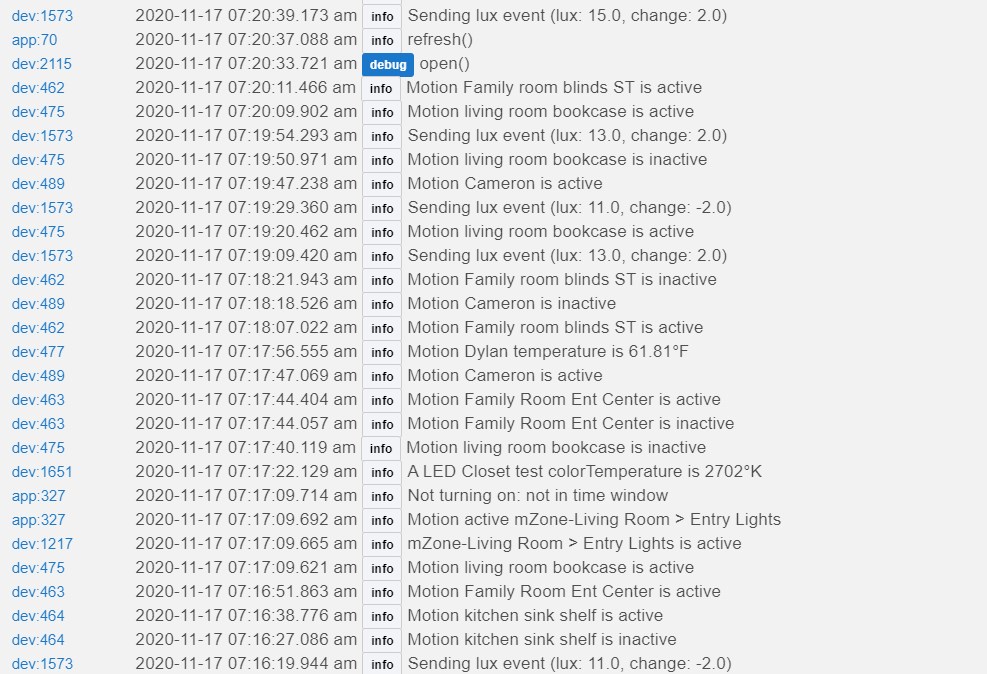
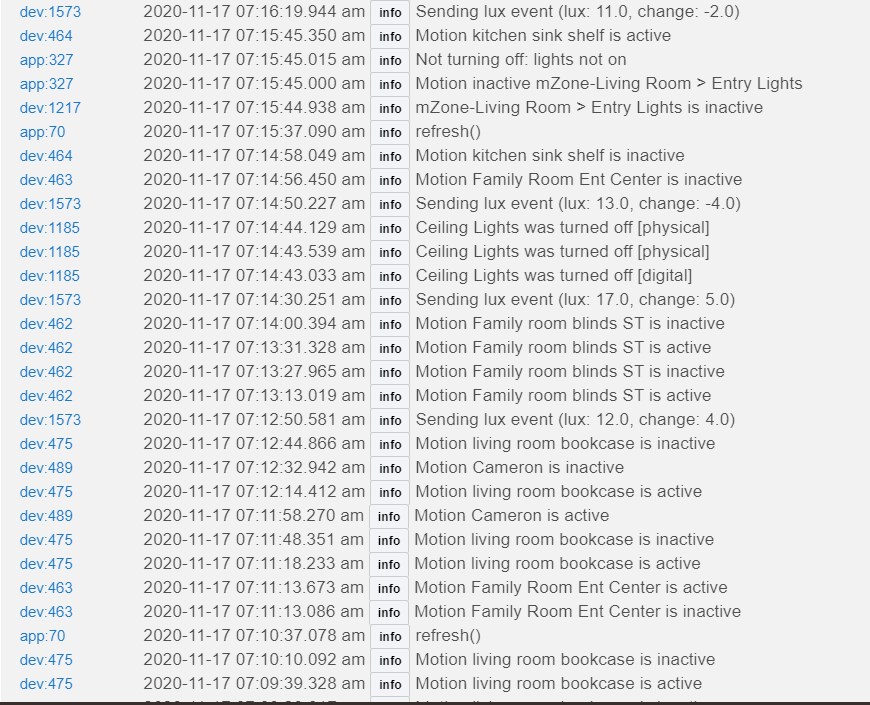
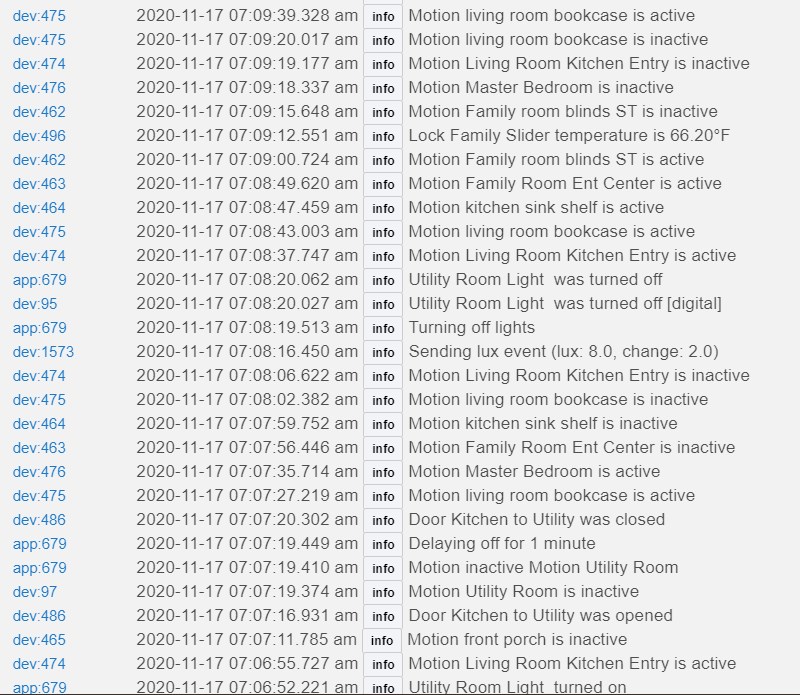
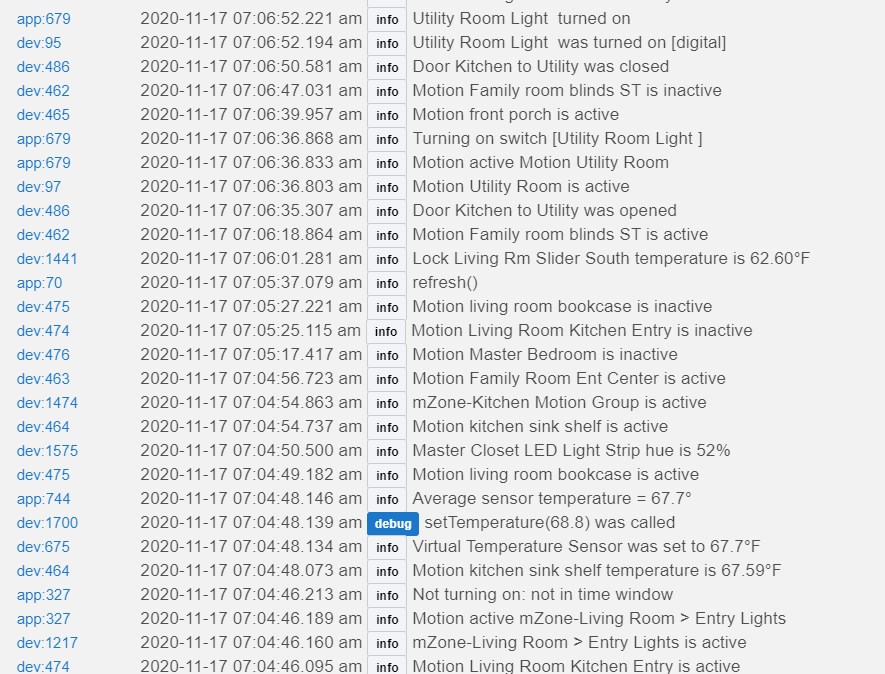
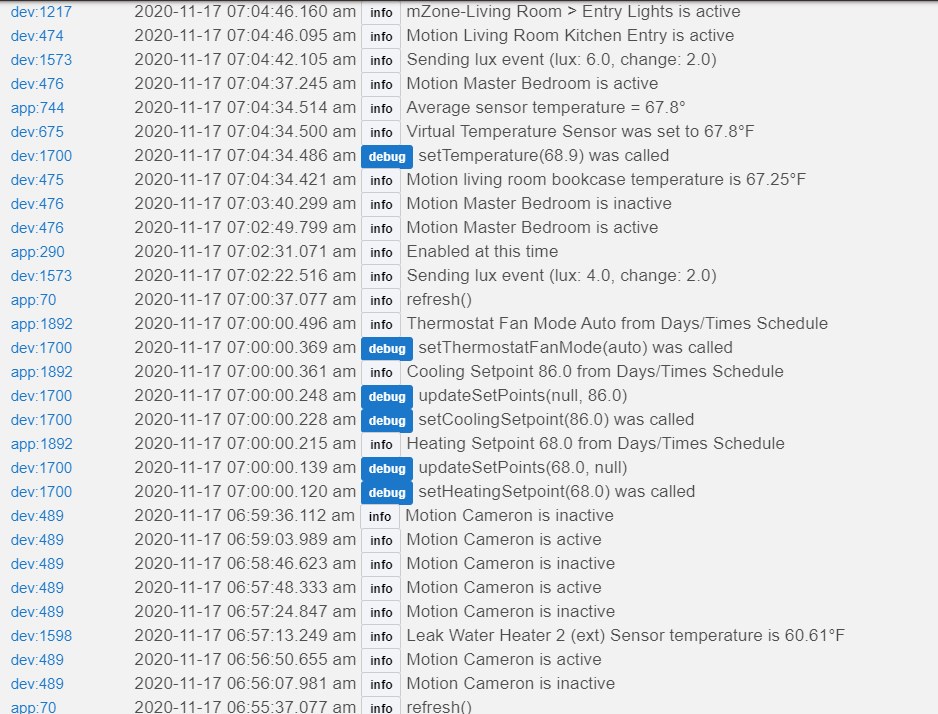
Some logs from around when I got up and came out to the kitchen and noticed things were heavily lagging...nothing interesting going on overall that I can see.
The failed devices are just battery powered things and they go into not responding or failed because they are sleepy end devices and is expected but not an issue. The missing routes are interesting though. Could you safely shutdown and pull power for a minute? Does it start responding again?
Device Stats enabled: true
Device stats start time: 1605632628201
Device stats total run time: 140051
device id 1573 runcount 1 total runtime 53 average run time 53
device id 1635 runcount 15 total runtime 66 average run time 4.4
device id 1637 runcount 15 total runtime 54 average run time 3.6
device id 1639 runcount 15 total runtime 45 average run time 3
device id 1641 runcount 15 total runtime 44 average run time 2.9333333333
device id 1680 runcount 15 total runtime 49 average run time 3.2666666667
device id 1643 runcount 15 total runtime 45 average run time 3
device id 129 runcount 20 total runtime 149 average run time 7.45
device id 465 runcount 1 total runtime 12 average run time 12
device id 361 runcount 2 total runtime 8 average run time 4
device id 1575 runcount 1 total runtime 15 average run time 15
device id 464 runcount 3 total runtime 21 average run time 7
device id 675 runcount 1 total runtime 6 average run time 6
device id 1700 runcount 2 total runtime 67 average run time 33.5
device id 463 runcount 2 total runtime 23 average run time 11.5
device id 462 runcount 2 total runtime 18 average run time 9
device id 475 runcount 2 total runtime 28 average run time 14
device id 1697 runcount 13 total runtime 681 average run time 52.3846153846
device id 1025 runcount 2 total runtime 28 average run time 14
device id 1441 runcount 1 total runtime 11 average run time 11
device id 42 runcount 2 total runtime 186 average run time 93
device id 43 runcount 2 total runtime 186 average run time 93
device id 44 runcount 2 total runtime 191 average run time 95.5
device id 45 runcount 2 total runtime 204 average run time 102
device id 46 runcount 2 total runtime 186 average run time 93
device id 47 runcount 2 total runtime 206 average run time 103
device id 48 runcount 2 total runtime 186 average run time 93
device id 49 runcount 2 total runtime 189 average run time 94.5
device id 50 runcount 2 total runtime 185 average run time 92.5
device id 51 runcount 2 total runtime 190 average run time 95
device id 52 runcount 2 total runtime 187 average run time 93.5
device id 53 runcount 2 total runtime 203 average run time 101.5
device id 54 runcount 2 total runtime 185 average run time 92.5
device id 55 runcount 2 total runtime 185 average run time 92.5
device id 56 runcount 2 total runtime 184 average run time 92
device id 57 runcount 2 total runtime 185 average run time 92.5
App Stats enabled: true
App stats start time: 1605632628201
App stats total run time: 140070
app id 1281 runcount 223 total runtime 2654 average run time 11.9013452915
app id 71 runcount 5 total runtime 2763 average run time 552.6
app id 7 runcount 6 total runtime 152 average run time 25.3333333333
app id 290 runcount 1 total runtime 14 average run time 14
app id 1891 runcount 4 total runtime 363 average run time 90.75
app id 744 runcount 1 total runtime 67 average run time 67
app id 1671 runcount 6 total runtime 181 average run time 30.1666666667
app id 16 runcount 6 total runtime 36 average run time 6
app id 1764 runcount 3 total runtime 523 average run time 174.3333333333
app id 2113 runcount 6 total runtime 1329 average run time 221.5
app id 2114 runcount 6 total runtime 2653 average run time 442.1666666667
app id 1217 runcount 3 total runtime 91 average run time 30.3333333333
app id 2049 runcount 3 total runtime 83 average run time 27.6666666667
app id 70 runcount 49 total runtime 10816 average run time 220.7346938776
App 70 is a Rain Machine integration. It has a five minute polling interval as part of its settings. That's been running for many many months like that, so I don't think it's indicative of any new issue.
Oddly, I don't even see an App 1281 in my logs when I look at past logs/all logs. Is there another way of of searching for that app other than in past logs?
They're long but probably cloud stuff. The runcount isn't high on those so not really that big of a deal. If runcount and run time are both long it's an issue.