Yes, the text size of the other templates, like Humidity, temp, etc. will be changed in 2.0.8 to match closer to the size of other text elements, like dashboard, link and attribute
1 Like
Please provide step by step instructions on how to reproduce, starting with browser and OS version, and platform version.
If using Edge, try another browser, we don't support Edge.
Ok Patrick. Sorry. It was Edge browser…. With chrome it works.
Thanks!
Ok, think we found the render issue with Edge. But since even MS says its broke and they are switching to a chromium render engine, its hard to spend anytime troubleshooting it.
3 Likes
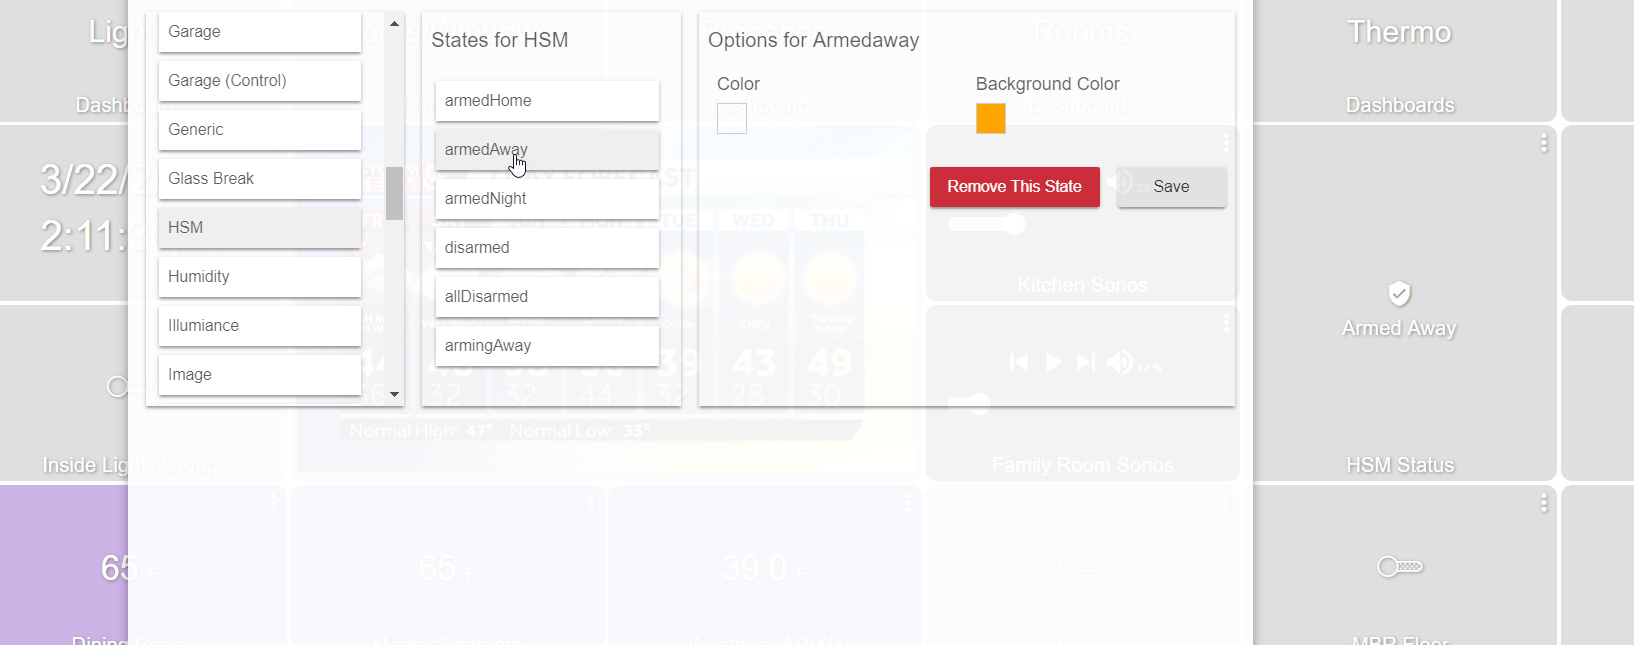
Did I miss a step? I have been trying to update the tile background colors more to my liking.
As you can see here, I marked ArmedAway to be Orange, I did this a few hours ago, and clicked save of course. I have tried refreshing the dashboard. I have not tried changing the state of the alarm itself. Instead of the default red or green, I seem to have made it grey.
I got temperature to update to the purple you see in the bottom left.
Can't follow your steps. Please help me out with specific steps to reproduce.
First of all are you trying to say that the HSM tile doesn't use your custom colors you defined?
In short yes.
Steps:
I clicked gear -> templates -> selected HSM -> selected each mode (I was actually trying to update all 'armed' states to orange -> selected 'Background Color' (now note, I find this to be rather buggy - to write these notes, I am in there again, now the box to show the color is empty, as if I have not set any custom color. In past instances, I have found the color showing as green [which I set for disarmed, clicking around between the States for HSM and it will change back and forth from Orange, Green and blank without logic - I have set and reset the armed states to orange multiple times])) - then clicked save.
The end result is a grey tile not whatever was the default - red I think, nor my custom color
Separately i have been able to get the Temperature template to change (and stick) to purple on this same dashboard.
Hope that helps.
Are you clicking "Save"
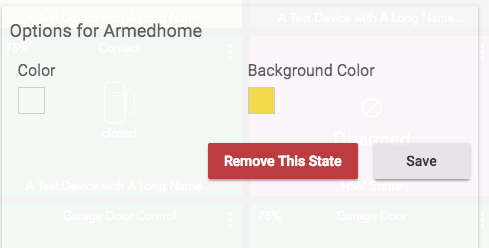
It will preview the color change but you need to save it to make it stick.
Hi Patrick, yes. I have been using save. I tried it again for the 5th or 6th time. It really is finicky and actually clicking save does not do anything visual on the screen to let you know it registered. Even a screen blink or the color dialog to close up, etc would help. It worked this time.
It is weird it was clearly registering something as it turned grey rather than the default red.
I do not know, but as I said, it worked this time. I'll try to keep perfecting the click flow.
Excellent job on the new dashboards hubitat staff. I love it, totally made my day & weekend
I have a quirky observation, the dashboard tiles do not use the same default, device label, as the webpage. It's inconsistent and confusing. I know I can set device label to match device name.
Is there a purposeful reason behind this or possibly a preference to change it?
Thanks
1 Like
Label is the User set value and is what Dashboard uses and the main hub UI uses if set.
Name is what comes from the manufacturer during the pairing / set up process.
Not sure what you mean when you say dashboard tiles do not use the same device label. They are the same.
Maybe I've missed something, but I am unable to get Dashboards to work on my old iPad since the 2.07 update. I like the new features, and I use a first gen iPad as my panel. My guess is there's something in the modern css that isn't working. I get just a white screen.
Is there a workaround?
If this is just using safari on the iPad,
Maybe try Chrome or Firefox.
I have the same issue, Hubitat config menu works, but some of the options do not. I see the different dashboards that I have created, but when I click on one, I get a white screen. I have tried Safari and Chrome. I also noticed I could not load Rule Machine. Just says Please wait, loading app Rule Machine, in both Safari and Chrome.
I am using a iPad 3. I have the latest version this iPad will allow, 9.3.5.
Hubitat Elevation™ Platform Version 2.0.8.109
Hardware Version Rev C-5
Hopefully there is an easy resolution.
Chrome and Firefox won't install on an iPad running iOS 9, and you can't out 10 on the old pads.
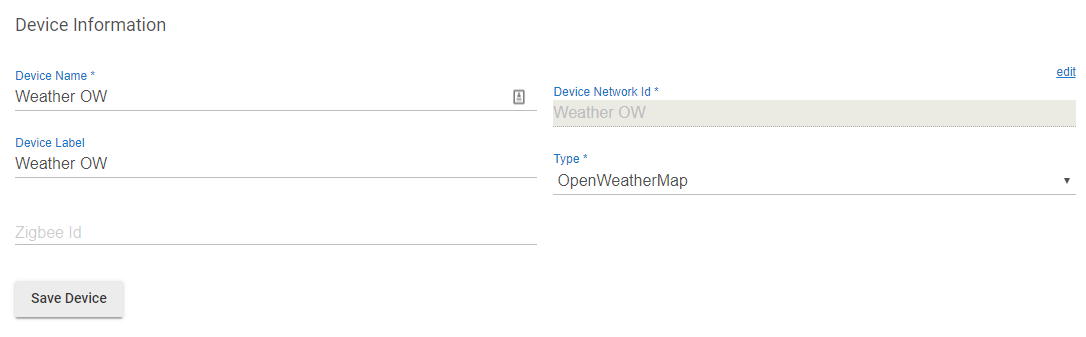
I’ve added the weather tile but no information is pulled for it?
Support for anything but the latest version available is very tough to maintain.
iOS 9.3 is the last version (3 major releases behind latest) for older iPads and iPhones.
iOS 9.3.x and Safari do not support CSS Grid. However, the error that is causing the white screen has nothing to do with this.
Since it is so old, it doesn't support the latest javascript arrow functions. The section of dashboard code that was using this has been fixed and back ported to support older browsers.
When this patch is deployed (most likely 2.0.9) older ipads and other browsers will support a limited subset of features for dashboard. Since grid isn't supported, it will just be a left to right, top to bottom list of tiles. It's enough for basic functionality, but position, order, layers, etc. will not be possible on older devices.
I also noticed today that when you click on a image and expands it cuts off the top and bottom of the image. I tested it on my android phone, laptop and office computer and all 3 had the same effect.

