Up to date in HPM (haven't switched to HE version of webcore), latest version of HE, not finding any obvious webcore errors in HE logs.
What cleared the previous, non-dismissable alerts was updating webcore - not that I specifically updated webcore to get rid of these alerts, just that they were gone after the update.
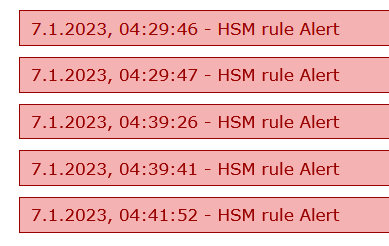
but they're still sticking around in the dashboard:
They appeared immediately, but dismissing them in HSM doesn't make them disappear - not even after 15 minutes.
No error in logs. Nothing else that's unusual. I'll go through the troubleshooting steps and I'll keep an eye on the alerts, but currently, they're cleared in HSM and still visible in the dashboard.
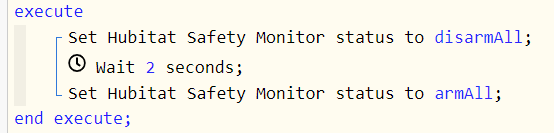
@Shenanigans / @nh.schottfam same with me. I found a work around in creating a piston with the action "Set Hubitat Safety Monitor status to disarmAll" and after a wait of 2 seconds back to disarm. This clears the alerts in webCoRE for me. As I said, a workaround but I would be happy to get rid of these annoying messages.
HSM has the option of configuring a switch to cancel alarms which opens up a few options, and if you want the nuclear option disarming and then re-arming HSM will also clear the alarms.
Yeah, I just noticed that disarming the rules does make the alerts in the webcore dashboard disappear. However, I can't just disarm the rule that triggered the alert - it seems like I have to disarm all HSM rules in order to make the webcore dashboard alerts disappear.
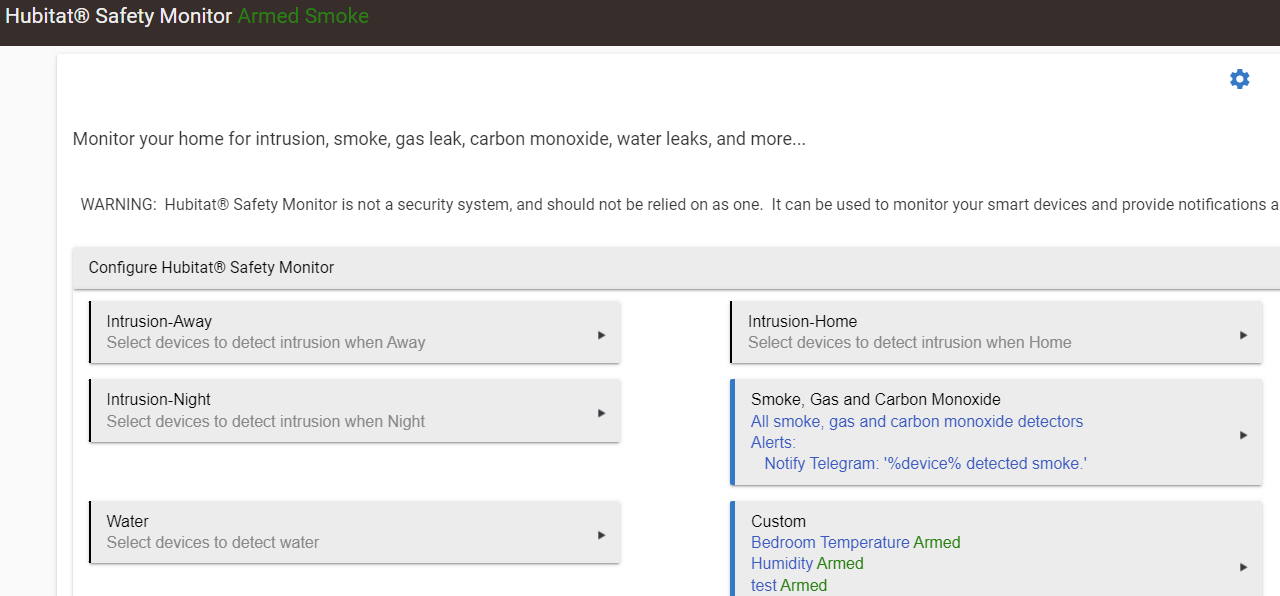
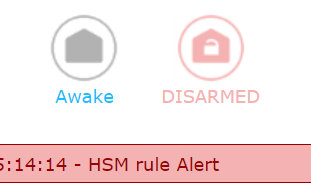
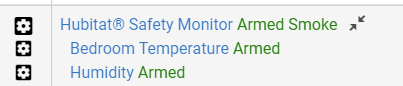
What's also really weird is that the webcore dashboard shows HSM as "disarmed" but with an alert
when the actual HSM is armed and all alerts are cleared.
I used the same approach.
First step "disarmAll" and after a wait of 2 seconds a "disarm". That clears the HSM arming alerts in webCoRE. I used this with some conditions.
Now I'm thinking about using a "make a Get request" to set HSM. Hopefully I get rid of the messages in webCoRE and don't need the disarmAll function anymore.
New release (HPM update) pushed today. Will flow into built-in as HE rolls out new firmware.
Changes:
Cleanup of handling hsmAlerts, and clearing alerts
ability to set arming delay when issueing setAlarmSystemStatus command
fix for threeAxis attribute exception
updates so webCoRE UI can backup and track backup status (if using automatic backups)
webCoRE IDE may ask if you want to backup items, it is ok to let it, as it detected backup items may not be accessible if account ID changes have happened.
improve handling of failed parse of hub variable of type datetime
updates so webCoRE IDE can more accurately display custom parameters for custom device commands
updates to improve webCoRE IDE operations (reduction in data sent while IDE is open)
fixes to remove old value/expression settings (that are no longer being used)
adjustments to event tracking to reduce warning in the IDE for tracking triggers.
Many thanks to @ipaterson for UI side updates on dashboard and staging.
I have come across a strange issue maybe someone can help with.
Currently I have multiple instances of webcore installed. They are all configured with the same Location & Account Identifiers. With both chrome and edge, all instances except for one are having an issue with creating a new piston. Using the normal steps, but i'll list them anyway.
Click New Piston
Create a blank piston (All 4 options here all ending in the same result as Create Blank.)
Enter Author & Name followed by create
The screen says loading piston followed by the database update message. When the message goes away I am left in a totally different piston on another instance of webcore registered in the list. When I go back into the drop down list and choose the original instance where I tried to create the piston, it is listed in the paused section as blank.
I have logging set to full and here is the output:
app:582023-01-10 02:59:39.133 PMtracebroadcastPistonList sent
app:582023-01-10 02:59:29.946 PMdebugDashboard: getDb sending new db current: v0.3.114.20230109_HE in server