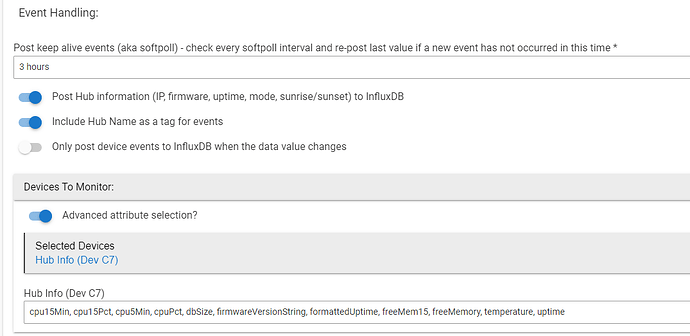
Does that hub have Matter Enabled?
yes.. 2 devices ..
Enabled in the driver AND selected in the logger app?
What caught my attention it is showing version 2.3.7.120 but the hub is running 2.3.7.122.
This can happen if the event with the firmware version gets missed somehow. I have a special instance of the logger app setup with the soft-poll enabled so it would post it eventually. I could also switch the dashboard to use the other data point being sent by the app itself (and not from the driver), but that would not work for people using custom data logging. Might be able to do some sort of coalesce so it falls back if not found.
I'm starting to wonder if it isn't matter that's pushing that CPU. I pulled everything but basic hub info off being monitored, still pegged at 51.3%. Removed influxDb from that hub, still pegged at 51.3. Shut the hub down and left it shut down for about 10 minutes, came back up still pegged at 51.3. There is actually not much on that hub. No apps or automations, just devices that are shared via hub mesh to another hub that has all the apps, automations and rules on it.
One thing I would do is to see if you can dampen the motion detectors. 5 seconds to declare motion inactive seems a bit aggressive to me (I have mine set to 1 minute)
I believe that was just the default. I don't recall ever changing them. the actual rules that use them are mostly set to 7 minutes of inactivity before they trigger the rule.
Do you really need to log the motion data in InfluxDB?
in hind sight, no not really. at this point its still just playing with it to see what i can do with it.
This entire post is about high cpu with matter https://community.hubitat.com/t/2-3-7-112-124-cpu-use-load-averages/126787/332?u=jtp10181
But it should still vary, sounds like the hub info driver is not updating for some reason. You need to check the endpoint directly, I will post it in a few minutes unless someone else has it handy.
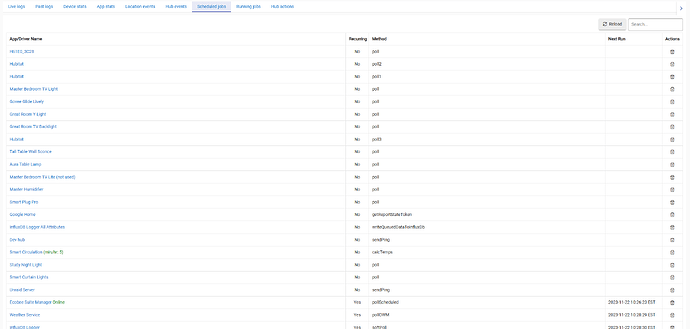
Something i would point out with matter as well is i have been having a really bad time getting stats into InfluxDB on occasion. It is a problem on a few fronts but all centers around jobs that are scheduled to run failing to run and or not scheduling there next jobs. Here is an example of what I mean.
This screen shot shows many jobs on my hub that are sitting on the scheduled jobs page , but with no next run value. These jobs are also not recuuring. Essentially they are stale jobs that aren't doing anything. The jobs with the name of "Hubitat" are HubInfo Driver. It hasn't updated for quite sometime, What is even more problematic is that InfluxDB Logger has some failed jobs as well in the same state. This is really bad as it is the writeQueuedDataToInfluxDB job. That means it is no longer writing to InfluxDB.
I am currently trying a few things to see if i can kick it and get it back, but i suspect a reboot should help this. That said i am a little discourage when you say above that you turned it off for 10 min and nothing changed. I am on 2.3.7.124 now, but expereienced this allot after first enabling Matter. I have had to do a reboot each time i loaded a new version of Matter to recover from this issue. What is different this time though is it didn't show up till a little after 4am.
I do t know what going on clearly isn’t related to your app. I hav now even disabled ,after, Still pegged at 51.3 , five days now. There are no Blanche I’m ,y s he dukes jobs table. Influxdb removed. All that on the device now is zwave and zigbee devices. Not even any automations. I’m really at a loss at this point.
I believe that was just the default. I don't recall ever changing them. the actual rules that use them are mostly set to 7 minutes of inactivity before they trigger the rule.
While you may not have any actions that are happening until 7 minutes of inactivity have occurred, the rule is still being evaluated every time there is an event from the sensor (active or inactive). That's not an insignificant amount of CPU.
In general, even without rules, chatty devices can significantly impact hub performance. Especially S0/S2 devices. Always best to eliminate unneeded events if you can.
One thing I would do is to see if you can dampen the motion detectors. 5 seconds to declare motion inactive seems a bit aggressive to me (I have mine set to 1 minute).
Most of those are Ring Gen2 motion sensors. I don’t see that changing that clear time is an option. On the two zooz motion sensors I have, I have changed it there.
Can you do a few things for me?
- Click on the gear next to the InfluxDB logger instance you have and scroll down until you see the section for "Application states". There should be a state value called loggerQueue. How much data does it have in it. Is it allot:
- Just a little below that do you see a section called Scheduled Jobs. What jobs do you see listed there.
- Go to the Devices section of the UI and scroll down until you can select the HubInfo Driverv3. scroll down until you can see values for "lastPoll" and "lastPollTime". What are those values.
- if you scroll down to the bottom of that device's page do you see jobs scheduled for each of the poll intervals you setup for HubInfo Driver.
- Lastly what happens if you click on the refresh button for the Hubinfo device.
Can you also confirm if Matter is enabled or not.
I will have to reinstall and reconfigure it, I disabled/removed it to eliminate that the load spike wasn’t coming from it.. That is why I don’t really think this issue is related to influxDB, as that CPU is still spiked, even with it gone. Even after I disabled matter (and before I removed influxDB ) it was/is still disabled, still at 51.3.
You need to check this endpoint directly to get the true CPU load number
http://YOUR.HUB.IP/hub/advanced/freeOSMemoryHistory
You need to check this endpoint directly to get the true CPU load number
CPU Load

Click on the gear next to the InfluxDB logger instance you have and scroll down until you see the section for "Application states". There should be a state value called loggerQueue. How much data does it have in it. Is it allot:
Just reinstalled and reconfigured it. the dashboard is the same as it was before .
CPU Load and States"


if you scroll down to the bottom of that device's page do you see jobs scheduled for each of the poll intervals you setup for HubInfo Driver.
no, blank
Lastly what happens if you click on the refresh button for the Hubinfo device.
nothing
Matter is still disabled.
However (maybe glimmer of hope?) .. While the Dasboard now shows 51.3%, , the Hub Information device now shows CPU Pct at 5.5
no, blank
Did you setup the polling time intervals in the config section of the HubInfo Driver.
The key with the dashboard is it is just showing you the data based on the interval select in the upper right corner. If there isn't new data nothing changes. You can also get stuck with unchanging data if your interval is set to something like between this and that day and time vs last 7 days. You may want to check that to.
Did you setup the polling time intervals in the config section of the HubInfo Driver.
Do you mean these?
You can also get stuck with unchanging data if your interval is set to something like between this and that day and time vs last 7 days. You may want to check that to.
I don't see how to get to say anything other than between two dates.. Now to Now doesn't do anything.
Summary
![image|690x105]

OK, go to Now to Now, but then I lose the hub that's having the issues.
Most of those are Ring Gen2 motion sensors. I don’t see that changing that clear time is an option.
I’m guessing Parameter 6. Technical manual is here.
I'll have to play with that later, I have no idea if it worked or not. I've been up close to 24 hours, so my attention span can't keep up with that log scrolling so fast. It all looked to same to me.
Go to bed, sleep is a health requirement. See you on the other side of at least 8 hours. ![]()


