Are all of your hubs successfully posting to InfluxDB?
Depends on the dashboard. Only one is posting to the Hub Information dashboard, the original one (and that is currently the only infomration I am looking for from the 2nd hub). The third hub Also does not post to that dashboard, but I see devices from it on other dashboards, HVAC (my ecobee) and Sensors (TESLA Powerwall and Ecobee sensors), but again it does not post to the hub infmoration board. ADn currently my primary interest is to monitor hub resources (free memory, DB size, CPU load and uptime primarily).
We need to separate Influxdb Logger loading data from HE to InfluxDB Cloud and Grafana dashboards. Lets first focus and make sure data is getting into INfluxDB Cloud from your hubs and that is the question from the previous post.
Once we are confident that is working then we change directions to the dashboards in Grafana.
Ok so lets start with a few things. I know these are captain obvious questions, but often times it is the simple stuff that is the issue.
- Do you have the Hub Info v3 driver loaded on each hub and running polling at reasonable intervals to collect the data for each metric
- Does the HubInfo devices on each hub have different names for each hub it is on.
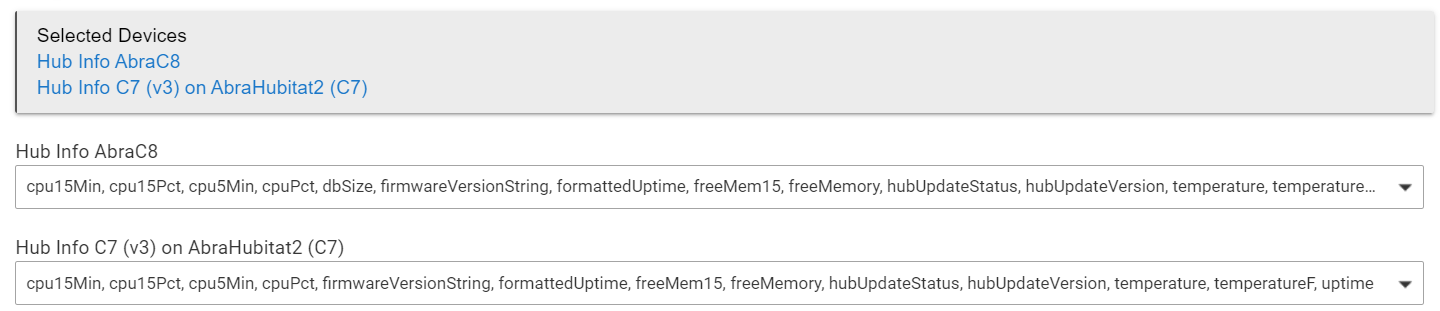
- Do you have InfluxDB Logger using the advance all attribute option with the correct attributes selected for each hub.
1 Like
I was adding my C7 to InfluxDB running on the C8 (shared from C7 to C8 via hub mesh).
At first the C7 would not show up in Grafana.
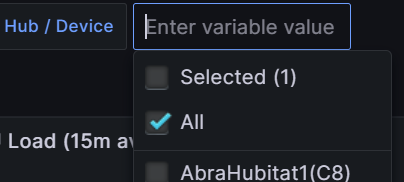
Then I changed Tag Name from hubName to deviceName and suddenly all the C7 data was displayed along w/the C8 data.

Can someone clarify why hubName doesn't work, but deviceName does?
That's it. I've reproduced it. Although the documentation does not say that a space is illegal in a bucket name, and you can create one in the UI, it does not appear that you can post to one via HTTP. No level of escaping the space appears to work. I'm guessing that there is a bug in InfluxDB's parser for the URL portion of http requests.
The URL is not stored as part of the data, so as soon as the bucket was changed, posts started succeeding, so there wasn't a "Failed record" log entry to be found.
2 Likes
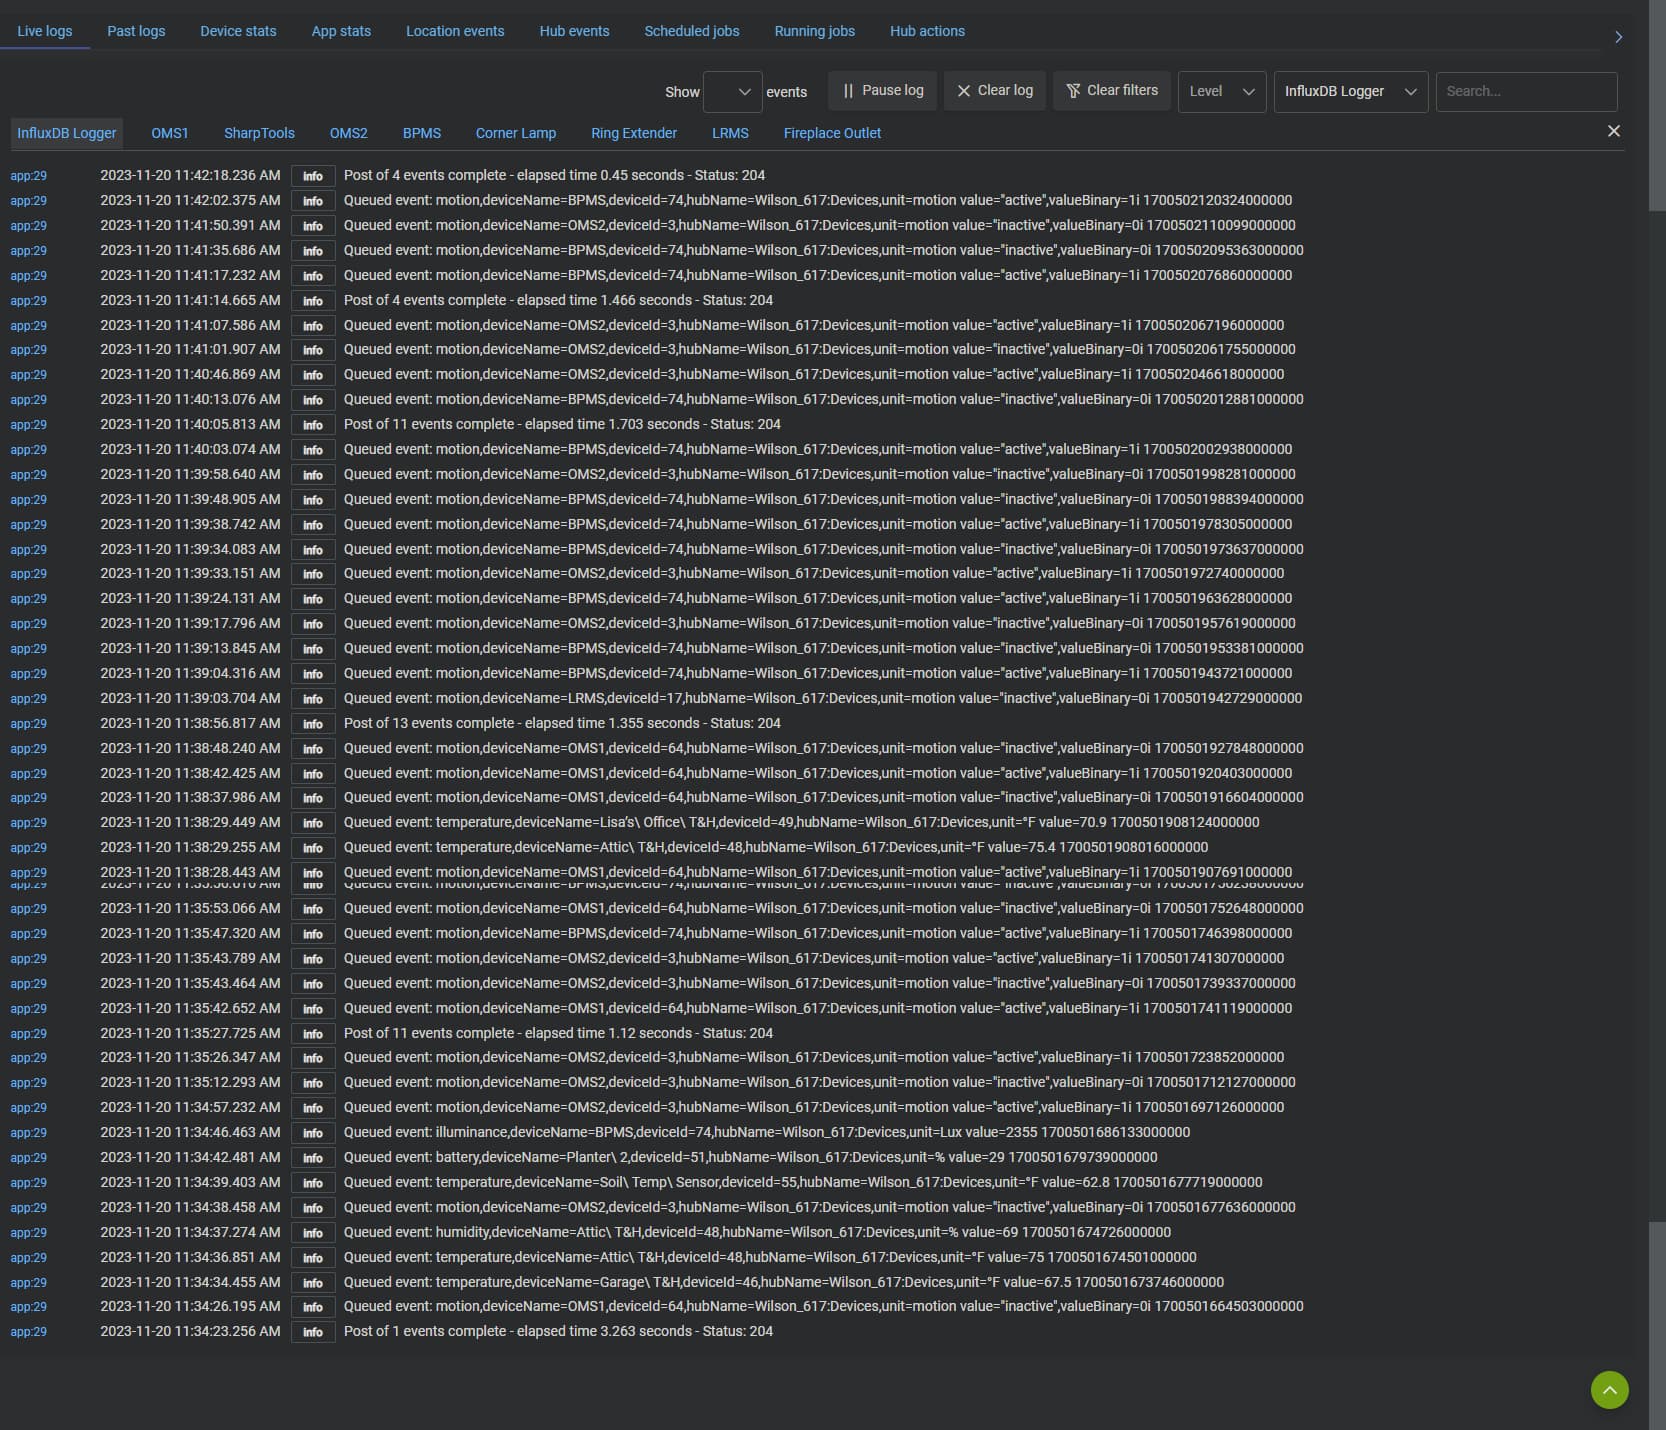
The logs I have been posting are the only logs are the only logs that are being generated bi influxDB logger. If there’s a way to get more or something different, how do I do that?
When I started I double checked, and made sure all were on version 3. Yes, they are all on 3. I have not changed any reporting intervals from what the defaults are. The only changes I have made are the batch changes we made yesterday. The reporting option in the other two are set identical to the first one which is reporting.
Yes. We went over that last night (15 posts above ![]() )
)
Yes, wit regard to hub info All three are set identically.
This was it. I never thought to change Device name. I was looking under Hub Name, and it was only showing the one hub there.
2 Likes
Same...not sure why, hopefully Denny or another of the gurus will know why. ![]() Possibly the same space issue? My C7 has a space in its name.
Possibly the same space issue? My C7 has a space in its name.
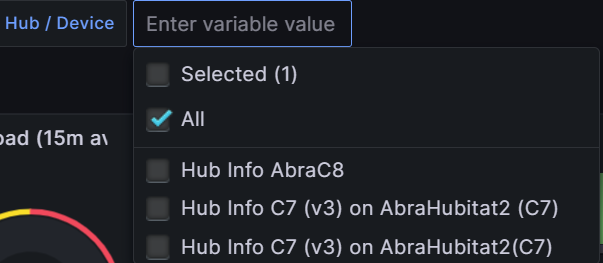
Well no, not the space in the Device name. Removing the space and refreshing Hub Mesh, Hub Info, InfluxDB, and Grafana ended w/the same, generally, Using hubName still only shows my C8. However, when I change to deviceName I now see three devices - my C8 and my C7 with and without space. ![]() Since the data from the C7 w/the space is still in the DB, makes sense.
Since the data from the C7 w/the space is still in the DB, makes sense.
Well, I think the space issue was my error when I was setting up the second and third hubs. The bucket ID is Hubitat. When I set those up I put it as Hubitat Home. I caught that difference when I was double checking everything last night and removed Home all together. Home is the organization name.
The hub that was working originally is a C8. The two additional hubs are C7. None of my hubs have spaces in the hub name . I think it had to do with needing to change to device name. Once I did that, then the rest of the hubs were visible. I never would have thought of that.
Nine hubs!? Or auto-correct for "None?" ![]()
Not auto correct, just lousy texting skills! I have 4 hubitat hubs, 1 Ecowitt hub and a currently idle Hue Hub.
1 Like
Because you shared both hubs from the same hub (with the device meshed), so the hub name is the same on both as far as the logging app is concerned. So you have the data for both but that chart was mashing it together if you group by hub name.
3 Likes
Ah, thanks, that makes sense!
1 Like
I added a warning about special characters in Database, Org and Bucket Names to the URI configuration page.
2 Likes
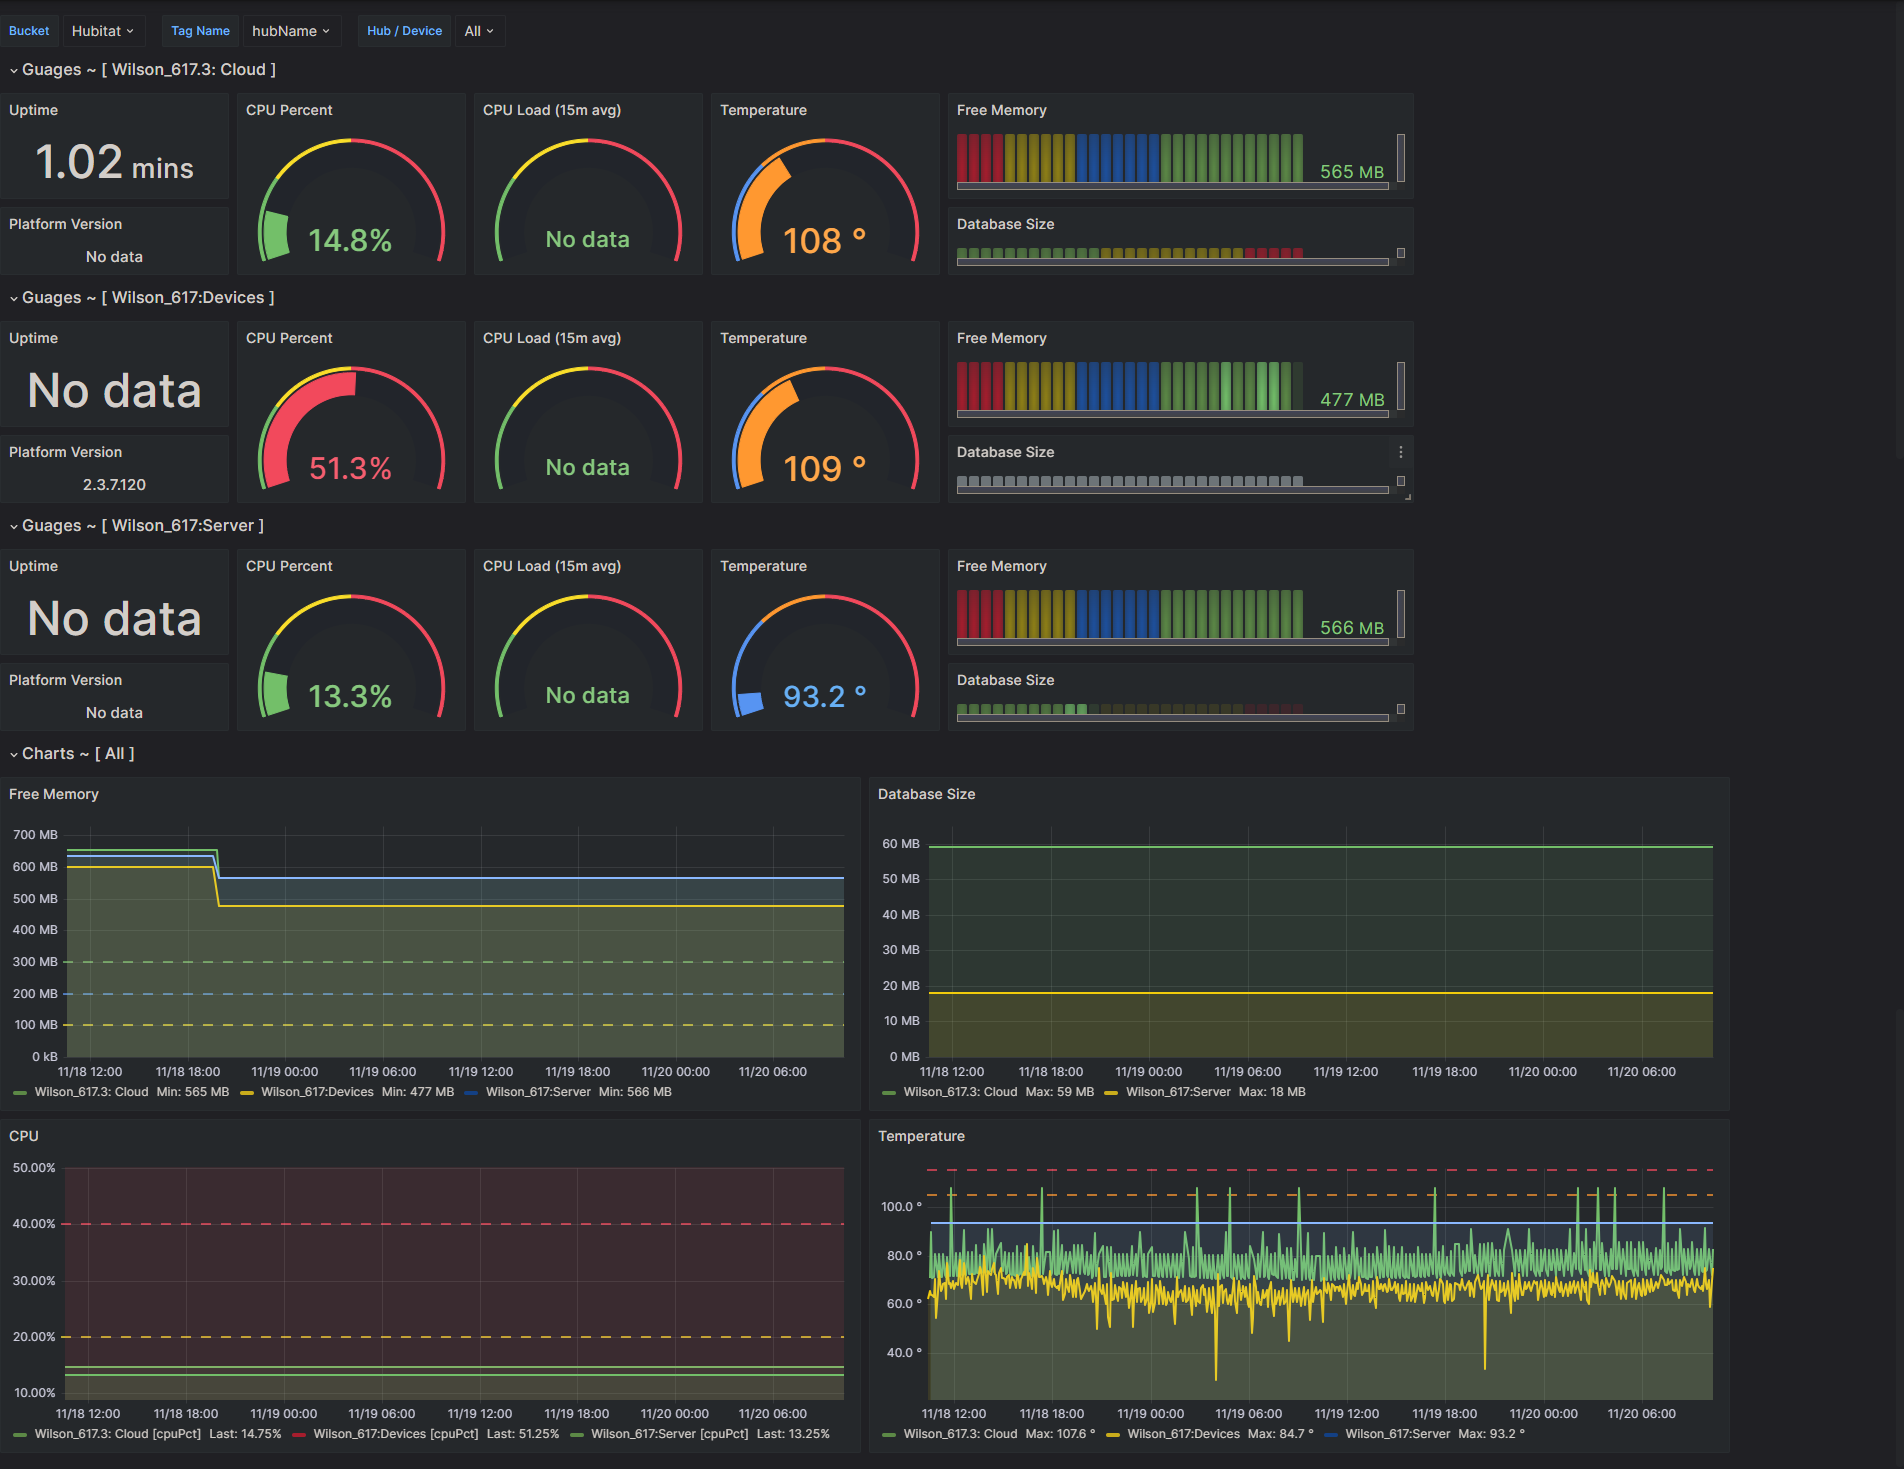
I started this as a separate thread under the lounge category, but I have now deleted it as I have determined that I don't think it is updating the dashboard correctly. For several days now one of my hubs has been showing a 51% load. it has not budged at all, up or down. I just noticed that the firmware version displayed on the dashboard is incorrect, it's a version behind the hub, so I think something is not working. I tried deleting the dashboard and reinstalling it, but it just seemed to pick everything up from the original dashboard again.
The hub in question is the middle, device, however, I also have been unable to get any of them to show the 15-minute load averages. The device hub information has been unchanged, exactly as it is here for at least three days now. I figured it would have eventually settled down. That hub has no automation or rules, only, just about 25 or 30 Zwave, Zigbee and Matter devices. Even the cloud-based stuff is on a different hub, so I really don't get why the load would be so high.
Try rebooting it or opening the InfluxDB Logger app and clicking done again in the lower right corner. I have noticed that under certain circumstances the beta builds are breaking the scheduling to upload data to the DB that would cause this.
You may also have other jobs in a bad state as well. You can check this by going into the Log section of the UI and then going to the schedule tab. If you see several jobs with no time just sitting there you are having this issue.
This isn't exactly a InfluxDB Logger app issue as much as it is a problem with the Hub firmware scheduler in the beta build.
1 Like
Make sure you did not mess with the time/date range at the top of the dashboards. Otherwise all the DB does is display the data so there is really nothing else that can be wrong with it. If data is not there it has nothing to show.
Make sure you have these 3 metrics selected for sharing: cpu15Min, cpu5Min, cpuPct
Also the 15 min avg requires that you enable it on the Hub Info driver, if not enabled it wont have any data.
It says 2 days. through 11:58 this morning. What caught my attention it is showing version 2.3.7.120 but the hub is running 2.3.7.122.
Yep, those are checked.
One thing I would do is to see if you can dampen the motion detectors. 5 seconds to declare motion inactive seems a bit aggressive to me (I have mine set to 1 minute). Do you really need to log the motion data in InfluxDB?
Have you look at the Hub Information device itself? Does it show 51%?
I hadn't even thought about looking there. Yeah, it does. Seems weird that it's been that high for so long, and there really isn't much on it. I dropped everything off influxDB except hub information device
Not that it is necessarily a important piece of info, but the Hub Information Devices does list the correct firmware version, where the dashboard is a step behind.

