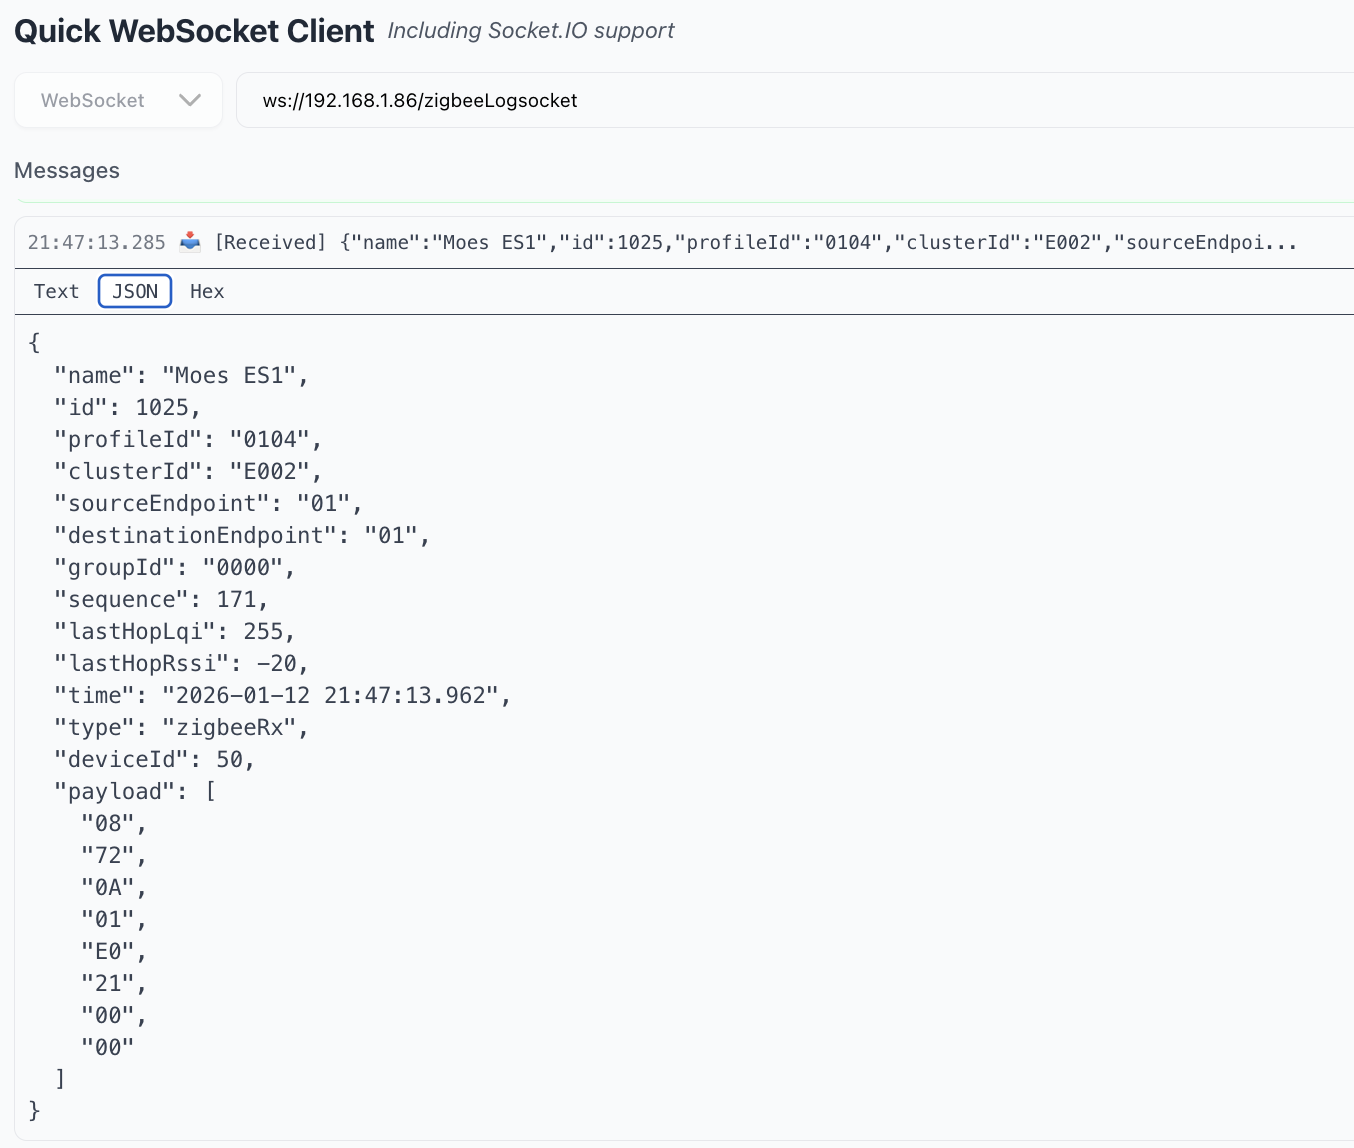
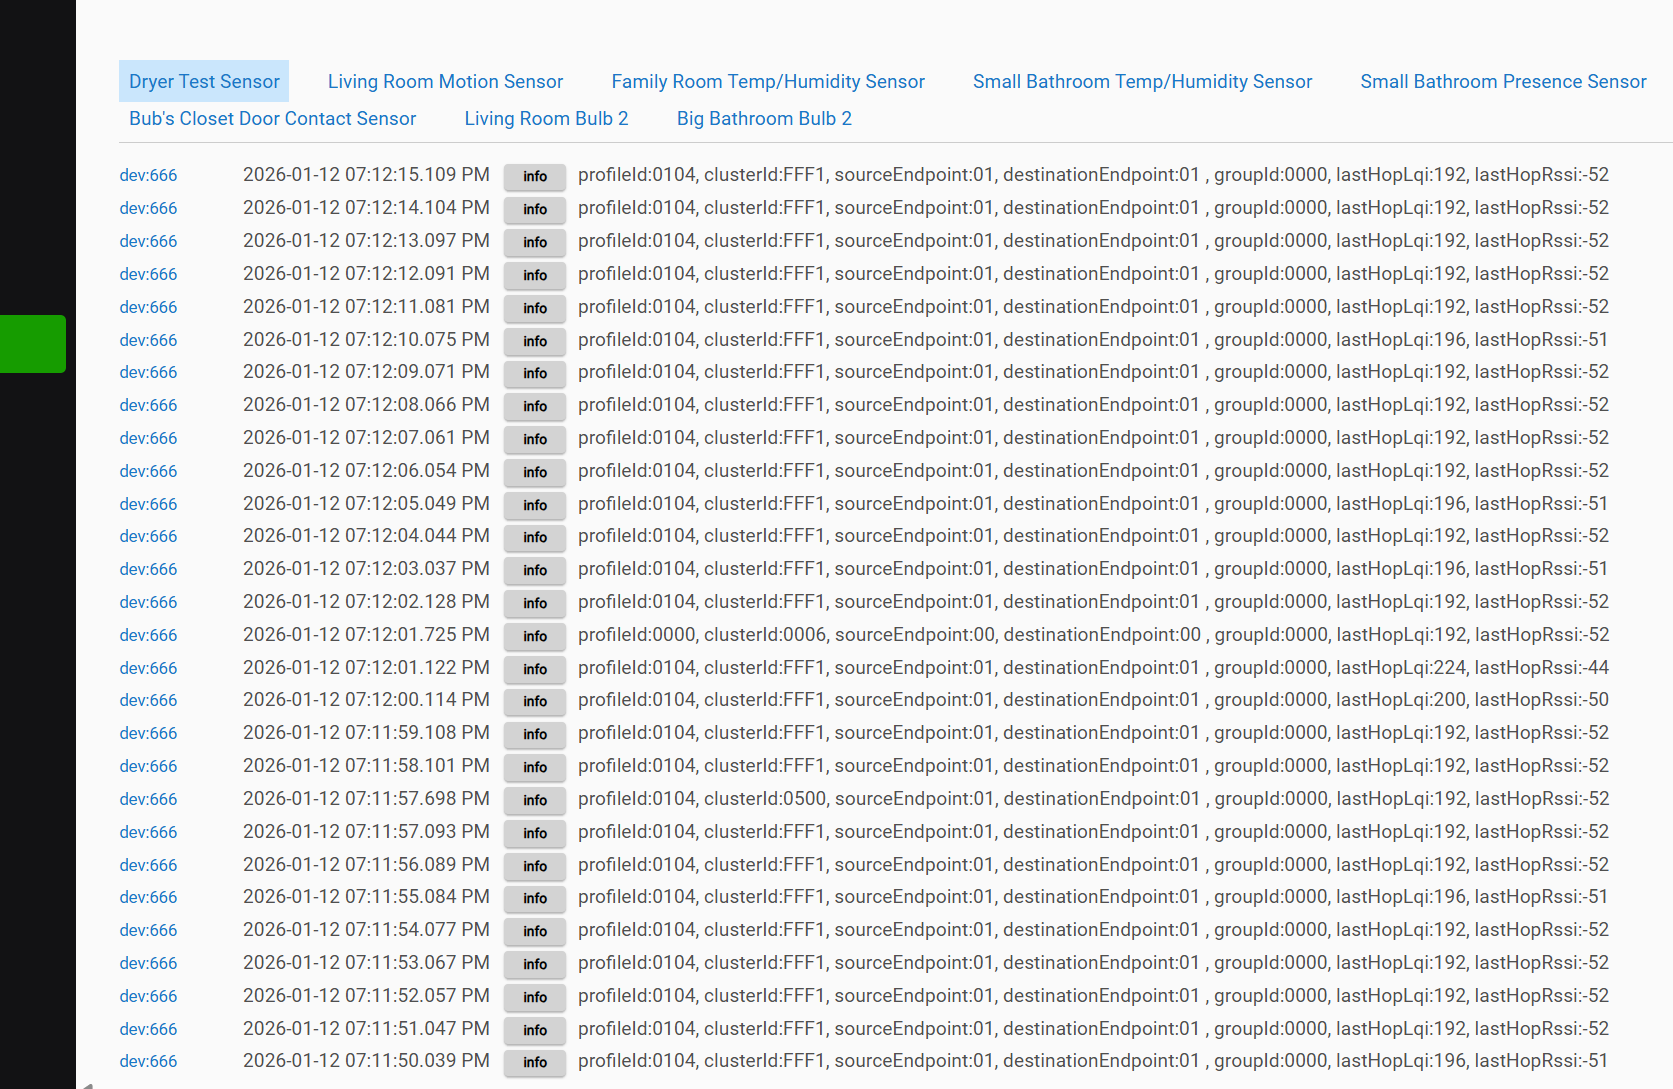
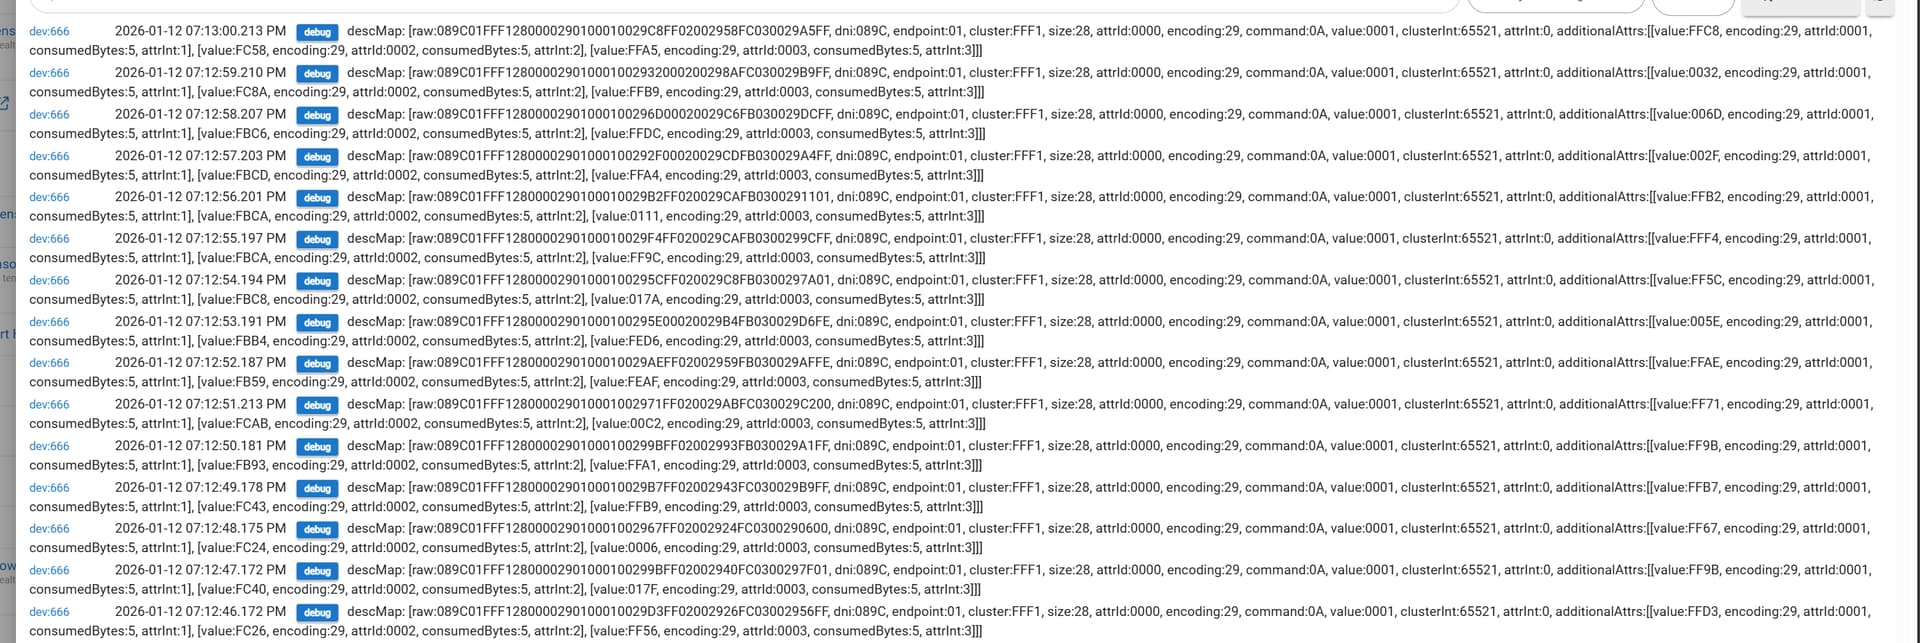
I captured logs all day here yesterday and for a 40-minute dryer run there were over 2,000 messages. The messages are for a manufacturer-specific cluster and appear to be three-axis acceleration values, reported every second.
{"name":"Dryer","id":30944,"profileId":"0104","clusterId":"FFF1","sourceEndpoint":"01","destinationEndpoint":"01","groupId":"0000","sequence":72,"lastHopLqi":255,"lastHopRssi":-60,"time":"2026-01-11 13:14:24.231","type":"zigbeeRx","deviceId":534,"payload":["18","09","0A","00","00","29","01","00","01","00","29","6D","00","02","00","29","DA","FB","03","00","29","99","FE"]}
That's a lot of traffic for a single device. I don't know of a way to configure the device to stop reporting these. Maybe @kkossev has insight.
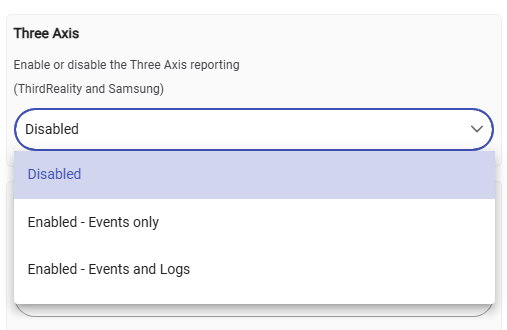
You could try decreasing the sensitivity by changing the DIP switch settings on the device to see if it makes any difference.