Can someone recommend an app capable of graphing thermometer data and displaying the graph in Dashboard? I have probes in the pool heater and return lines and I would like to monitor the pool heater efficiency at a glance.
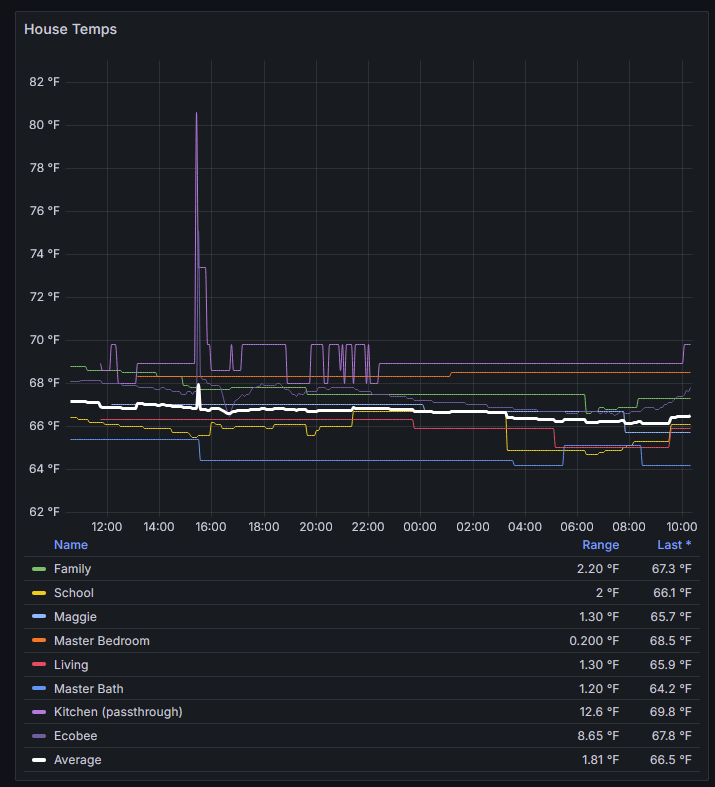
Multiple ways of doing this including Grafana, webCoRE graphs, etc. but here's one way to do some simple plotting:
3 Likes
Not that I'm going to do it, lol, but would my new-ish C8-Pro be more capable in this endeavor, seeing that it has more memory?
More memory is always a good thing, but my testing was on a C-7 and it didn't stress at all.
1 Like
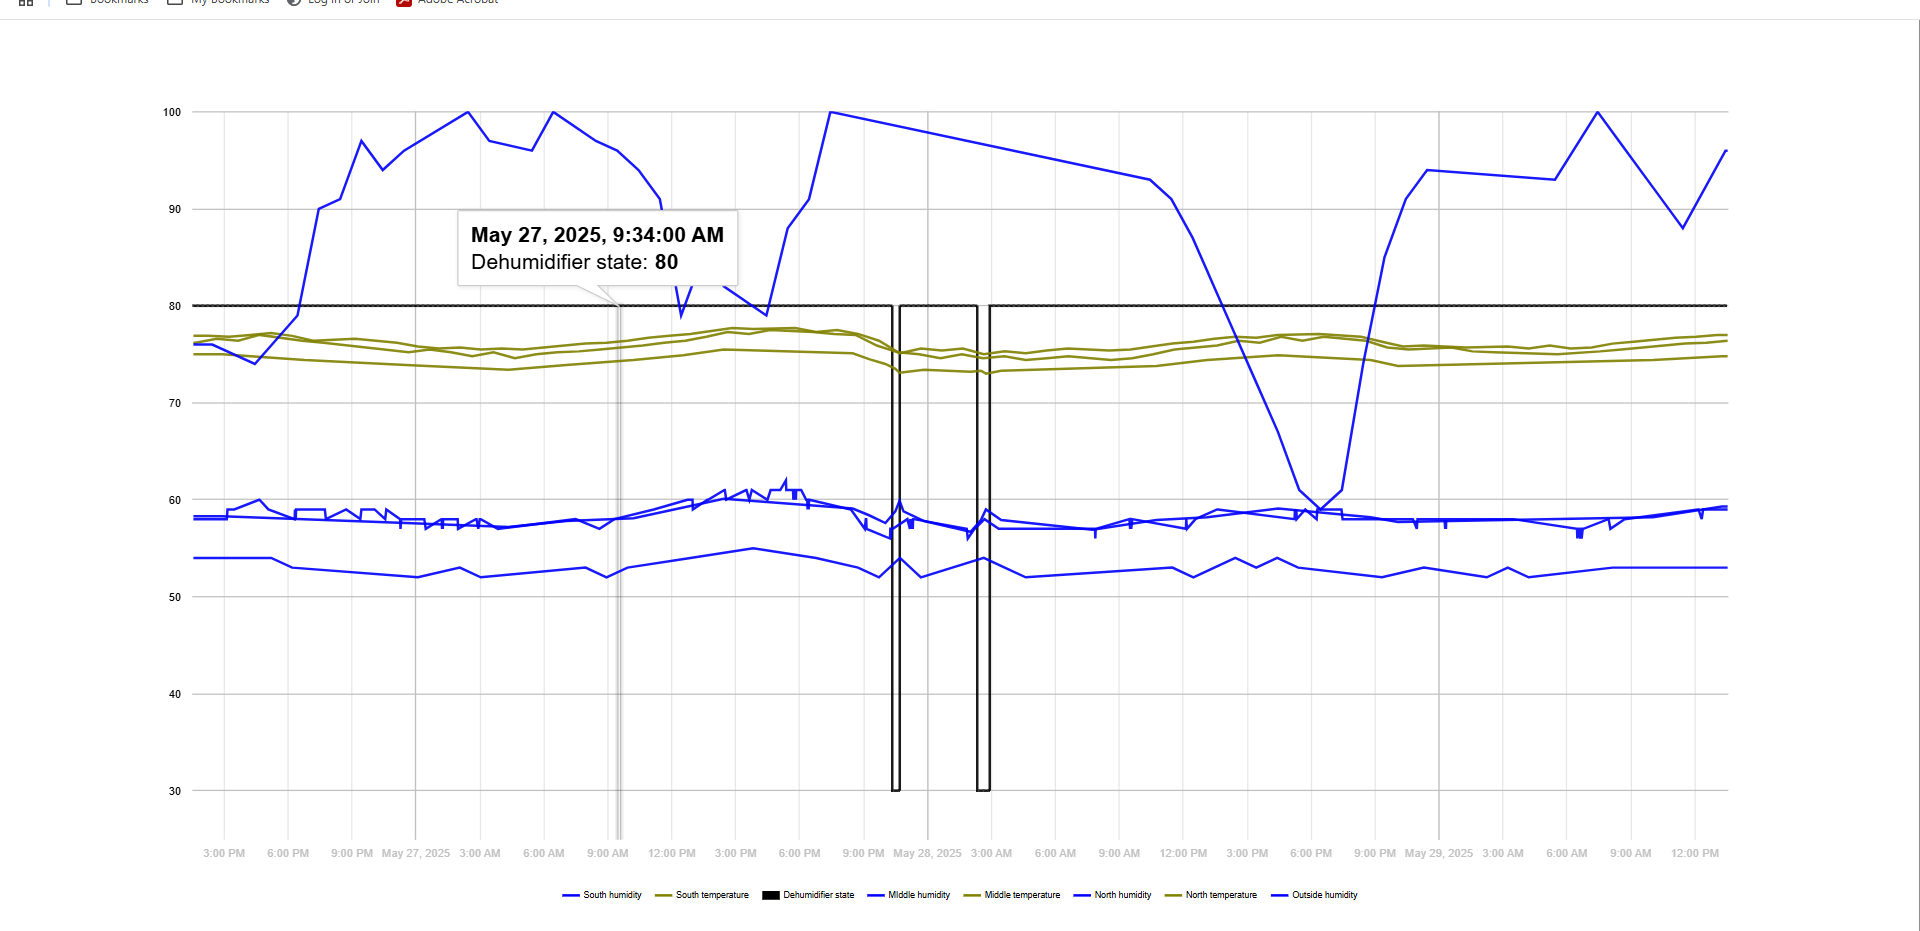
+1 for external solution using Grafana. I export events to a timescaledb (time-series postgres) and have a dashboard with Grafana. I resisted it for a while, but Grafana is relatively easy to use and looks great.
3 Likes
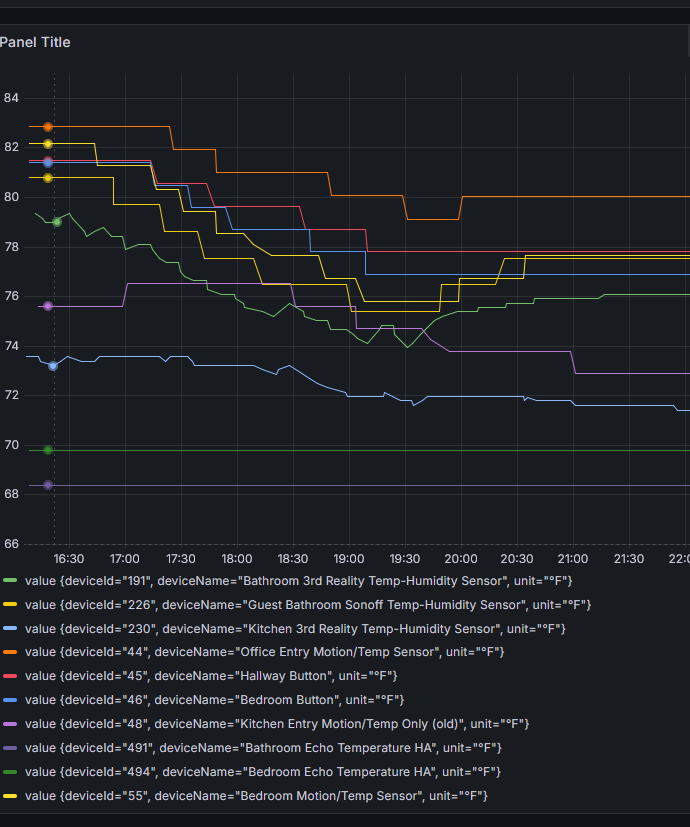
I use and recommend Watchtower: [RELEASE] Watchtower long-term metrics app
I used Grafana, but had a network issue which meant my hub couldn't save the logs and stopped responding and all devices where unresponsive. Have not had issues with Watchtower as it runs local and graphs serve their purpose well,
1 Like
I've used the above mentioned tools - both work great. In the end Grafana give me more - since it's pulling data from an existing Influxdb, I can rebuild and recreate and change without any concern over the original data stored.
So, if just real-time graphing - either. if you might fudge the visual over time - Grafana.
2 Likes