Local graphing has been available in a few different options over time. Hubigraphs was one option, but the developer quit supporting it for a few reasons. Then it got integrated in Webcore, There was also a option from @bptworld for a time.
The big concern with it is load on the hub to create graphs and manage the data.
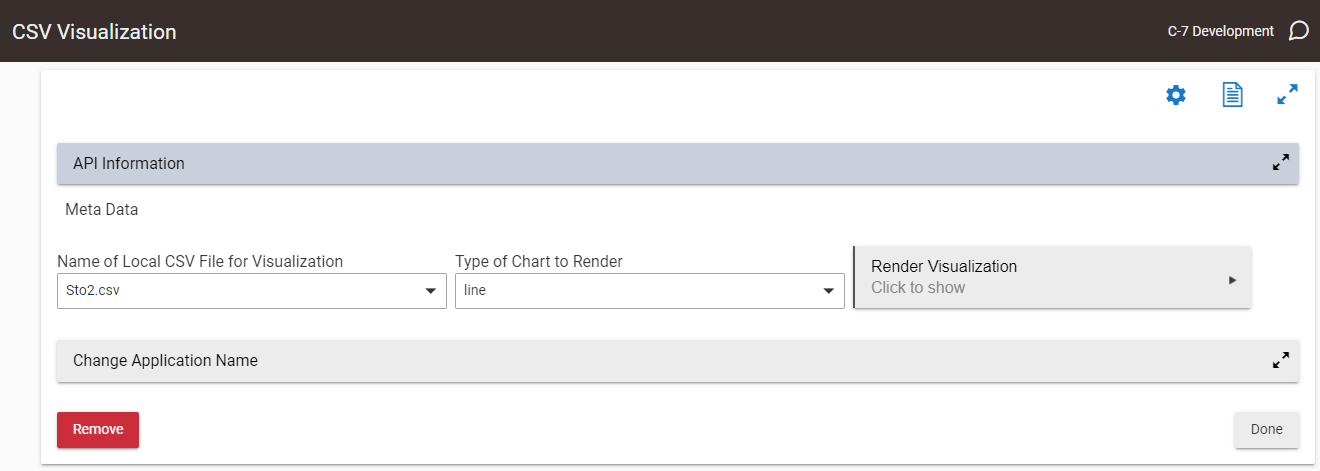
Most of the options to date were dependent on libraries that required Internet access to use, so the ability to download one library to the hub and make this work was attractive. webCoRE and Hubigraphs have local storage options integrated into them so not blazing a trail there but the file management utilities available on the hub now make it simpler to store and fetch the data, and by putting the number of iterations to retain in the user’s hands it allows them to control the impact to the hub.
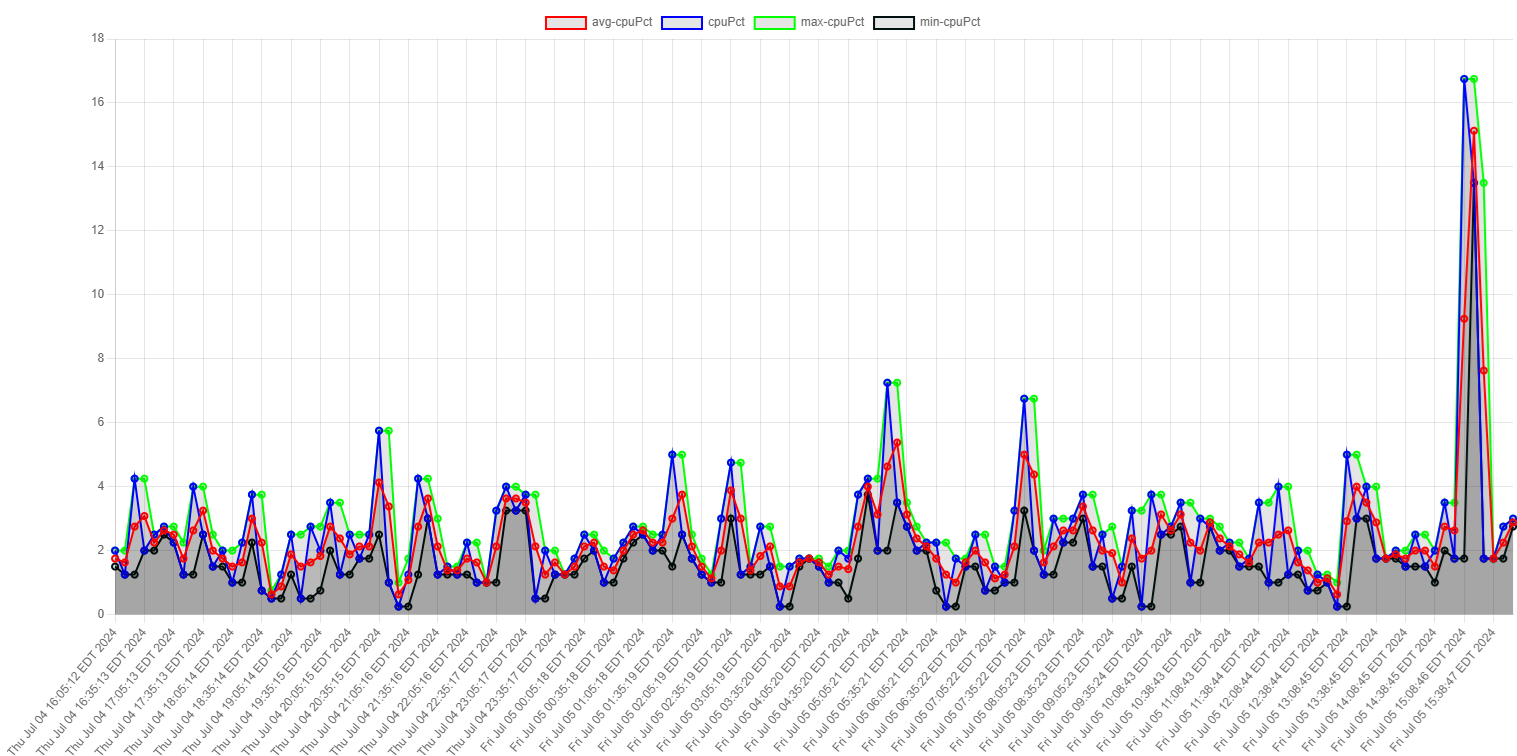
So nothing completely new in concept, just a nice lightweight way of providing it. (In testing so far, it is less than half of my MakerAPI load for my Grafana implementation.) Browser does the heavy lifting for rendering, so minimal impact there too.
Edit: One other thing that may set this solution apart is that the visualization works through the cloud interface as well as locally.
The app is expecting the timestamp in the long format. Converting that back shouldn’t be too difficult, just something I hadn’t considered when writing this.
Edit: Actually thinking about it, that line is only formatting the time stamp into a readable format, so if it isn’t in the long format I could pass it through as is.
I wonder if it would be possible to have more than one data file shown in the same chart (I guess that the attribute would need to be the same in each device/file). This would be useful where the device attributes are somehow related to (dependent on) each other or where we need to see the time relationship between event type attributes.
My particular use-case..... I have various problems with setting up vacation lights - so much so that I have started writing a simple app of my own. Most vacation light apps (including my own) are a pain to test (you have to test them over several evenings and live with the disruption they may cause to normal life). IMHO all vacation light apps should include a speeded up option and a graphical display of the results so that we can verify that everything is working in a satisfactory manner.
I have looked briefly at chart.js, could one do something like....
const mapDataPoint = function(xValue, yValue) {
return {
x: xValue,
y: yMap.indexOf(yValue)
};
};
myChart = new Chart(context,
{type: 'line',
data: datasets:
for each file
for each entry in file
data: [mapDataPoint(entry start, file index),
mapDataPoint(entry start + entry duration, file index),
]
Sorry for the above pseudo code - I was just trying to give some sort of idea of how it could be done. And reading back what I have written I'm not sure that I have expressed my self clearly (maybe that glass of wine didn't help - lol)
The issue I see is that the chances that both sets of data have exactly the same timestamps are so small as to be non-existant. Not an insurmountable problem but one that creates the need to extrapolate values when the timestamps are combined.
Why do the timestamps have to be the same? Surely the timestamps just serve to determine the location on the x-axis of the start and end of events (in my particular use-case) .
As far as I can tell chart.js only uses/allows one X-Axis so if they don’t agree you either make one set of data use the wrong X value, or you combine and extrapolate so that you don’t end up with values plunging to zero when the alternate data columns are read in.