I must have been more tired than I thought last night. The reason it can't import is that I block HE from the Internet at my f/w...d'oh! I'll "open the door" after I get properly caffeinated and do all the updates. I'm sure that will take care of it. I'm sorry to have caused the confusion.
Yep, all good now. Thanks, @christi999, I really like how you've improved the app!
Thanks for the update, I would still wondering why it wasn't working...
Wondering if anyone of you have seen a problem where the battery level of a device is sent to the sendEvent function but this dB logger only get this once in the odd times. I can’t seem to pinpoint this problem...
The only time I was loosing events with this logger was when several events were arriving almost at the same time (several sendEvent were called from the same device in sequence). I corrected that problem here:
Chris
Yes, I saw that post. But it is not the same problem I have. When I test, there are only one event happening at once.
Thanks for this hint.
You may also want to check on the behaviour of the sendEvent, I could be wrong, but it may only record something if the value changes.
I believe you can force it in the code if it is a problem.
Edit:. I think this is what I was thinking of and may be worth a look:
Hum... ok, I’ll investigate this. I also found this in regard to the subscription...
options - Optional values to configure the subscribe. Possible values:
filterEvents - Used for device subscriptions. Set to false to receive all events, defaults to true and events that do not have a changed value will not be processed.
Looking forward to get back to testing tonight...
Thanks
That reminds me... I was having similar problems a while back with my graphs because the values were not changing very often, the graph would not get updated and leave gaps....
I played a bit with different settings (e.g. filterEvents) but in the end I just set the soft polling in the logger to 10 minutes in order to always get a minimum update rate on top of the events. I was thinking of making the interval settable per attribute but it never happened...
1 Like
Were you using Grafana? If you were there is a setting for how to handle null values that may help, you can fill in the gaps I think as one of the options. That may be worth a look...
Thanks, yes, I use Grafana and tried those options. If I remember correctly, even if you use "previous" (I prefer linear, which is even worse in this case) the last value received might slide off the graph entirely and then nothing is displayed.
Ok, I get what you mean. I can't think of anything myself, my Grafana experience is relatively limited, might be worth looking on a forum for Grafana to see if anyone has solved your problem...
Ok that was it....
The filterEvents in the subscription needed to be set. Finally I’m going to have proper graf for batteries. Even there must have been other problem inside HE that prevent it from calling the event even if they were sometime different. But at least now i can pool the battery level every night and have grafana reporting properly.
As far as the soft polling, i tried that but if your battery become low very qickly for any reason, and the battery level is somehow not sent to the logger (which was my case), then the graf keep showing the last level it « think ». Then you end up with a dead battery.
As far as grafana, using the last value... yes sometimes you get no graf. This is also a reason i wanted to poll the battery level every night. But i guess, you could execute a little sql statement in influxdb to « mark » the last value every day at midnight i guess. That would give you a constant graf. But for me, no graf is giving me a warning of something might need my attention.
But thanks everyone for the tip. This made me a lot happier now.
By the way, im going to add an option in the logger to force sendEvent to work with any capability. Which github i should update? It seems to have several places you can find it.
Hello, I've noticed that valueBinary for thermostatOperatingState on lines 425-430 is only set to true if the system is heating. Since the the possible states are "heating", "cooling", "idle" and "fan only" wouldn't it make more sense to set it to zero for idle and 1 for the other three states? I went ahead and modified mine to read as follows:
else if ('thermostatOperatingState' == evt.name) { // thermostatOperatingState: Calculate a binary value (idle = 0, <any other value> = 1)
    unit = 'thermostatOperatingState'
    value = '"' + value + '"'
    valueBinary = ('idle' == evt.value) ? '0i' : '1i'
    data += ",unit=${unit} value=${value},valueBinary=${valueBinary}"
}
1 Like
hi @jrbandido, how do you do these charts?
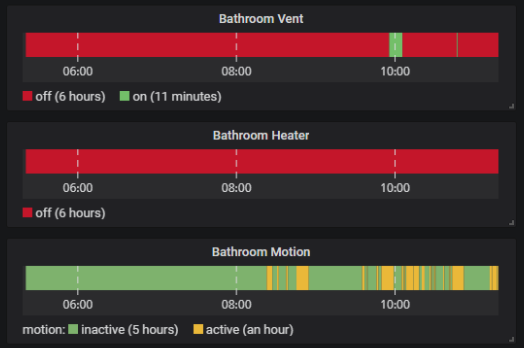
Not at home right now but its a plugging to graph discrete states
@jrbandido When you get a chance I'd also be interested in a screen grab of your settings. I'm also using discrete for my motion sensors and switches but its not indicating the periods, mainly the events themselves. Plus I like your legends with the period too. So if and when you get a chance 
Hey guys, I'm new to hubitat. Recently bought one to replace hass set up, but pretty frustrated about lack of metric support. I wonder if there's an API I can use to get metrics and expose them via prometheus exporter?
Thanks.
Depends exactly what you mean by api, but if you want to get access to device attributes, you can setup the maker api built in app and select the device to expose.
The thing to remember (or know) is that those devices could then be ones generated by apps with almost any information you may want, you may just have to get an app written if there isn't one for the information you are after.
You could cast you eye over the influx db and Grafana setup I have probably linked in an earlier post to get an idea of some of the steps involved.
Hope this helps. And welcome to the community.
Simon

