Could you commit that and open a pull request to GitHub - HubitatCommunity/InfluxDB-Logger ?
Sure, done... The code is also available earlier in this thread.
Config: {
local_config: {
hostname: '192.168.0.224',
base_port: 8567,
influxdb_port: 8086,
influxdb_host: '192.168.0.224',
influxdb_db_name: 'hubitat',
local_url: 'http://192.168.0.224',
poll_interval: 1800
},
hubs: {
home: {
url: 'http://192.168.0.178/apps/api/2702',
token: '<access_token_hidden>',
influxdb_db_name: 'hubitat'
}
}
}
Creating instance for home port: 8567
home local_url http://192.168.0.224:8567/
home Local url encoded http%3A%2F%2F192.168.0.224%3A8567%2F
home post_to http://192.168.0.178/apps/api/2702/postURL/http%3A%2F%2F192.168.0.224%3A8567%2F?access_token=HIDDEN
home Server running at http://192.168.0.224:8567/
home Calling Maker API with: http://192.168.0.178/apps/api/2702/postURL/http%3A%2F%2F192.168.0.224%3A8567%2F?access_token=HIDDEN
home statusCode: 200
home body: {"url":"http://192.168.0.224:8567/"}
stats {
deviceEvents: {},
measurementEvents: {},
deviceMeasurementEvents: {}
}
home evt_uniq_string 0-appEvents
home data: appEvents,deviceId=0,deviceName=totalEvents,hubName=home,hubId=null,locationId=null,locationName=null,repeat=false,unit=count value=0 1600830786106
home evt_uniq_string 0-appEvents
home data: appEvents,deviceId=0,deviceName=influxDBPosts,hubName=home,hubId=null,locationId=null,locationName=null,repeat=false,unit=count value=0 1600830786109
home evt_uniq_string 0-appEvents
home data: appEvents,deviceId=0,deviceName=influxDBErrors,hubName=home,hubId=null,locationId=null,locationName=null,repeat=false,unit=count value=0 1600830786110
problem with request: connect ECONNREFUSED 192.168.0.224:8086
stats {
deviceEvents: {},
measurementEvents: {},
deviceMeasurementEvents: {}
}
home evt_uniq_string 0-appEvents
home data: appEvents,deviceId=0,deviceName=totalEvents,hubName=home,hubId=null,locationId=null,locationName=null,repeat=false,unit=count value=0 1600831686201
home evt_uniq_string 0-appEvents
home data: appEvents,deviceId=0,deviceName=influxDBPosts,hubName=home,hubId=null,locationId=null,locationName=null,repeat=false,unit=count value=0 1600831686202
home evt_uniq_string 0-appEvents
home data: appEvents,deviceId=0,deviceName=influxDBErrors,hubName=home,hubId=null,locationId=null,locationName=null,repeat=false,unit=count value=0 1600831686202
Any idea why I may be getting this error connection refused on 8086? I can connect to the influxdb on this IP/port in Grafana and the test of the db is successful.
It may be an ownership issue with some of the files in your /var/lib/influxdb directory. To resolve this you could try running the following command:
sudo chown -R influxdb:influxdb /var/lib/influxdb
1 Like
Thanks but I think I have it working. I have this running inside container station on my QNAP NAS as a node container. I changed the config.js file to use 0.0.0.0 as the host and changed the container network to NAT and added 8567 port instead of setting it to static IP. So far it's working properly now. Thanks.
1 Like
Thanks man! Really helpful and clear.
It took me a lot of time and reading to accomplish setting up the InfluxDB / Grafanaa for hubitat; but finally did it and I was able to do some nice dahsboards.
Influx and Grafana reside in a Synology NAS, using Docker.
Now, How should I access the Grafana dashboards from outside my house? I tried setting up VPN (oenVPN) on my Orbi router, but something is not working. and before I do more research, I wanted to ask how others do it. I also got Teamviewer to access my Synology NAS, but cannot get to the Grafana GUI; or is there a way? I can also access my NAS through the Synology DSM, but again I can't get to the Grafana GUI.
@nickatredbox You should probably delete this post since it shows your access token unless you want stooges like me messing with your lights.
1 Like
Good point thanks
I'm an idiot
1 Like
Hi everyone! I am a HE newbie but really want this logging.
I attempted to install docker and get Influx installed but I wasn't able to figure it out.
Is there any chance there is a good step by step to get this going?
I am an IT guy by trade so this is super embarrassing and It feels wrong to ask 
1 Like
I have had the same problem, and Hubigraph was the solution that worked for me.
I recommend that you try it out. It is super easy to setup and works great!
2 Likes
@Sebastien - Thanks! I super appreciate this!
I started messing around with it and I sorta got something going!
2 Likes
I totally understand you. It took me a couple of weeks to finally set mine up. I am not an IT guy but was stubborn to get this working.
My specific problem was that I was setting this up on a synology NAS; so for you to get proper help, you have to consider:
- what are you intending to use to house the influxdb database and grafana interface? it should be something that is on and connected a 100% of the time. It cannot be the hub itself. Look for the proper examples in YouTube or just the web to get docker / influxdb and docker / grafana into that system. I struggled with this just because there was very little info for Synology, but through trial / error got it right.
- I personally used the influxDB logger app in Hubitat; that was actually very easy. You’ll want to be careful to find the latest version, which i actually grabbed it from this thread.
So these were not detailed instructions as i didn’t document how I was doing it but at least I hope it gives you some rough guidance.
I have this docker container setup for influxdb:
Docker Hub
I aimed the InfluxDB-Logger app at that host, and I think I'm sending some data, but I get errors in the logs sometimes:
postToInfluxDB(): Something went wrong! Response from InfluxDB: Status: 400, Headers: [X-Influxdb-Error:partial write: unable to parse 'threeAxis,deviceId=225,
...SNIP PRIVATE DATA....,
X-Influxdb-Version:1.8.2, Content-Length:307, Request-Id:xxxxxxxxxxxxxxxx, Date:Mon, 25 Jan 2021 22:00:57 GMT, Content-Type:application/json], Data: null
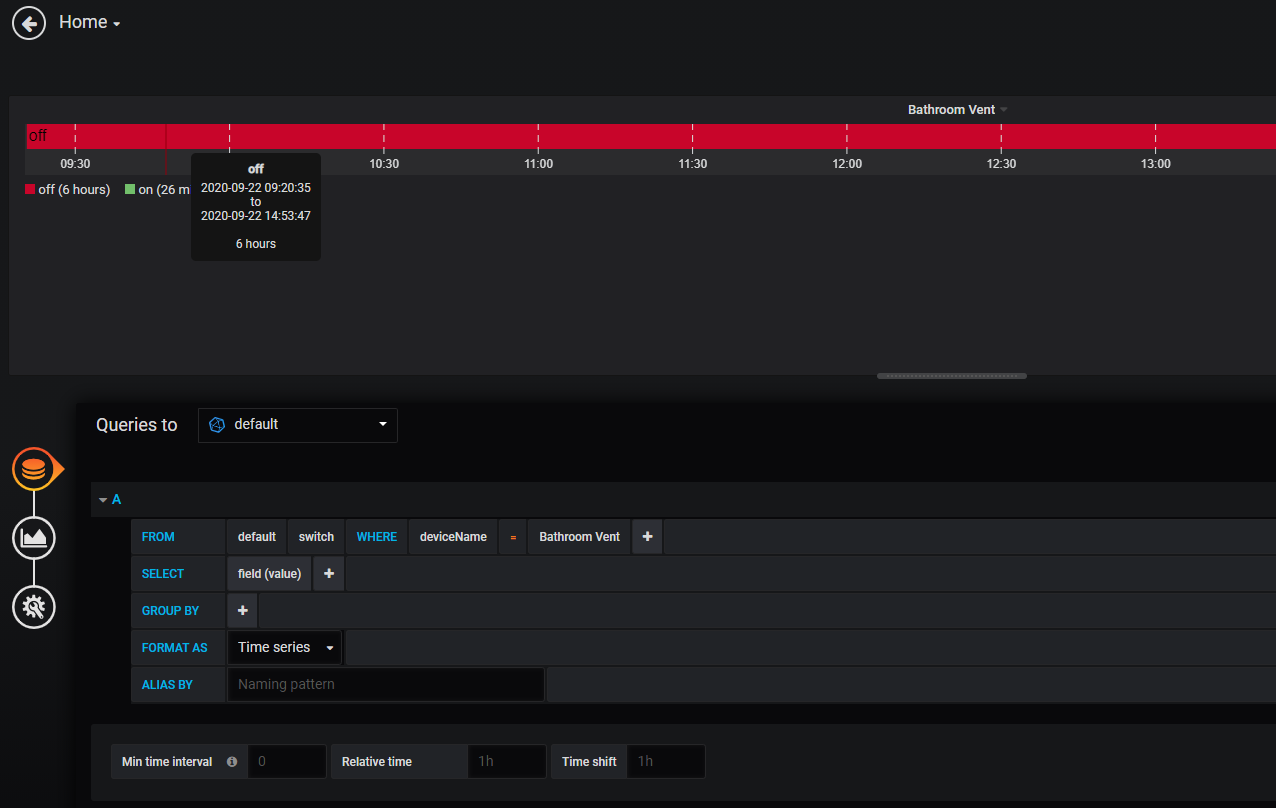
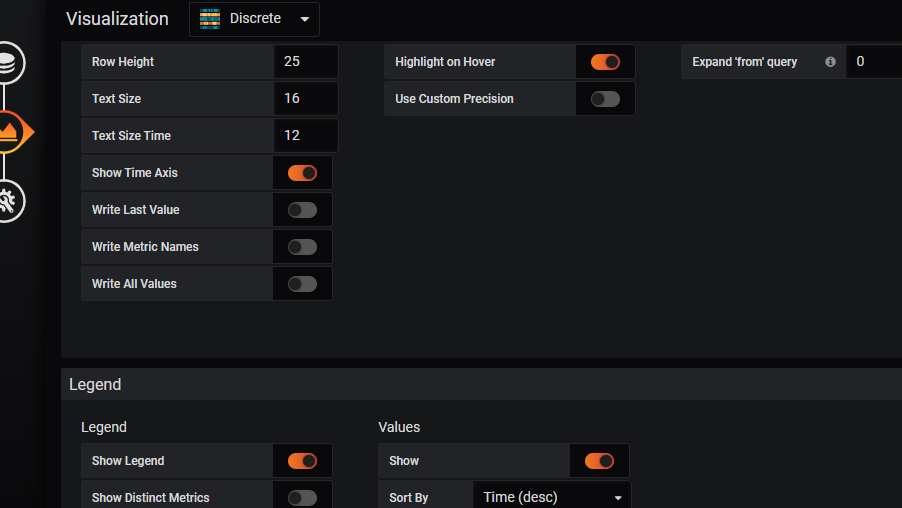
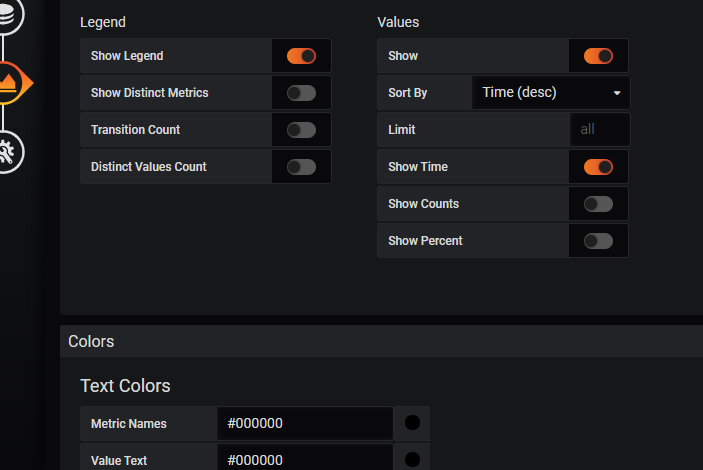
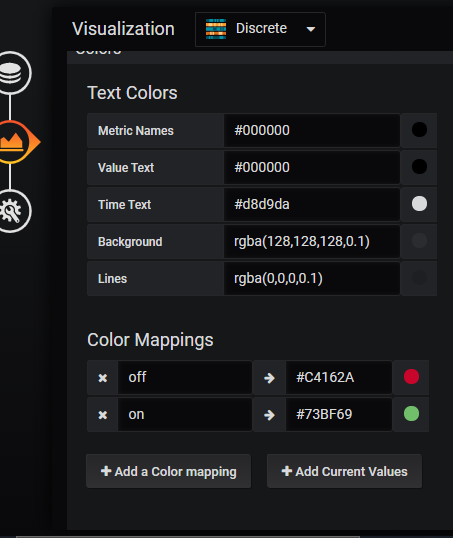
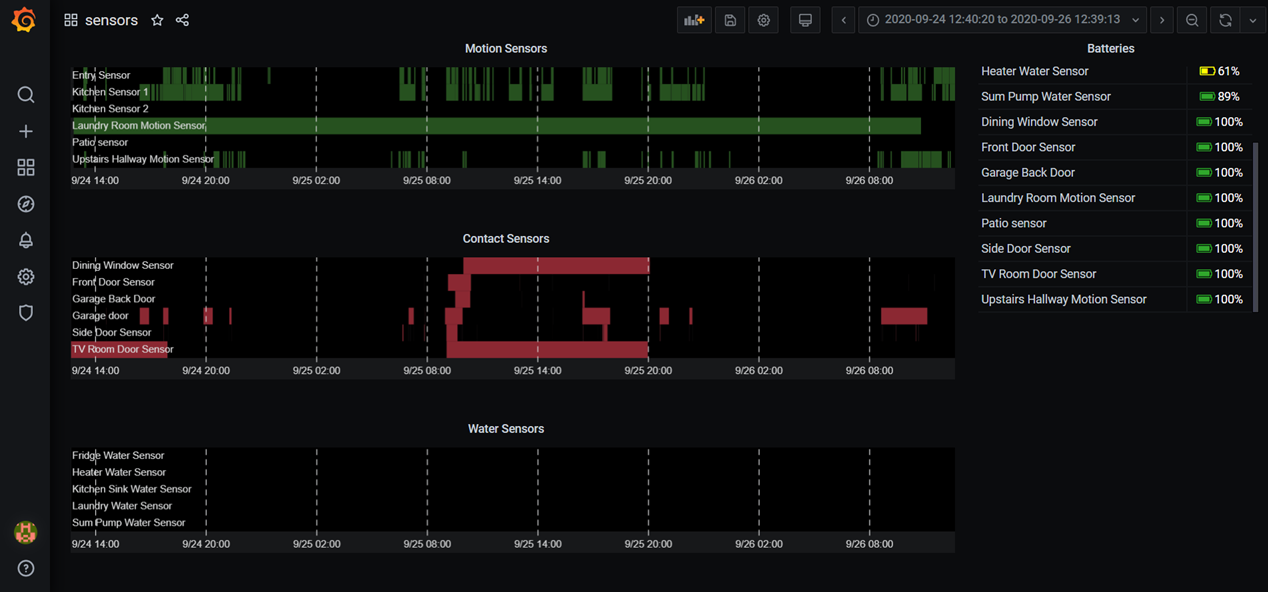
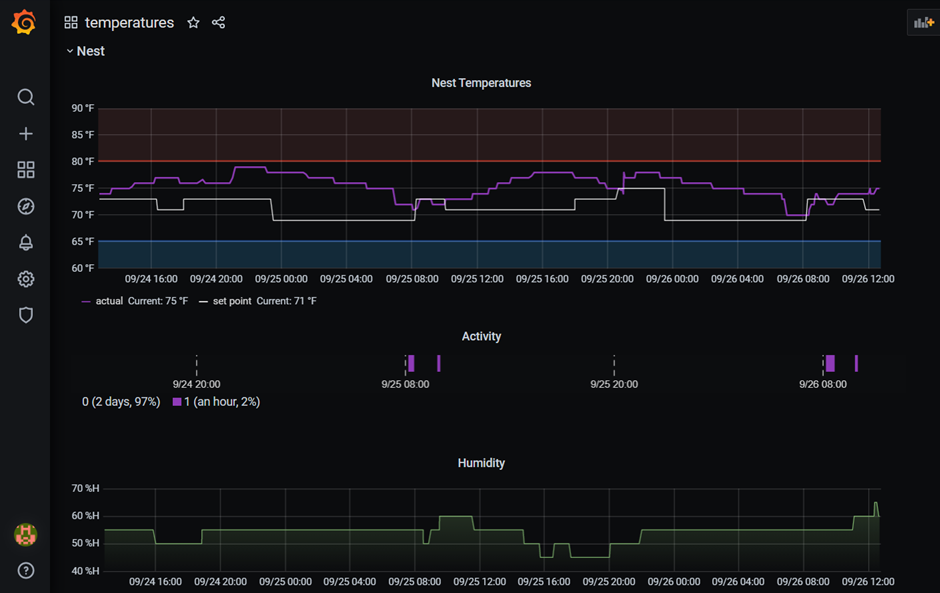
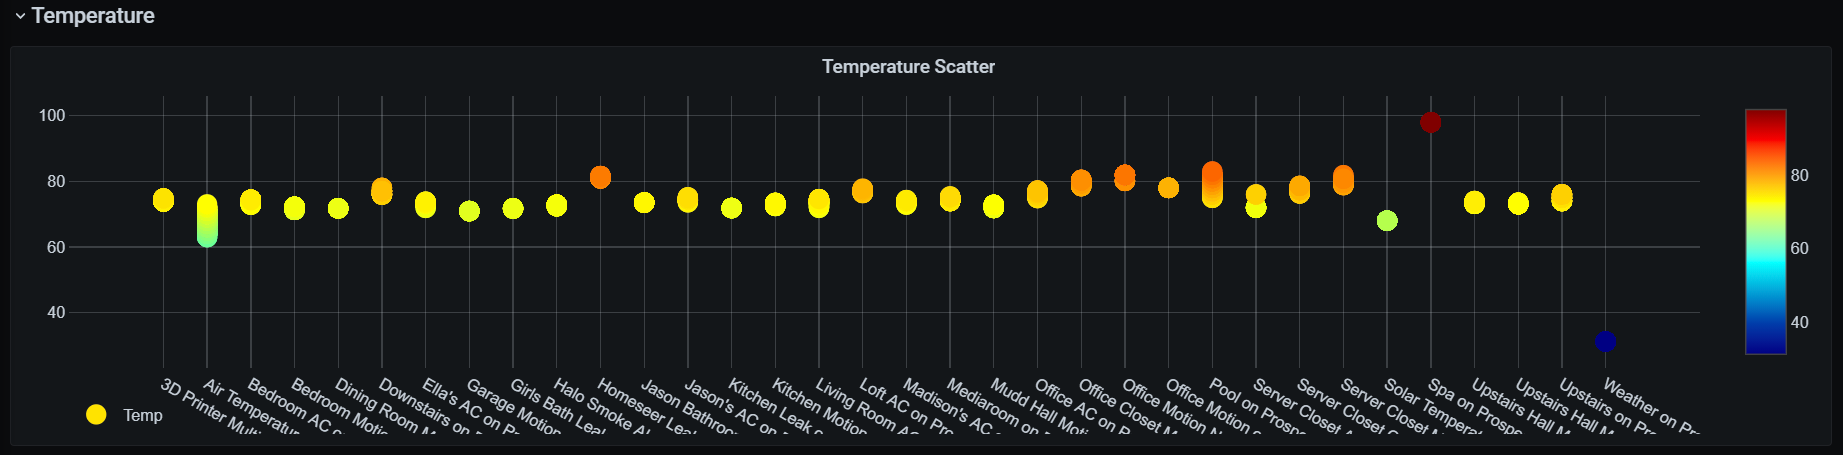
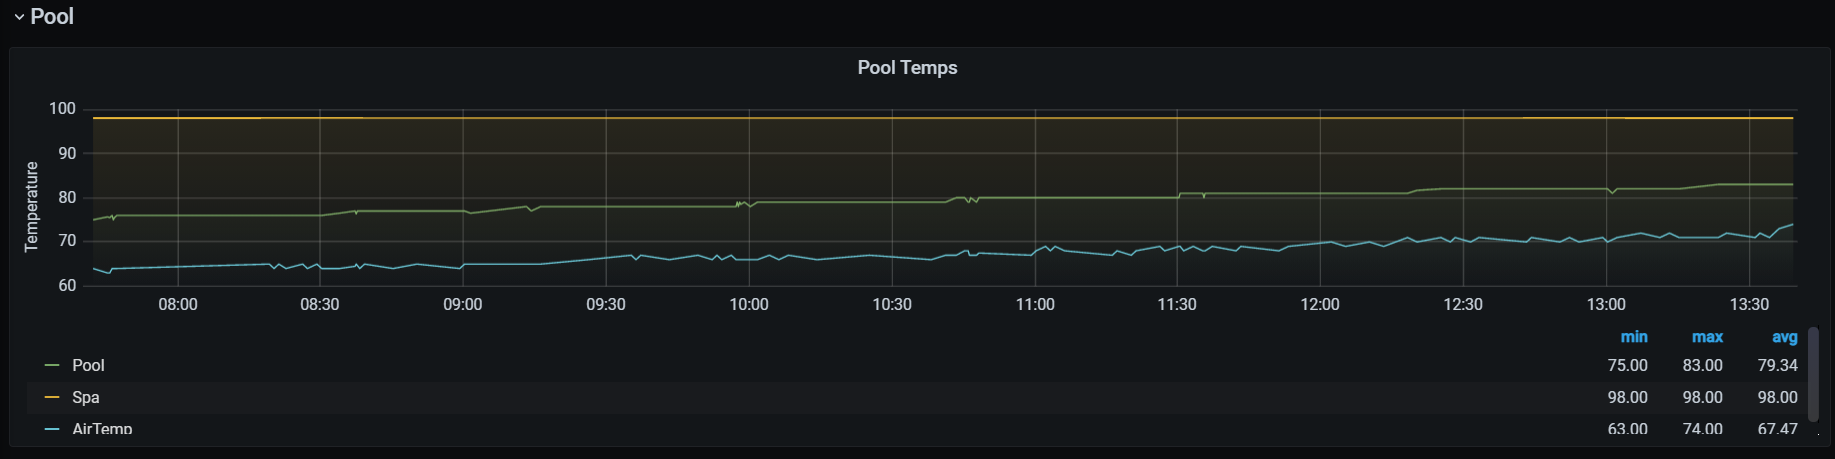
How do setup Grafana to show reasonable graphs? (and even see if the data is making it)
I can't help you too much with Docker, and to be honest my visualisation skills are limited, but hey, I'll have a go.... What were you wanting to show on your charts?
Guys just wanted to say thank you to everyone that posted in this thread, my transition from wink to hubitat has been stellar, I mean I am simply uber impressed with what I can do with hubitat. It's a night and day difference. Thanks to you guys in this thread i was able to setup grafana influx db and set it all up with hubitat and even send alerts to my private zulip chat server. I mean this is just incredible guys, I was able to setup advanced charts inside of a day and a half. The battery chart was the most challenging because of the transform statements but in the end i got that working just right too.
Guys you did a great job here, thanks a million! I'm doing things now that would have never been possible with wink.
2 Likes
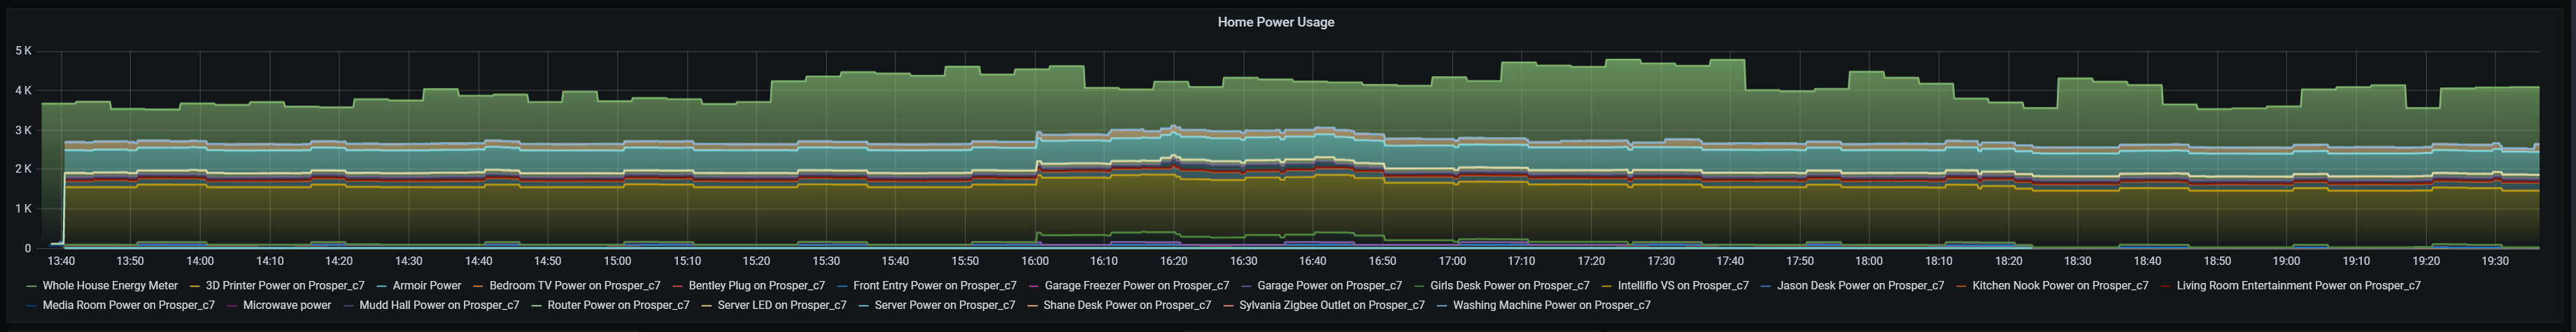
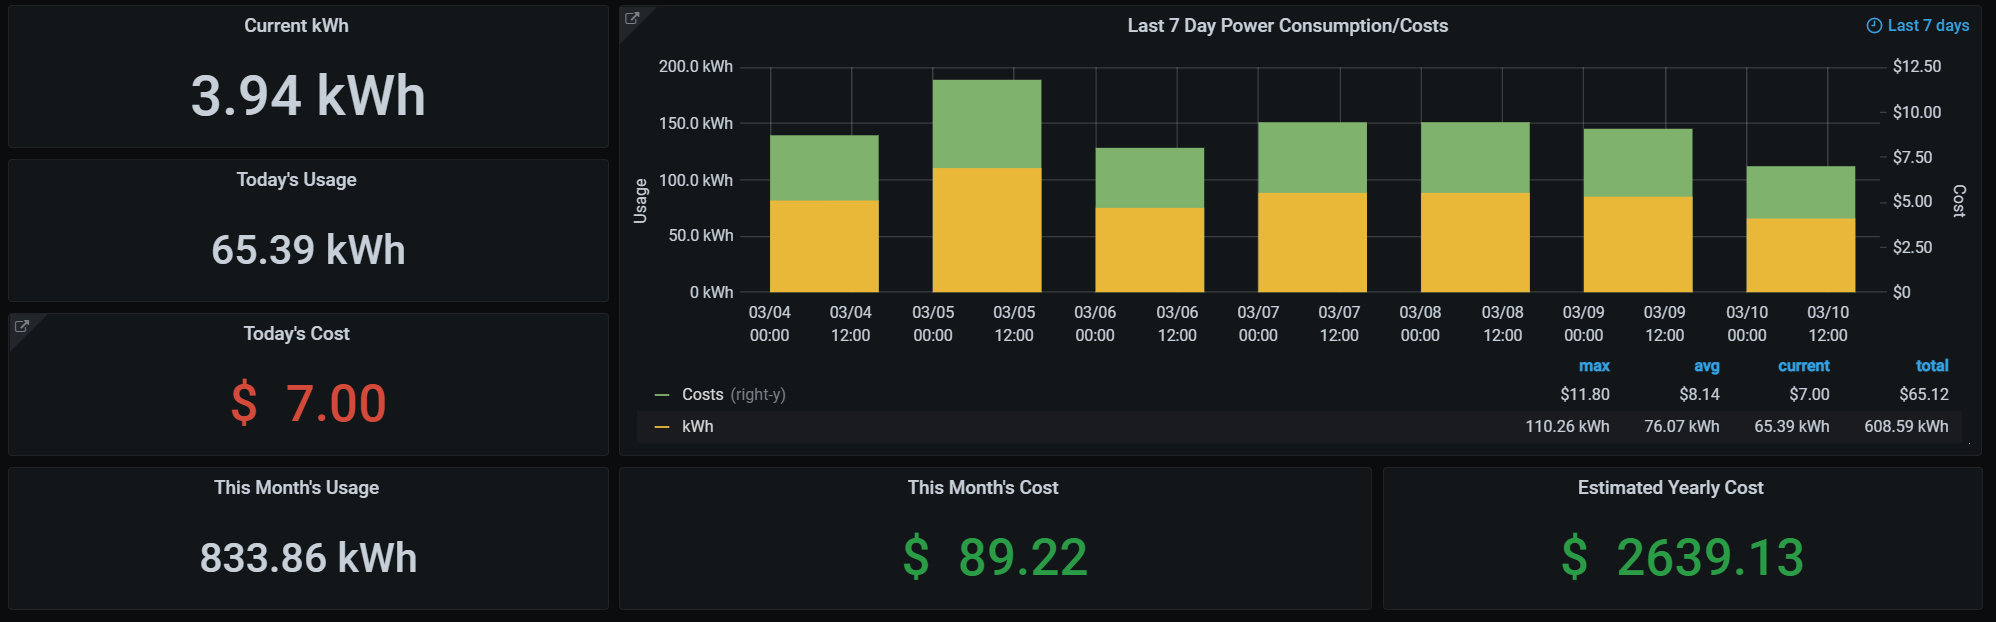
Do you mind sharing your visualization for your power monitoring where you calculating cost etc?

