Logging, or pushing to Influx? I push a half-dozen or so devices to Influx at the moment. But it is meant to handle orders of magnitude more.
Logging varies with the device I'm hacking on. It shouldn't matter; Hubitat should roll its logs before it ever affects anything. I've heard long logs can choke the device, but I haven't seen it verified, and that would worry and surprise me if it were true.
I have the Influx logging sent to 'trace'. It really could be a a good deal lower, I suppose.
I have it soft-polling every 5 minutes, may increase that rate to make my graphs prettier.
This is amazing, thanks everyone. I'm currently running it on Ubuntu on a virtual machine in Windows 10, which I think should be sufficient for now. Still gathering data, but I'm looking forward to finally doing some real monitoring.
Looking good. I actually am now running InfluxDB and Grafana directly on my “Windows 10 Home Server”. Much snappier than the Raspberry Pi, and no worry of wearing out the microSD card.
Is your home server the same as your main work desktop? I've been considering setting up a dedicated media server for purposes like this, but currently it's just my desktop.
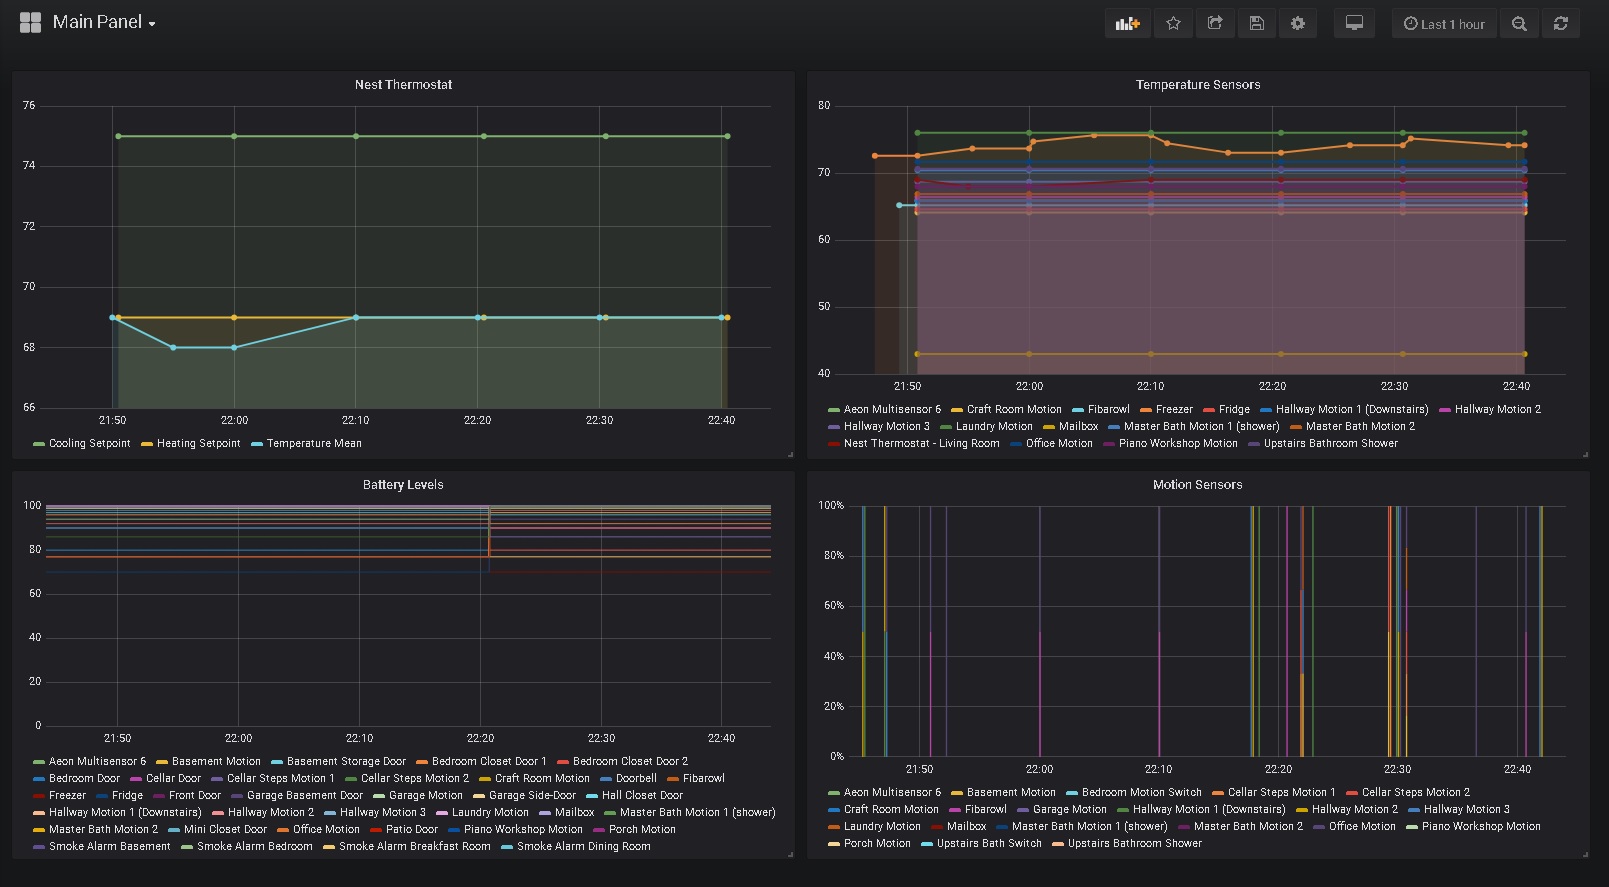
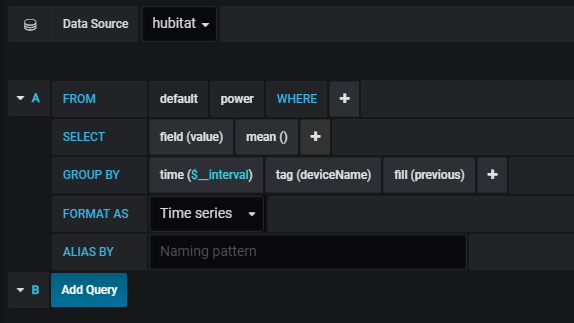
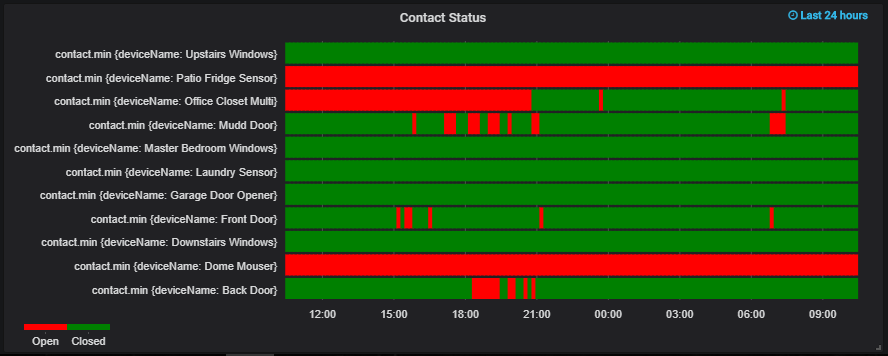
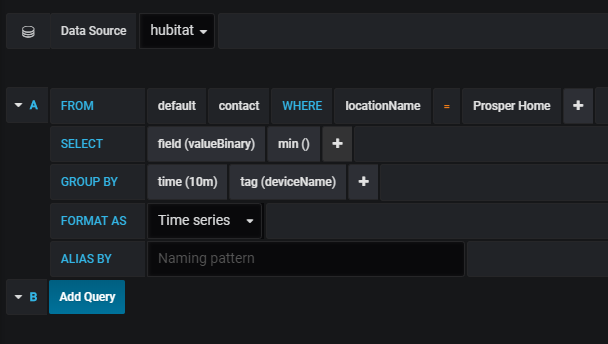
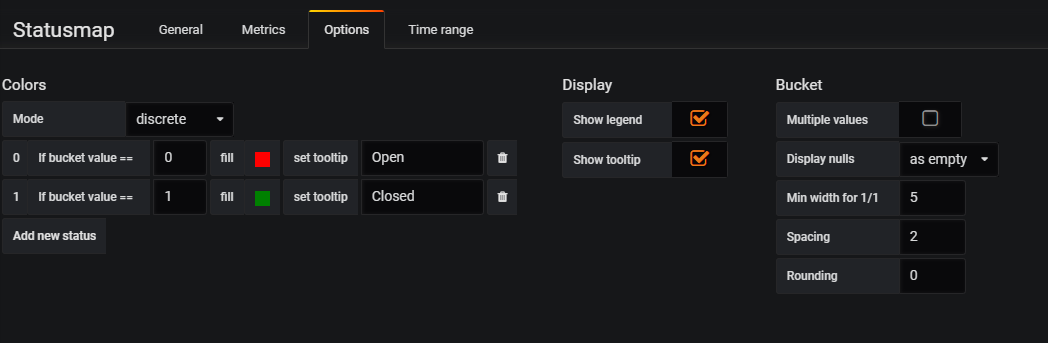
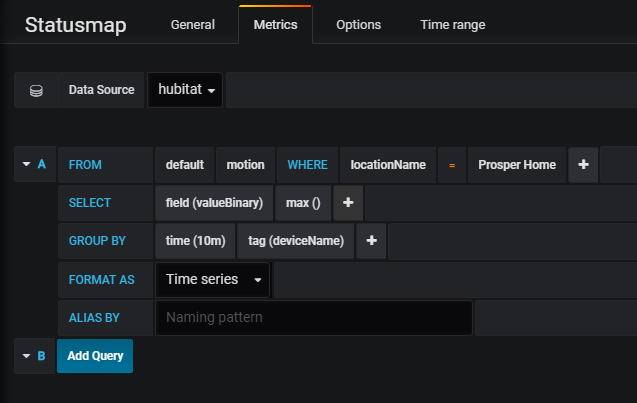
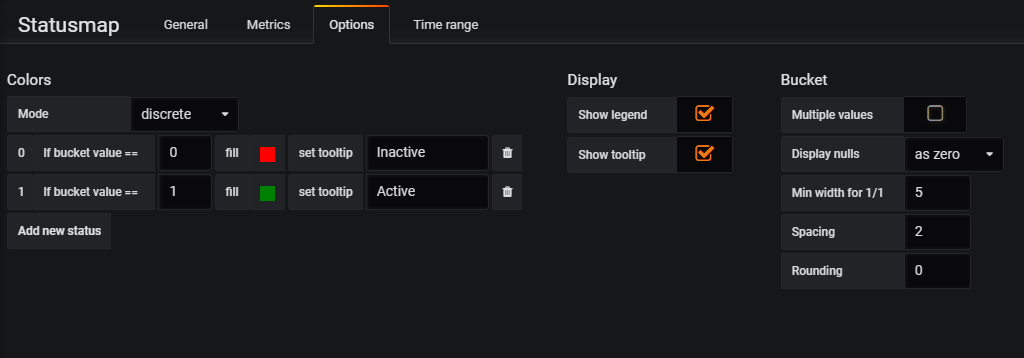
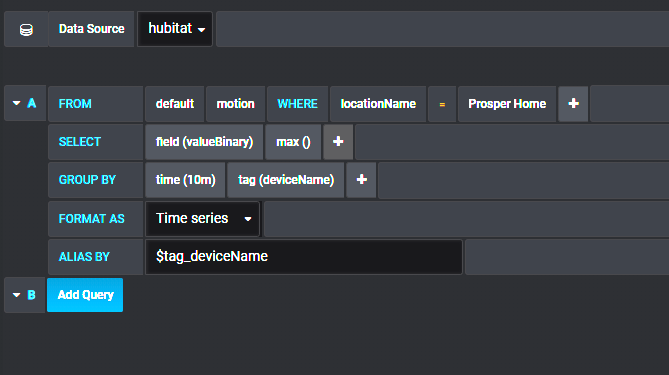
Chart type is Statusmap. Not sure if it was a pluging type or one of the original few. Do know all the ones I use are from the official grafana web page though. The key to it looking good was the group by 10m instead of $interval. And if you group by 10m then it needs some kind of aggregation. I am more concerned about if it was open at any point during that 10m so I select min() which will flag if the contact sensor was every open during that period. If you had another sensor you may take the max. The color of the discrete values is easy enough. Tag (deviceName) pulls all the devices with a contact value instead of listing them all. Still trying to figure out how to strip the contact.min {deviceName: part.
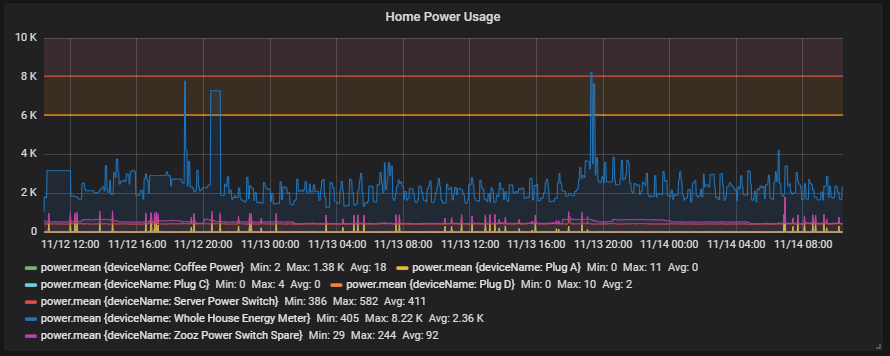
Metrics are above.
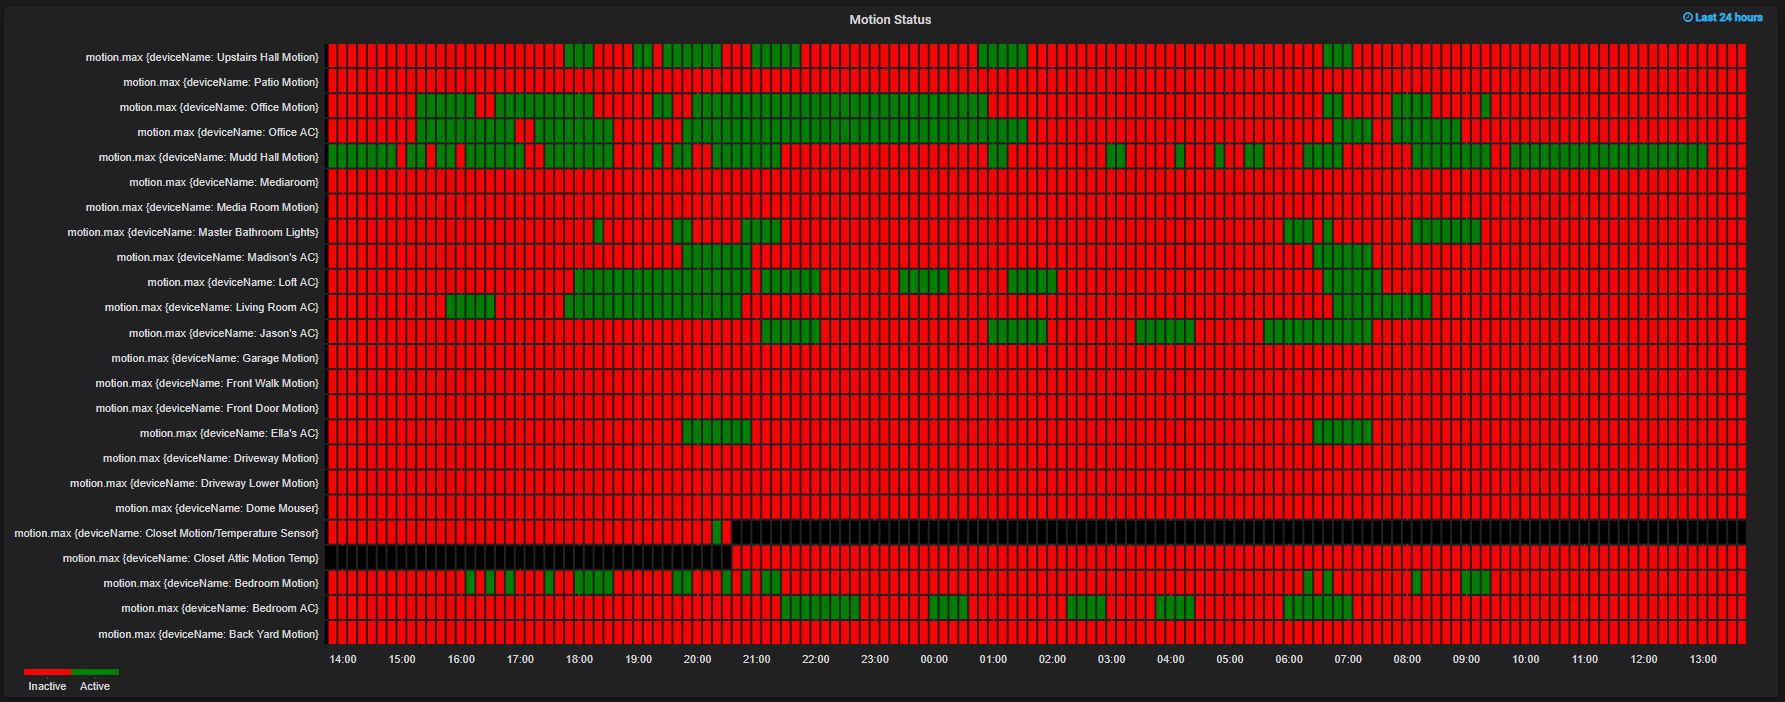
Did a similar chart for motion. In this case the motion I care about is active which is a binary 1 so I take the max() during the 10m instead of the min.
I have an operations background, and the fastest, most efficient way to write log data is directly to a txt file or a syslog feed. Writing log data to any db in real-time is problematic.
Writing log data to a flat-file or syslog is easy, has open standards, and is supported across all platforms. Let your tool import the data for analysis when needed. The hub’s only job should be to write the log data out quickly in a standard format. I think this is the best direction for logging.
From the Hubitat Hub’s perspective, writing data is simply making http calls. This is very simple and allows for any RESTful server to collect the data and do whatever it wants to. You could easily write a RESTful server (that runs on another system, not the Hubitat Hub) that writes CSV files if desired.
Syslog requires UDP (typically) which is not yet released as a user callable API on Hubitat, yet. Syslog is fine for logging text, like trace debug data. But I would prefer not to use it for time-series data.
Most users would rather use something like InfluxDB, as it is supported, fast, free, and works on almost every platform. Paired with Grafana, you can make very nice dashboards and displays.
I work in manufacturing, where we use OSI PI as our data historian. I can tell you from 28 years of experience, tools like OSI PI and InfluxDB are much more efficient at storing and retrieving time series data than simple text files.
Options are good! The nice thing about a platform like Hubitat, is you can write your own app to do whatever you’d like. Just please don’t poll continuously for data. Hubitat allows Apps to subscribe for device events. So, only when data changes is it logged. Data Historians, like OSI PI and InfluxDB take care of filling in the gaps of data, where a value has not changed for a while.
I like the logging output concept; it is something I use at work that works well regardless of where you store the data - could you answer a few questions?
This means that you output an HTTP PUT or POST, correct?
Is the output format customizable?
Will you support HTTPS any time soon? If not, is it possible for HTTPS to be added by the end-user?
Yes. You can look at the source code for the InfluxDB Logger App in the Hubitat Community GitHub repository.
Hubitat allows end users to write their own custom apps. That is exactly what the InfluxDB Logger application is. In fact, it was actually written for the SmartThings platform, and was easily ported to Hubitat.
Again, this is OpenSource code. So you are free to change it as you see fit. As for https support, I am not sure. @chuck.schwer would the answer for sure.
Yes, that is the question. I have a logging solution that accepts HTTPS PUT/POST submissions, If Hubitat supports HTTPS at TLS 1.2 then I don't have to do any major work to do.
Thanks for the feedback. I have not dug into the code yet - work has been in the way. I am planning to during the holidays and want to get as much info as possible before I dig in.