Statusmap is awesome. Thanks for the tip.
Can you share your setup for boom table? How did you get the battery icon?
Statusmap is awesome. Thanks for the tip.
Can you share your setup for boom table? How did you get the battery icon?
I work for a company called Sumologic (sumologic.com) and we provide a secure cloud-based logging solution that ingests unstructured data (meaning you do not have to define your fields to start ingesting - makes for quick ramp-up). It has powerful query and visualization capabilities that I am really interested in using on Hubitat log data, and it is free for personal use (meaning low ingest). The service ingests logs via HTTPS over TLS 1.2, but we also have a local collector that can accept HTTP POSTS and PUTS and convert them to HTTPS for ingest.
You can also upload log files, so I am initially interested in finding out where Hubitat log files are stored locally so I can grab them and upload them manually to start playing around.
Longer term I would like to create an app or driver that will push all log entries from all devices out via HTTP to a local collector I have. I am looking for some documentation on Hubitat logging in general and specifically on how I would configure HTTP updates to be sent to my collector for all state changes on all devices.
When done I will post the integration for people to play with.
Thanks,
Eric
I used InitialState for quite a few years to support visualization and historical trended data in Smartthings environment. In fact loosing the ability to visualize over time in moving to Hubitat was almost enough to keep me on Smartthings.
Almost.
I would be very interested in an integration with InitialState, or similar, as local storage requires maintenance, etc.
Can you share your setup for this boom table setup? It's looking great.
Thanks
Figured it out
Info can be found here
Sorry, I was on vacation and didnt have computer access. Meant to post it last night, glad you figured it out.
Thanks to everyone for detailing their setups. I just got grafana and inluxdb setup last night. Unfortunately there aren't any good youtube video on this stuff for novices like myself and a lot of the documentation assumes you know a little about what you are doing. I don't fall into that category but like everything else I do...brute force till it succumbs to my will.
Like I said I don't really know what I'm doing and so I don't really understand the consequences completely so here are my questions:
When I setup the inlfuxdb app and choose the devices to monitor, how much of an impact is it going to have on my hub? I want to set the minimum logging level of "Info"..so I get as much data as possible..but again..what's the impact? I see quite a bit of logging when I added my motion sensors. I assume soft logging just does a status report on all devices so it has a minimum set of data points if the device is not reporting regularly.
Right now I have the db on a raspberry pi that also acts as my PiVpn server. Is it recommended to run this on a dedicated device? Essentially I'm asking if the Pi3b+ can handle the load.
The grafana is installed on my Windows 10 box that hibernates after a timeout. I didn't realize that this component was actually a webserver of sorts. I just want to confirm that all the server is doing is pulling data from the influxdb and presenting it in graphical format and nothing else. Would having it on a machine that goes to sleep have any negative impact on what it does?
I don't want to setup another box just for grafana.
I'm sure I have a lot more question on the way, once I really dive into making graphs but I don't want to overshoot my quota. 
My influx DB is very low loading. I cant for sure say your pi is fine as its running on a full server but i cant even see the processor usage from it. I have not noticed any slowdown in the hubitat hub and I recall a previous response that its very low load.
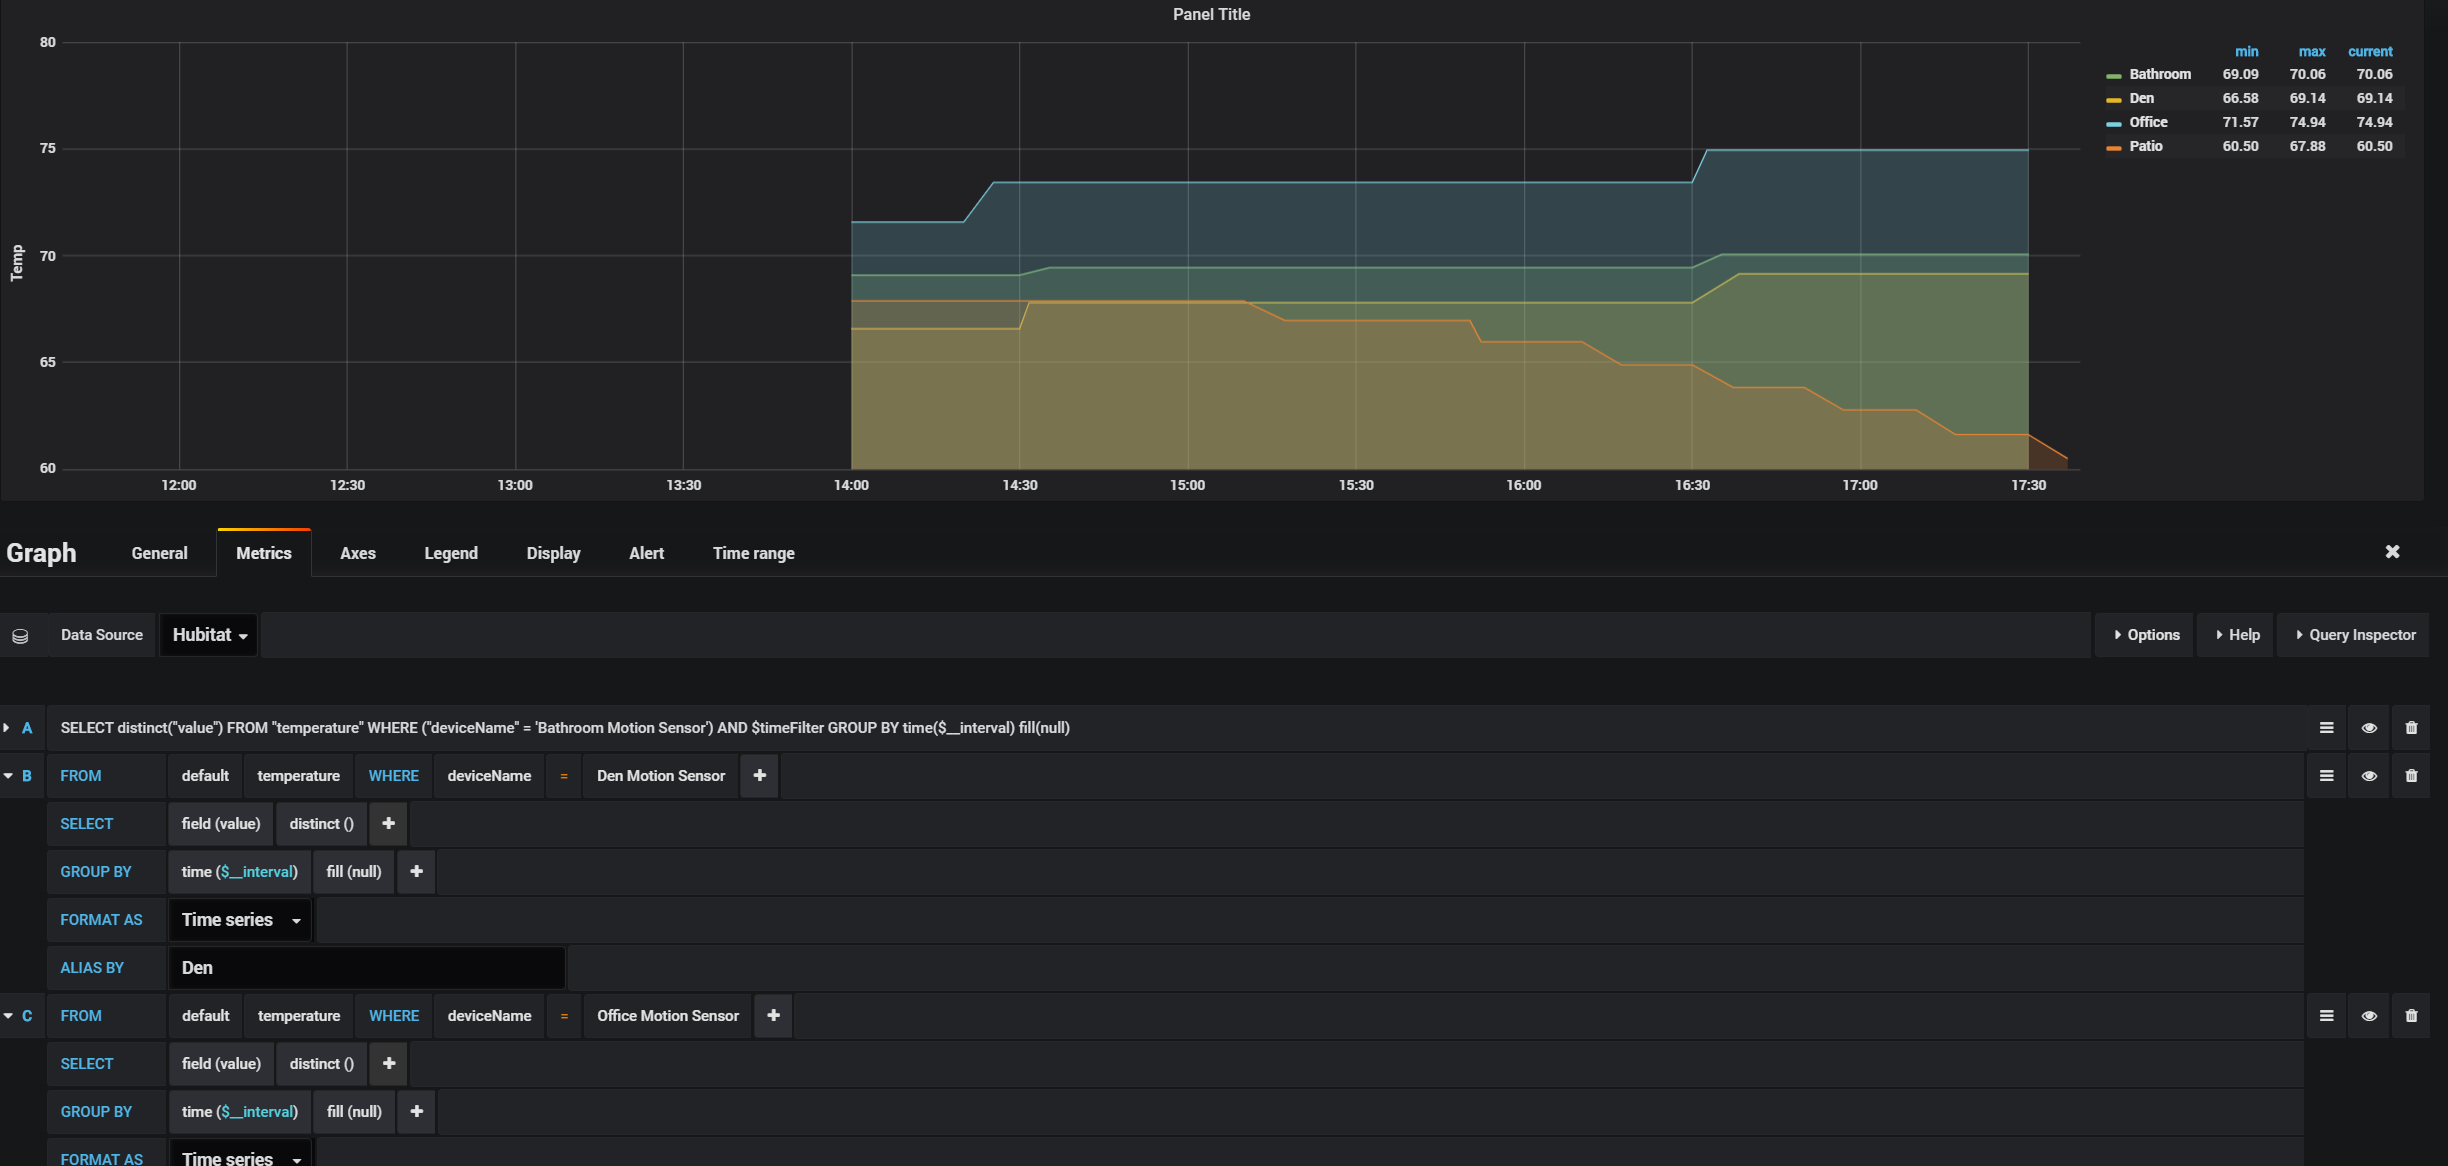
Great. I kinda want to throw everything at it and build my graphs after the fact but I know the HE hub has limited resources. Here's my first graph...took me 30 minutes to figure this out...but I'm proud nonetheless.
Great Success!
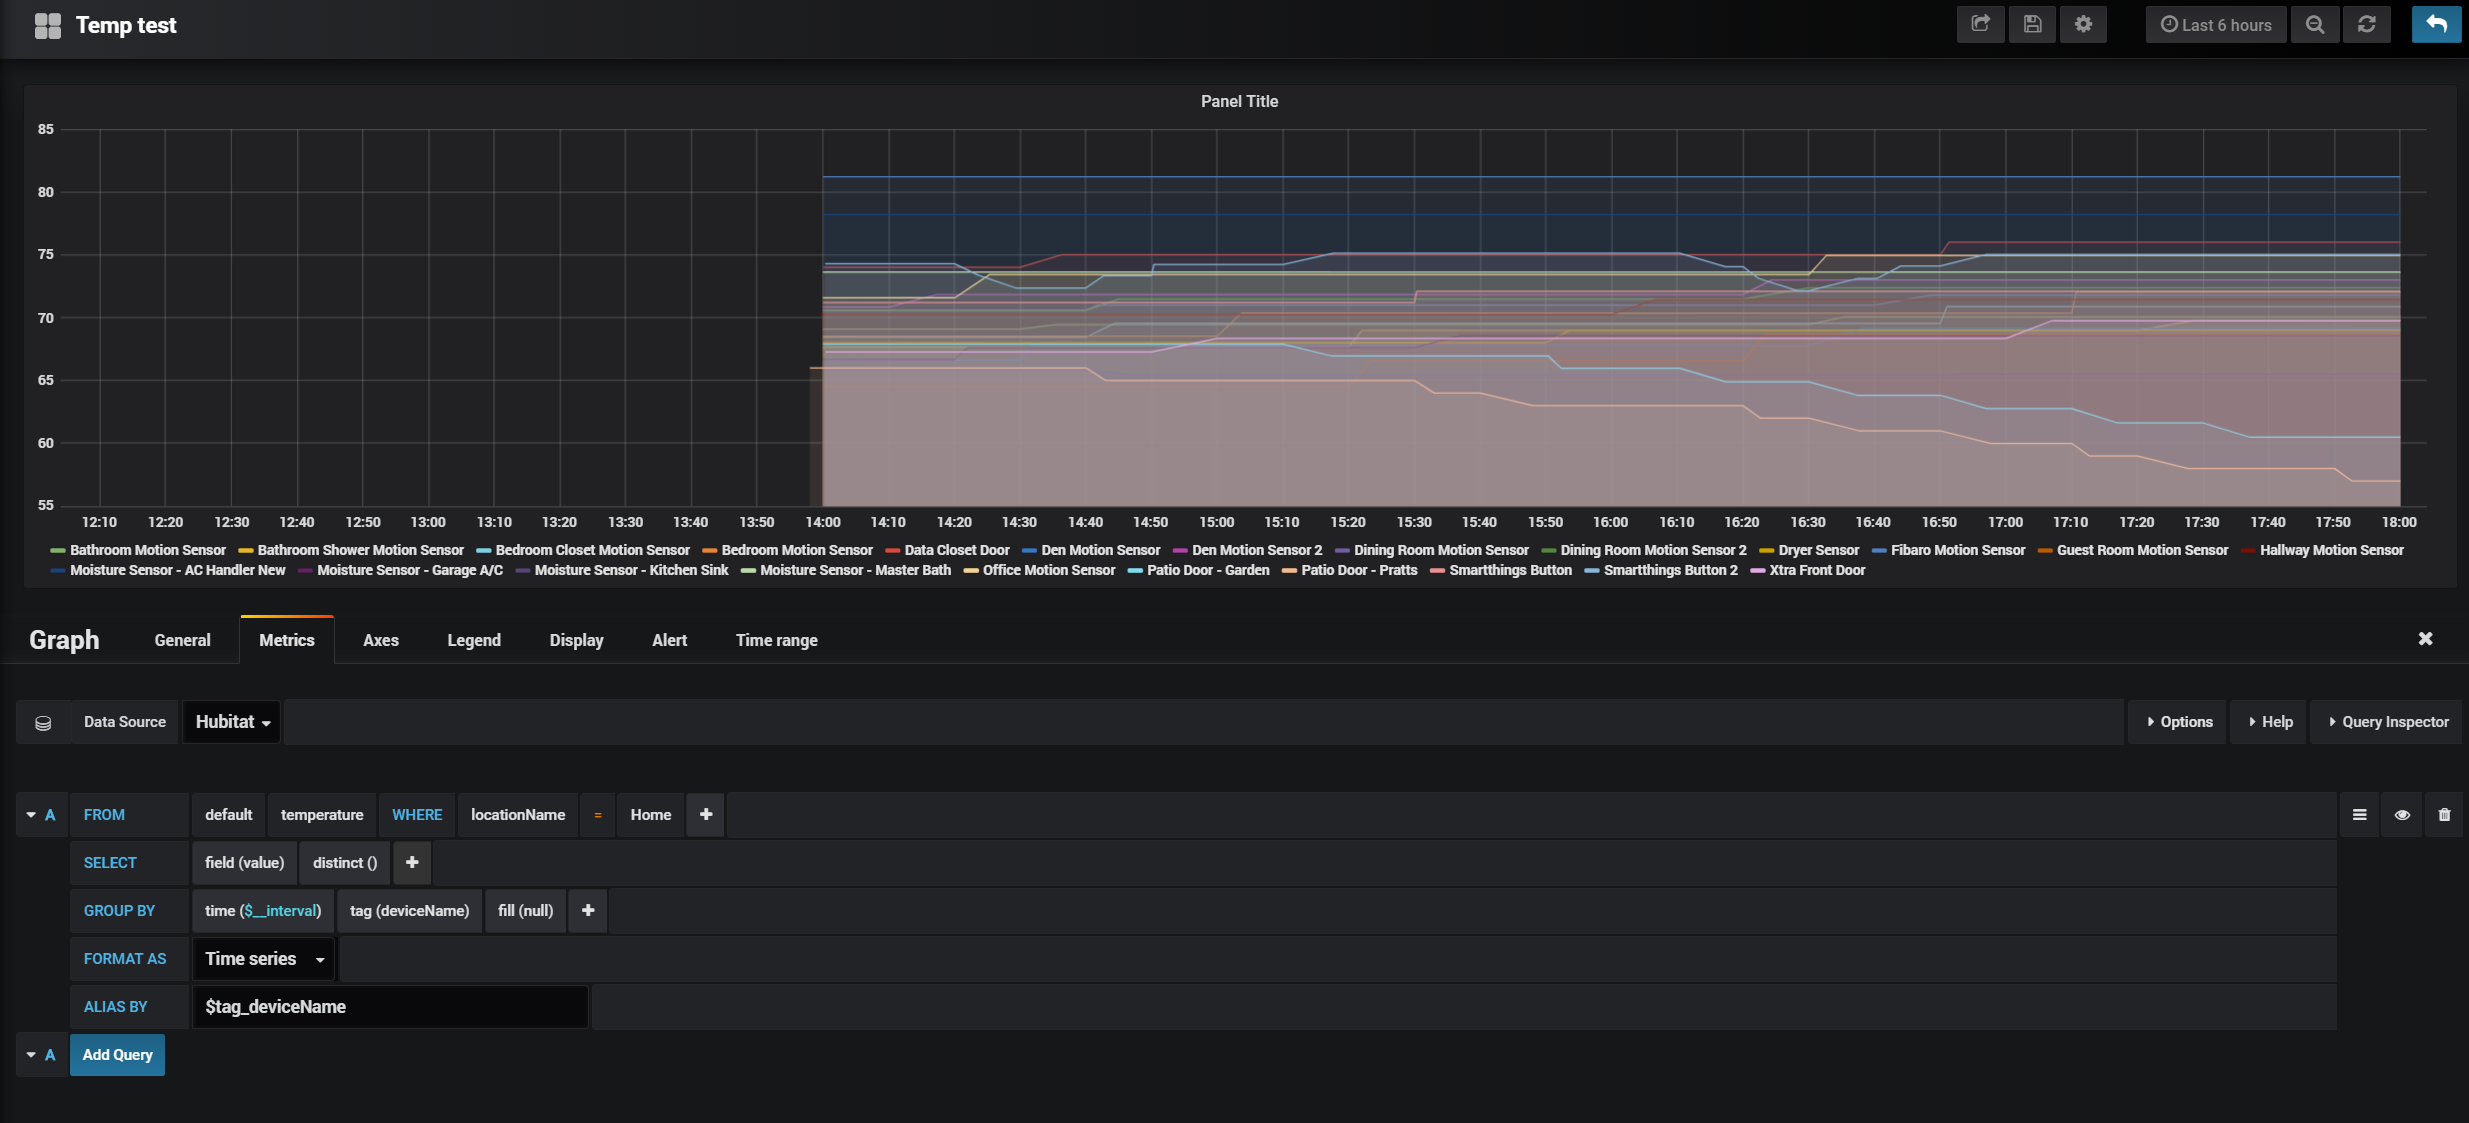
Instead of listing each temp individually you can group by tag(deviceName) and choose a more encompassing where like locationName. Usefull if you want to show all items taht report a metric instead of only specific ones.
Dont forget to ALIAS BY $tag_deviceName though to make it clean.
I tried that but it gave me a strange graph (single green line). I tried to replicate one of the posts above (probably yours).
And the Alias said exactly that....$tag_deviceName instead of any device name.
That's why it took me 30 minutes to get this 
That was the missing link. I tried again and realized that was the one thing I was missing. True success!!
Thank you @Shane_pcs
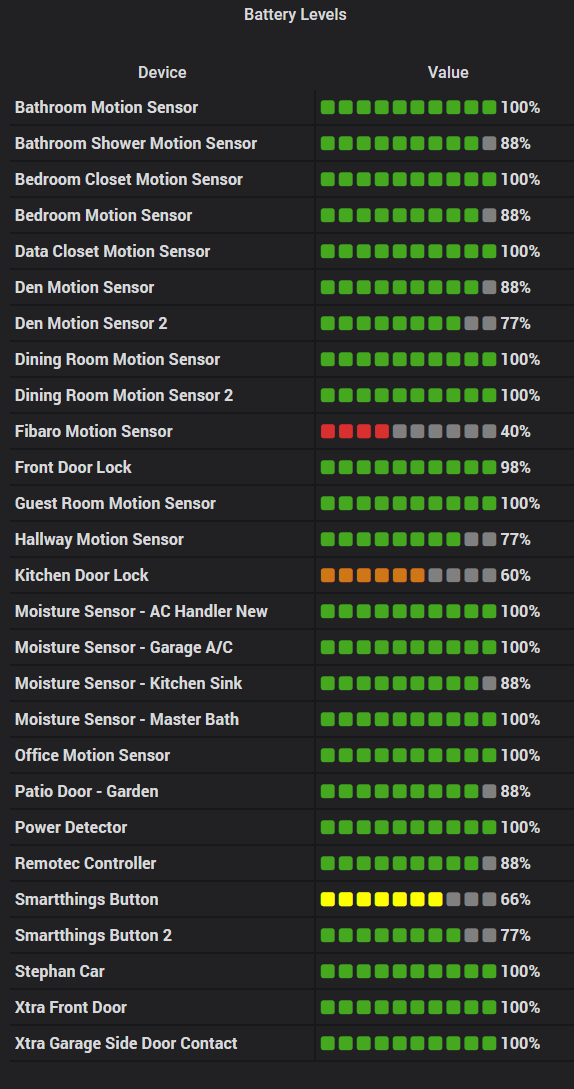
Liking the BoomTable plugin
Needed a bit more granularity on the battery report so I did it like this instead.
I feel like I'm missing something obvious.. I've got this working great with Smartthings and one of my particle phontons, but with nearly identical setups between Smartthings and Hubitat (with the obvious differences like the database), I'm getting this in my logs:
postToInfluxDB(): Something went wrong when posting: groovyx.net.http.HttpResponseException: Unauthorized
I've triple checked username/password but obviously I missed something...
Any ideas?
(Love the battery level meter btw - def plan on making use of that)
Nice! can you share your setup?
thanks
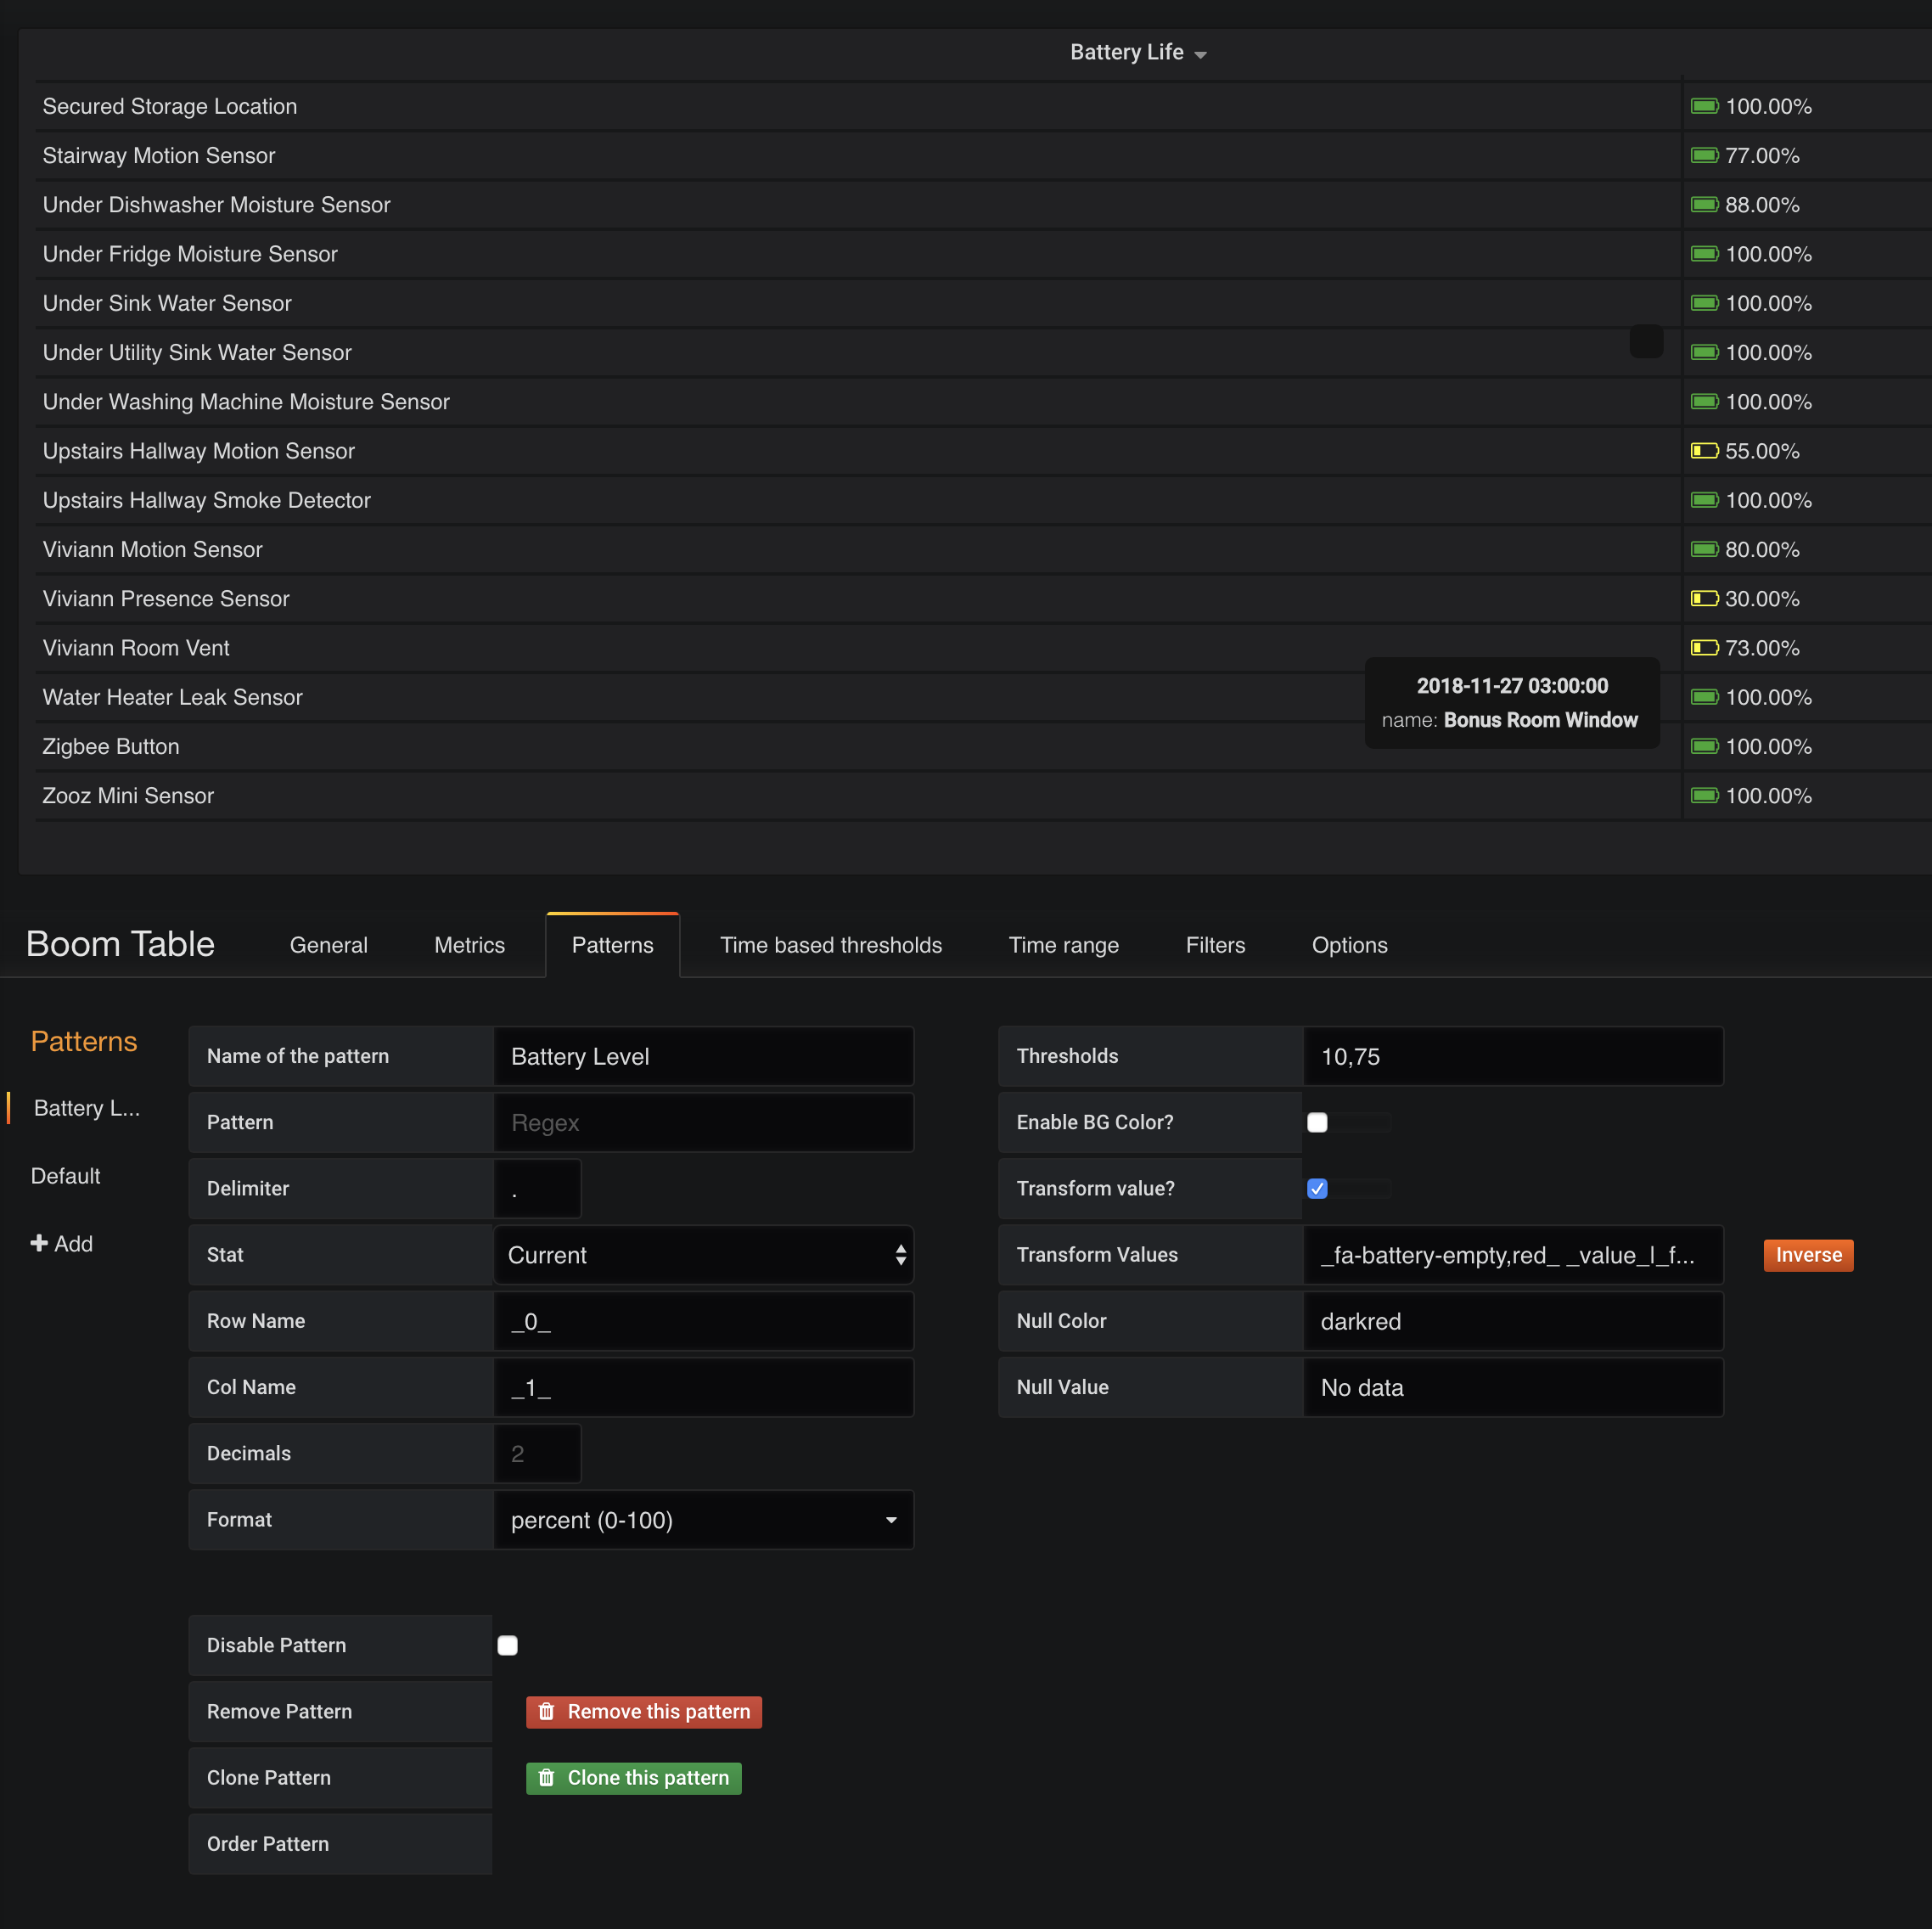
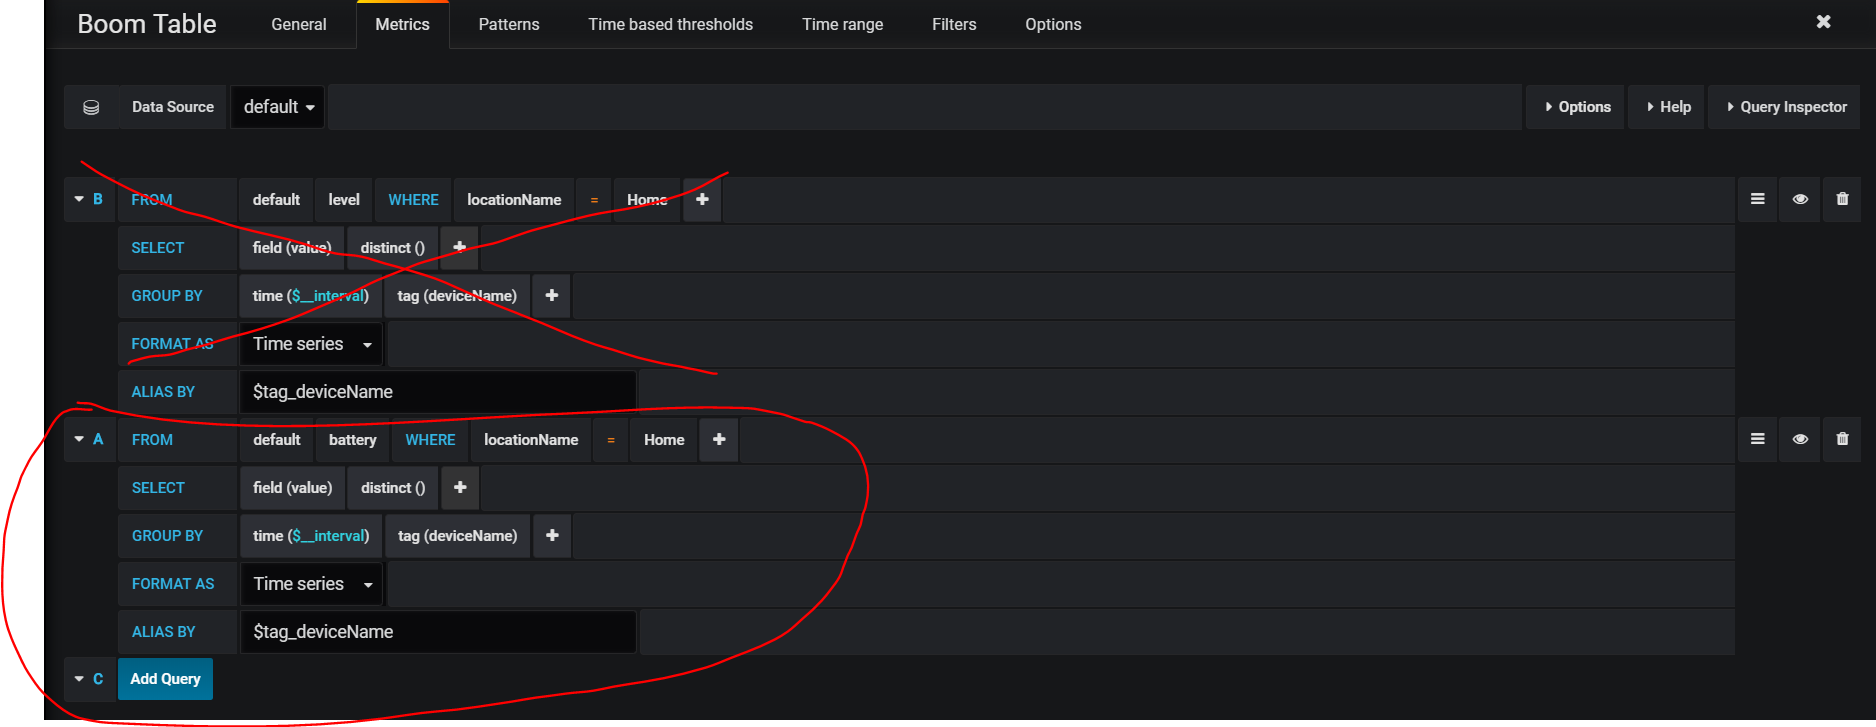
Sure.
The top section (crossed out) is for another non battery device and is not relevant
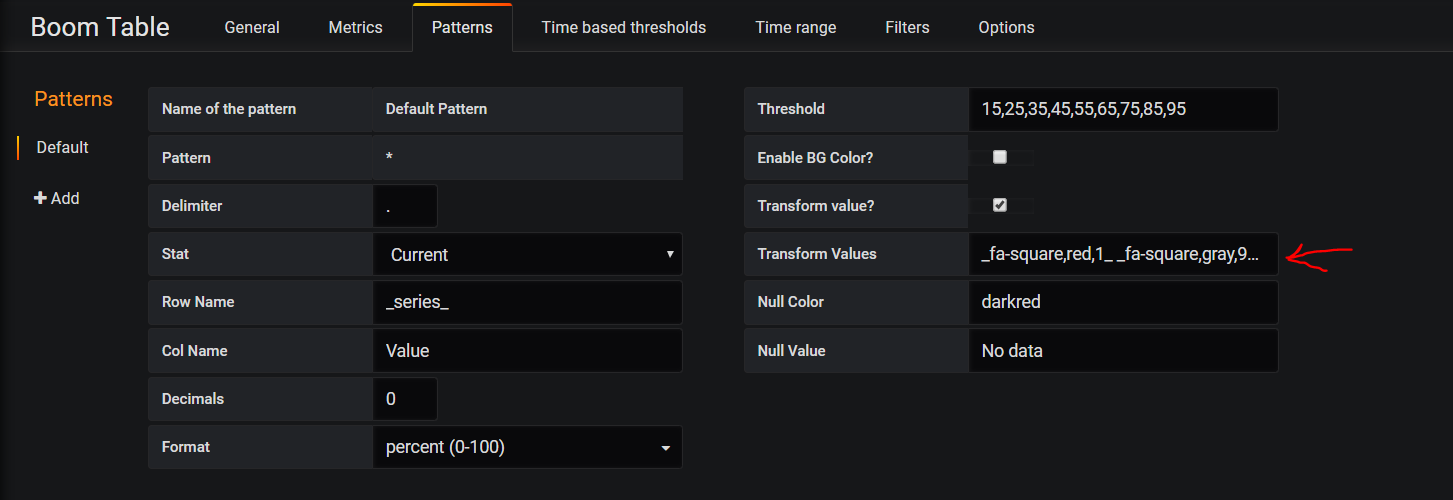
The pattern below is what transforms the data into the image into the layout in my previous post. The transform values are cut off, so here is the entire field
_fa-square,red,1_ _fa-square,gray,9_ _value_|_fa-square,red,2_ _fa-square,gray,8_ _value_|_fa-square,red,3_ _fa-square,gray,7_ _value_|_fa-square,red,4_ _fa-square,gray,6_ _value_|_fa-square,orange,5_ _fa-square,gray,5_ _value_|_fa-square,orange,6_ _fa-square,gray,4_ _value_|_fa-square,yellow,7_ _fa-square,gray,3_ _value_|_fa-square,green,8_ _fa-square,gray,2_ _value_|_fa-square,green,9_ _fa-square,gray,1_ _value_|_fa-square,green,10_ _fa-square,gray,0_ _value_
awesome! thanks
I'm a new user and I would really like to add some logging capabilities and I like what I am seeing here, but I also see on the forum that some have been having issues with their setup causing issues with the hub.
This is what I am talking about: InfluxDB Issue
Is it advisable to install this on the hub or is it just going to bring it down ?
That’s a really good question. I have two HE hubs, both running InfluxDB. I have had the production hub lock up twice over aboutnthe last 12 weeks. The development hub has never locked up, but the overall workload on that one is minimal compared to the other one. Is the cause InfluxDB? Maybe... I really don’t know for sure.
Just curious, did you come from any other platform? I more or less came from SmartThings but I tried Home Assistant in between. I actually never stopped maintaining my Home Assistant installation, even after all my devices and logic were moved to Hubitat, because they provide short-term (about the last day) device-history graphs by default, which is more or less enough for my purposes. I'm integrating them using the community-created MQTT Bridge apps (the Hubitat app and a literal bridge app running on the same server, along with the MQTT broker, though Home Assistant is also supposed to have one built-in).
I haven't noticed any problems with this setup and don't know that anyone else has either, but I'm only "subscribed" to the specific devices and capabilities that I want. In general, it's best to subscribe to the fewest number of events with the fewest apps possible (not necessarily total apps, just how many apps subscribe to the same events and all events total) ... or at least it was on a similar platform, but I haven't heard any contradicting advice here. ![]() While there may be other problems people are experiencing, I wouldn't be surprised if some problems were due to people's tendency to check all devices in every app that allows you to monitor/subscribe to things like this (Abacus, MQTT bridge, InfluxDB, possibly even webCoRE though there are additional problems there too).
While there may be other problems people are experiencing, I wouldn't be surprised if some problems were due to people's tendency to check all devices in every app that allows you to monitor/subscribe to things like this (Abacus, MQTT bridge, InfluxDB, possibly even webCoRE though there are additional problems there too).
Yes, I come from Vera. I was actually contemplating Home Assistant, installed it, but decided I just wanted to switch to a new system and not be burdened with the constant tinkering that I foresaw with HASS.
I am not thinking about logging all values, but I like the idea of it though, especially as I like the slick view of Grafana and I like the battery boomtable shown above. But my basic needs are just to log temperatures inside vs. the outside and wind direction. This will help me understand why my heaters may be going off more than expected, especially in some rooms over others.
As for logging on Vera, there is very little built-in, but I had a very basic LUA script that uploaded my temp values to thingspeak.com via their rest API. In theory, this is enough for me and even if some data points are missed due to outages, it would be good enough. I would however like to have some nicer graphs than Thingspeak provided.
Using Cloud services is ok as it means less administrative overhead to deal with. I also see mentions about the approach of writing into a db may be causing issues. Perhaps we could use rest APIs instead ?
I see above that @ejlorson may provide something akin to what I am looking for, but not sure if/when this will be available. I also see Initialstate mentioned and that could work as well for me.
This is what I used on Vera:
-- Temperature
local IN_STOFA = luup.variable_get("urn:upnp-org:serviceId:TemperatureSensor1", "CurrentTemperature", 59)
local OUT_SOUTH = luup.variable_get("urn:upnp-org:serviceId:TemperatureSensor1", "CurrentTemperature", 323)
local IN_BARNA = luup.variable_get("urn:upnp-org:serviceId:TemperatureSensor1", "CurrentTemperature", 407)
local IN_BADH = luup.variable_get("urn:upnp-org:serviceId:TemperatureSensor1", "CurrentTemperature", 409)
local IN_HJONA = luup.variable_get("urn:upnp-org:serviceId:TemperatureSensor1", "CurrentTemperature", 408)

-- Send data to channel 1
local http = require("socket.http")
http.TIMEOUT = 5
local result, status = http.request("http://api.thingspeak.com/update?key={obscured}&field1="..IN_STOFA.."&field2="..OUT_SOUTH.."&field3="..IN_BARNA.."&field4="..IN_BADH.."&field5="..IN_HJONA.."", "run=run")
As you can see, it is pretty basic, but that was mainly because battery values in Vera were never correct and I had a myriad of other issues so I was not that excited on building upon a broken system.
Although I have the "code" above, I wouldn´t know where to start on how to implement it into Hubitat and as mentioned above, I would like some thing that looks a bit nicer.
One area where Vera was particularly bad was that the hub (Vera Edge) was underpowered. When coming to Hubitat I didn't even think about this, but then I see that perhaps that may be a tad underpowered too ? At least if you want to do any "heavy" work on it ? Do we have any specs about the Hubitat hardware and/or the load on CPU / Memory ?
EDIT: Actually, I also had DataYours installed. It looked nice, but very problematic on my Vera and the data got corrupted on the USB stick.