Thanks for making this available. I installed influxdb and grafana on my Ubuntu system and had data logging and charted in less than an hour. The influxdb logging app on my HE installed without a problem.
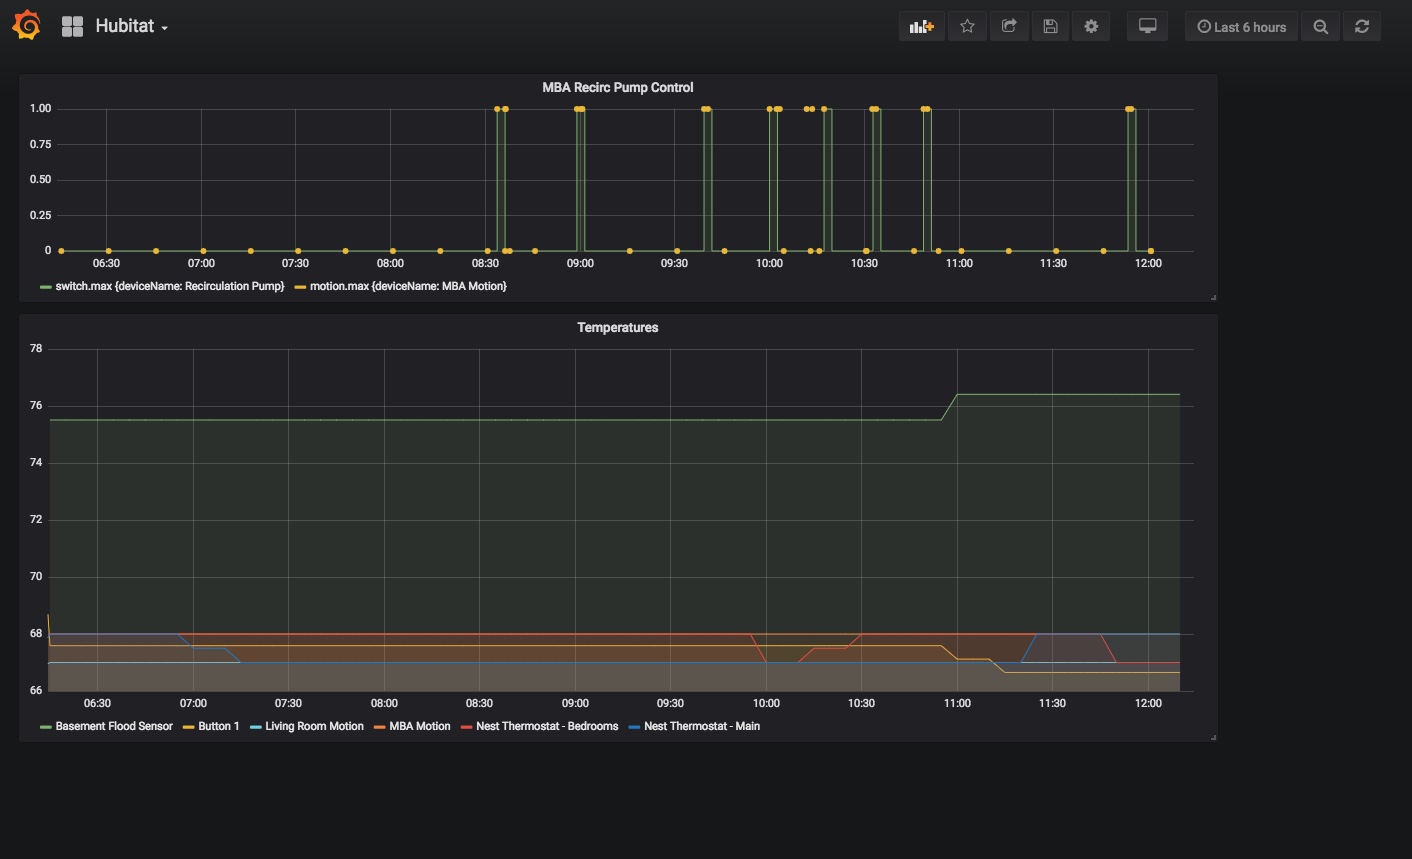
Here's a sample set of graphs: one is to help me verify the correct functioning of some rules that control how a hot water recirculation pump is cycled; and the other shows various temperature sensors around the house.
Anyone have any good methods of setting up a Docker Container that runs Influx and Grafana? I followed the links through Codersaur's site which linked to a Home Assistant tutorial but the Container I pull won't start.
Thanks.
So I'm gathering from error research that this is an x86 installation?
I'm trying to run it on Raspberry Pi.
Maybe that's what my last error was as well. I'll try to find the ARM version.
Hey so I got it all working. Awesome stuff!
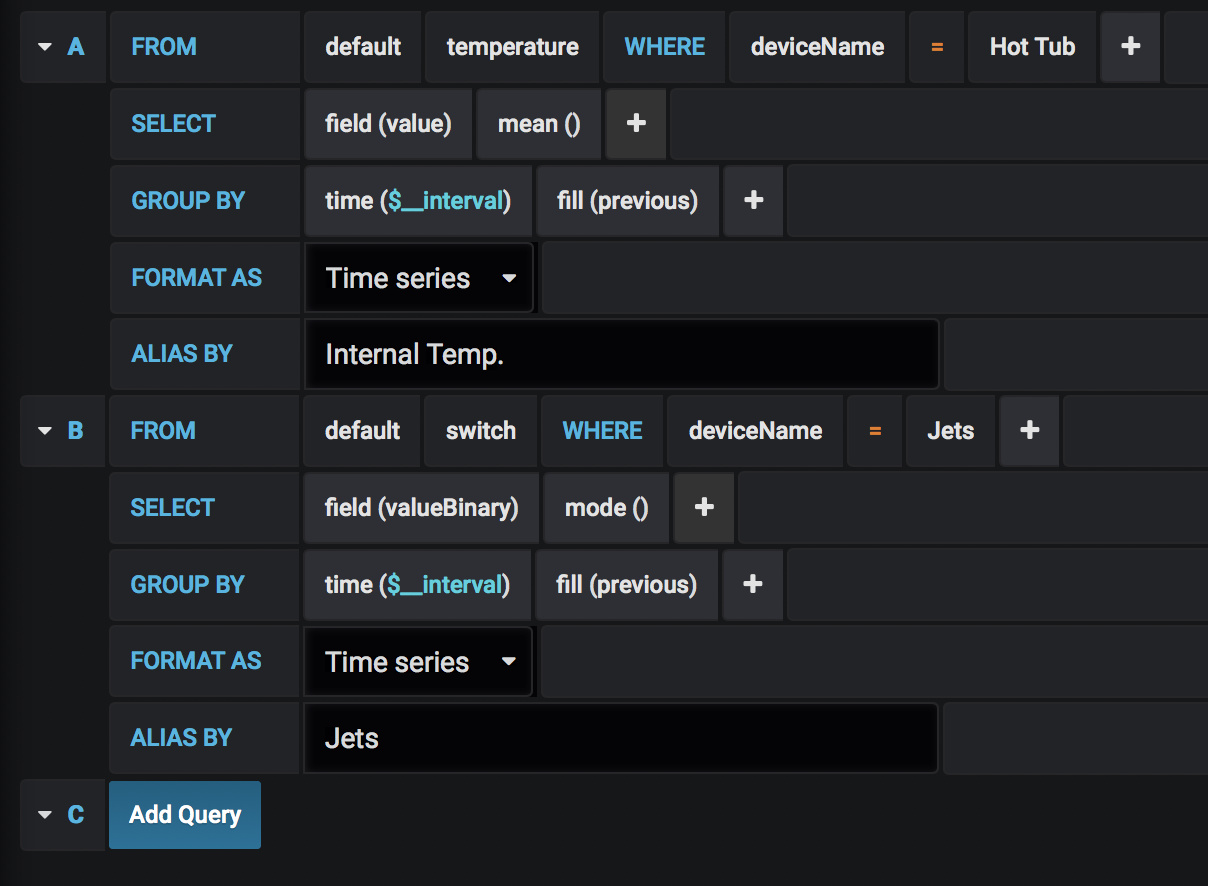
Do you get mode to report to InfluxDB?
I toggled the toggle to ON but I don't see it under _heHub or anything.
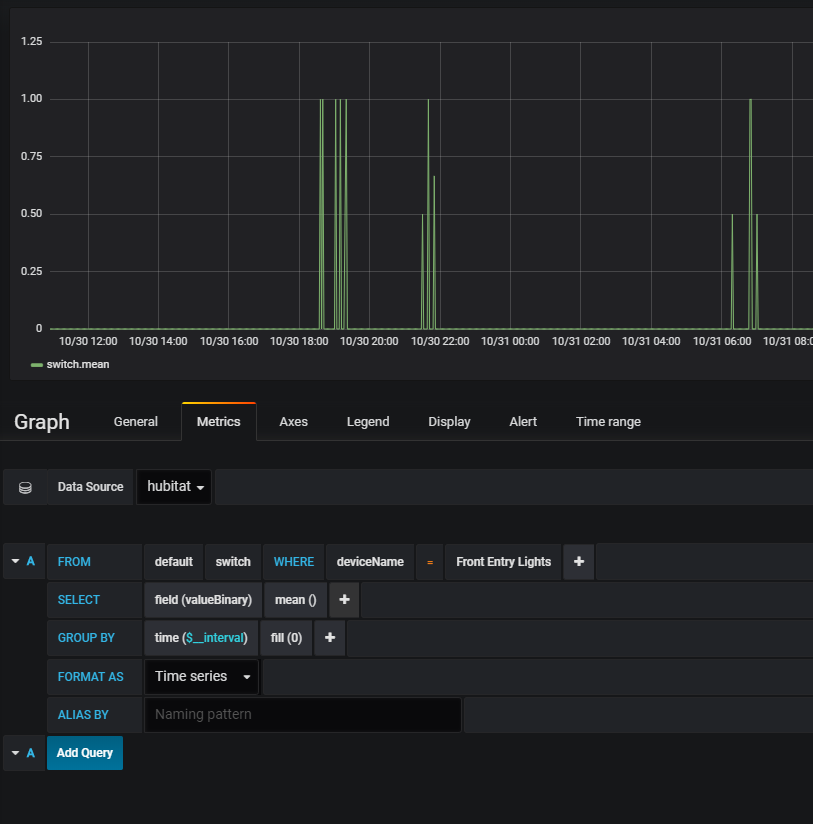
I see the switch data makes it to Influx, but I'm not getting it to display - even in a table format, which confuses me. Continuous scalar data like temperature is fine.
Were there any special steps to getting it going on your Mac? I downloaded Docker and added influxdb-grafana. I started docker and then went it and added the influxdb but when I try to access it (http://localhost8086), I get a page not found. In the Data Source page, I see my InfluxDB config and it tests fine. When I go to the Home Dashboard, it doesn't show any installed datasources. I'm missing something really simple here.
Okay. That works really well. This is pretty easy overall. A great find. At the moment I'm just trying to find a way to display the logs as they do in Hubitat. I'm hoping this will be a solution for long term log holding and app debugging.
Yeah...That's what I was thinking, but I have to get the hang of labeling and defining the time small enough. It's also choosing what I want to send from HE. I don't want to burry the device with everyone (although that would be pretty cool).
FWIW, you can filter within the query for the table. It's not going to hurt the database any, even if you were logging all statuses every second. Not unless your 'house' is the mall of America or something...