That sounds about right…
So should I expect to see the system free that up after some time?
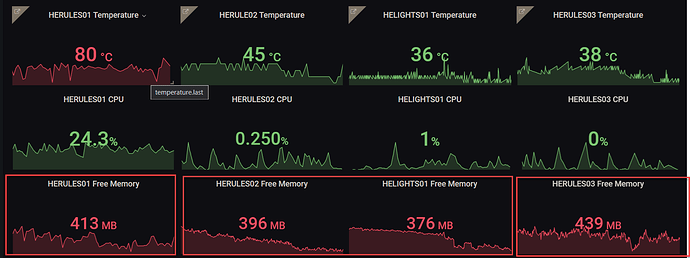
My production hub usually drops to around 415000 a short time after reboot and then slowly drops over time, dev hub drops to about 520000 after settling in from a reboot and then very very slowly decreases over time. When I hit about 285000 I schedule a reboot.
Not sure if it's of any use, but in terms of memory, I noticed in the last few days a difference in the trend of the memory across my 4 HE hubs, 2 have a gentle decrease over time (although this morning one did drop at one point), and the other two bounce around. I do intend to try and understand what is causing the difference in behaviour, mostly because it may be some code I have written.
When I have a big drop in memory it is usually because I’ve updated a lot of code and forced several recompiles, or I have a run away task because I made an error in some code that I’m playing with.
Thanks. I was probably more interested in why they trend differently, but I will also look into that as well.
Trending differences can have a lot of reasons. Can’t prove it, but my suspicion is that the # of http calls, particularly long running ones or ones with dropped connections, has a direct impact. The recompiles I already mentioned, but I’m sure there are other leaks too.
Yep, that's the theory I'm working on as well. I've done a few drivers over my time that do make HTTP calls and have only started to transition them to being asynchronous in the last week or so. So I will start by getting my own house in order, then see where I'm at.
What is everyone using for auto rebooting?
I don’t auto-reboot but if I did:
I had this same issue and went back to the built in hubitat ecobee app and I have never had a severe CPU again.
…and you got my good side too.

Update.
11AM yesterday - 2022-01-07 10:59:16,441000,0.12
11AM today- 2022-01-08 10:54:15,422848,0.01
Continuing to monitor. Hub up time is about 2.5 days now.
Sounds about right for a production hub.
Alright. So I ran al little over three days and experienced the same processor jump to 1.0% sustained with free memory 412516. I have disabled some community drivers, switched over to built in ones, and I will see how that goes.
Well…
This morning hub completely frozen and hot to the touch. First total freeze up in a few weeks. I have opened a ticket with support to start getting on their radar officially.
Sounds like a process got into a tight processing loop, became a runaway, and the resultant CPU activity overheated hub, and caused a shut down. Would be interesting to hear what the engineering logs show. @gopher.ny
Just wanted to keep updating here. I have written to support and given them information. I hope they can look into my logs a little deeper and determine what might have caused these issues.
I will say, since my last lockup the morning of 1/10, I have had over five days of runtime with no CPU spikes and no Lockups. This is by far the longest I have gone in a very long time. I did remove the Ecobee Driver, but I did also notice a Zigbee device sending tons of temperature change reporting through the day. I disabled that reporting as well.
I remain optimistic, that one of these two might have been the issue. Especially because I saw a ton of reporting from the Zigbee device just prior to the lockup. I eventually plan to try a clean install of the Ecobee Suite to see if the problem may have been the sensor all along. The stock driver does not come close to having the features I want, but I am getting by in the meantime.


