This is new after updating to 2.2.5.119. My C5 is showing Severe CPU Load but appears to be running properly. I have changed nothing since the update. How do I monitor or find out what is causing the load. How do I trouble shoot this. Can’t find a screen that addresses this.
The enhanced system notification was made possible by the newly released device and app runtime statistics, which can be found on the Logs page. Please review the newly added tabs to learn more about what is consuming your hub’s resources. Severe CPU load can trigger the hub to shut down, so this is likely the explanation for your other post. It could be a hardware malfunction but also it could be an app or a driver that is casing this. If you can’t figure it out by looking at the stats, please share screenshots of both tabs.
I suspected that because when I went to the tabs that @bobbyD described and reset the stats it didn’t clear anything. The warning did go away when I did a proper reboot.
Been having problems upgrading my C-5 hub from 2.2.4.158 and was just able to complete the upgrade to 2.2.5.131, I am now seeing continuous reports of 'severe hub CPU load detected'. This is the first time I am seeing these events since I installed the hub. I have made no changes to the devices or applications. Do you have any suggestions as to possible causes and how I can correct this?
I had this alert appear on my C-4 but not my C-7, upgraded them to 2.2.5.131 at the same time. I reset both the device and app stats in the logs page, but only did this in the last 5-10 minutes. The alert went away, but it has only been a short time....
I am getting this same error over and over again in my system events and will not go away, I was on 2.2.5.130 and to try and get rid of it I upgraded to 2.2.5.131 and still is happening constantly. I am currently trying to downgrade to 2.2.5.124 to see if this fixes it.
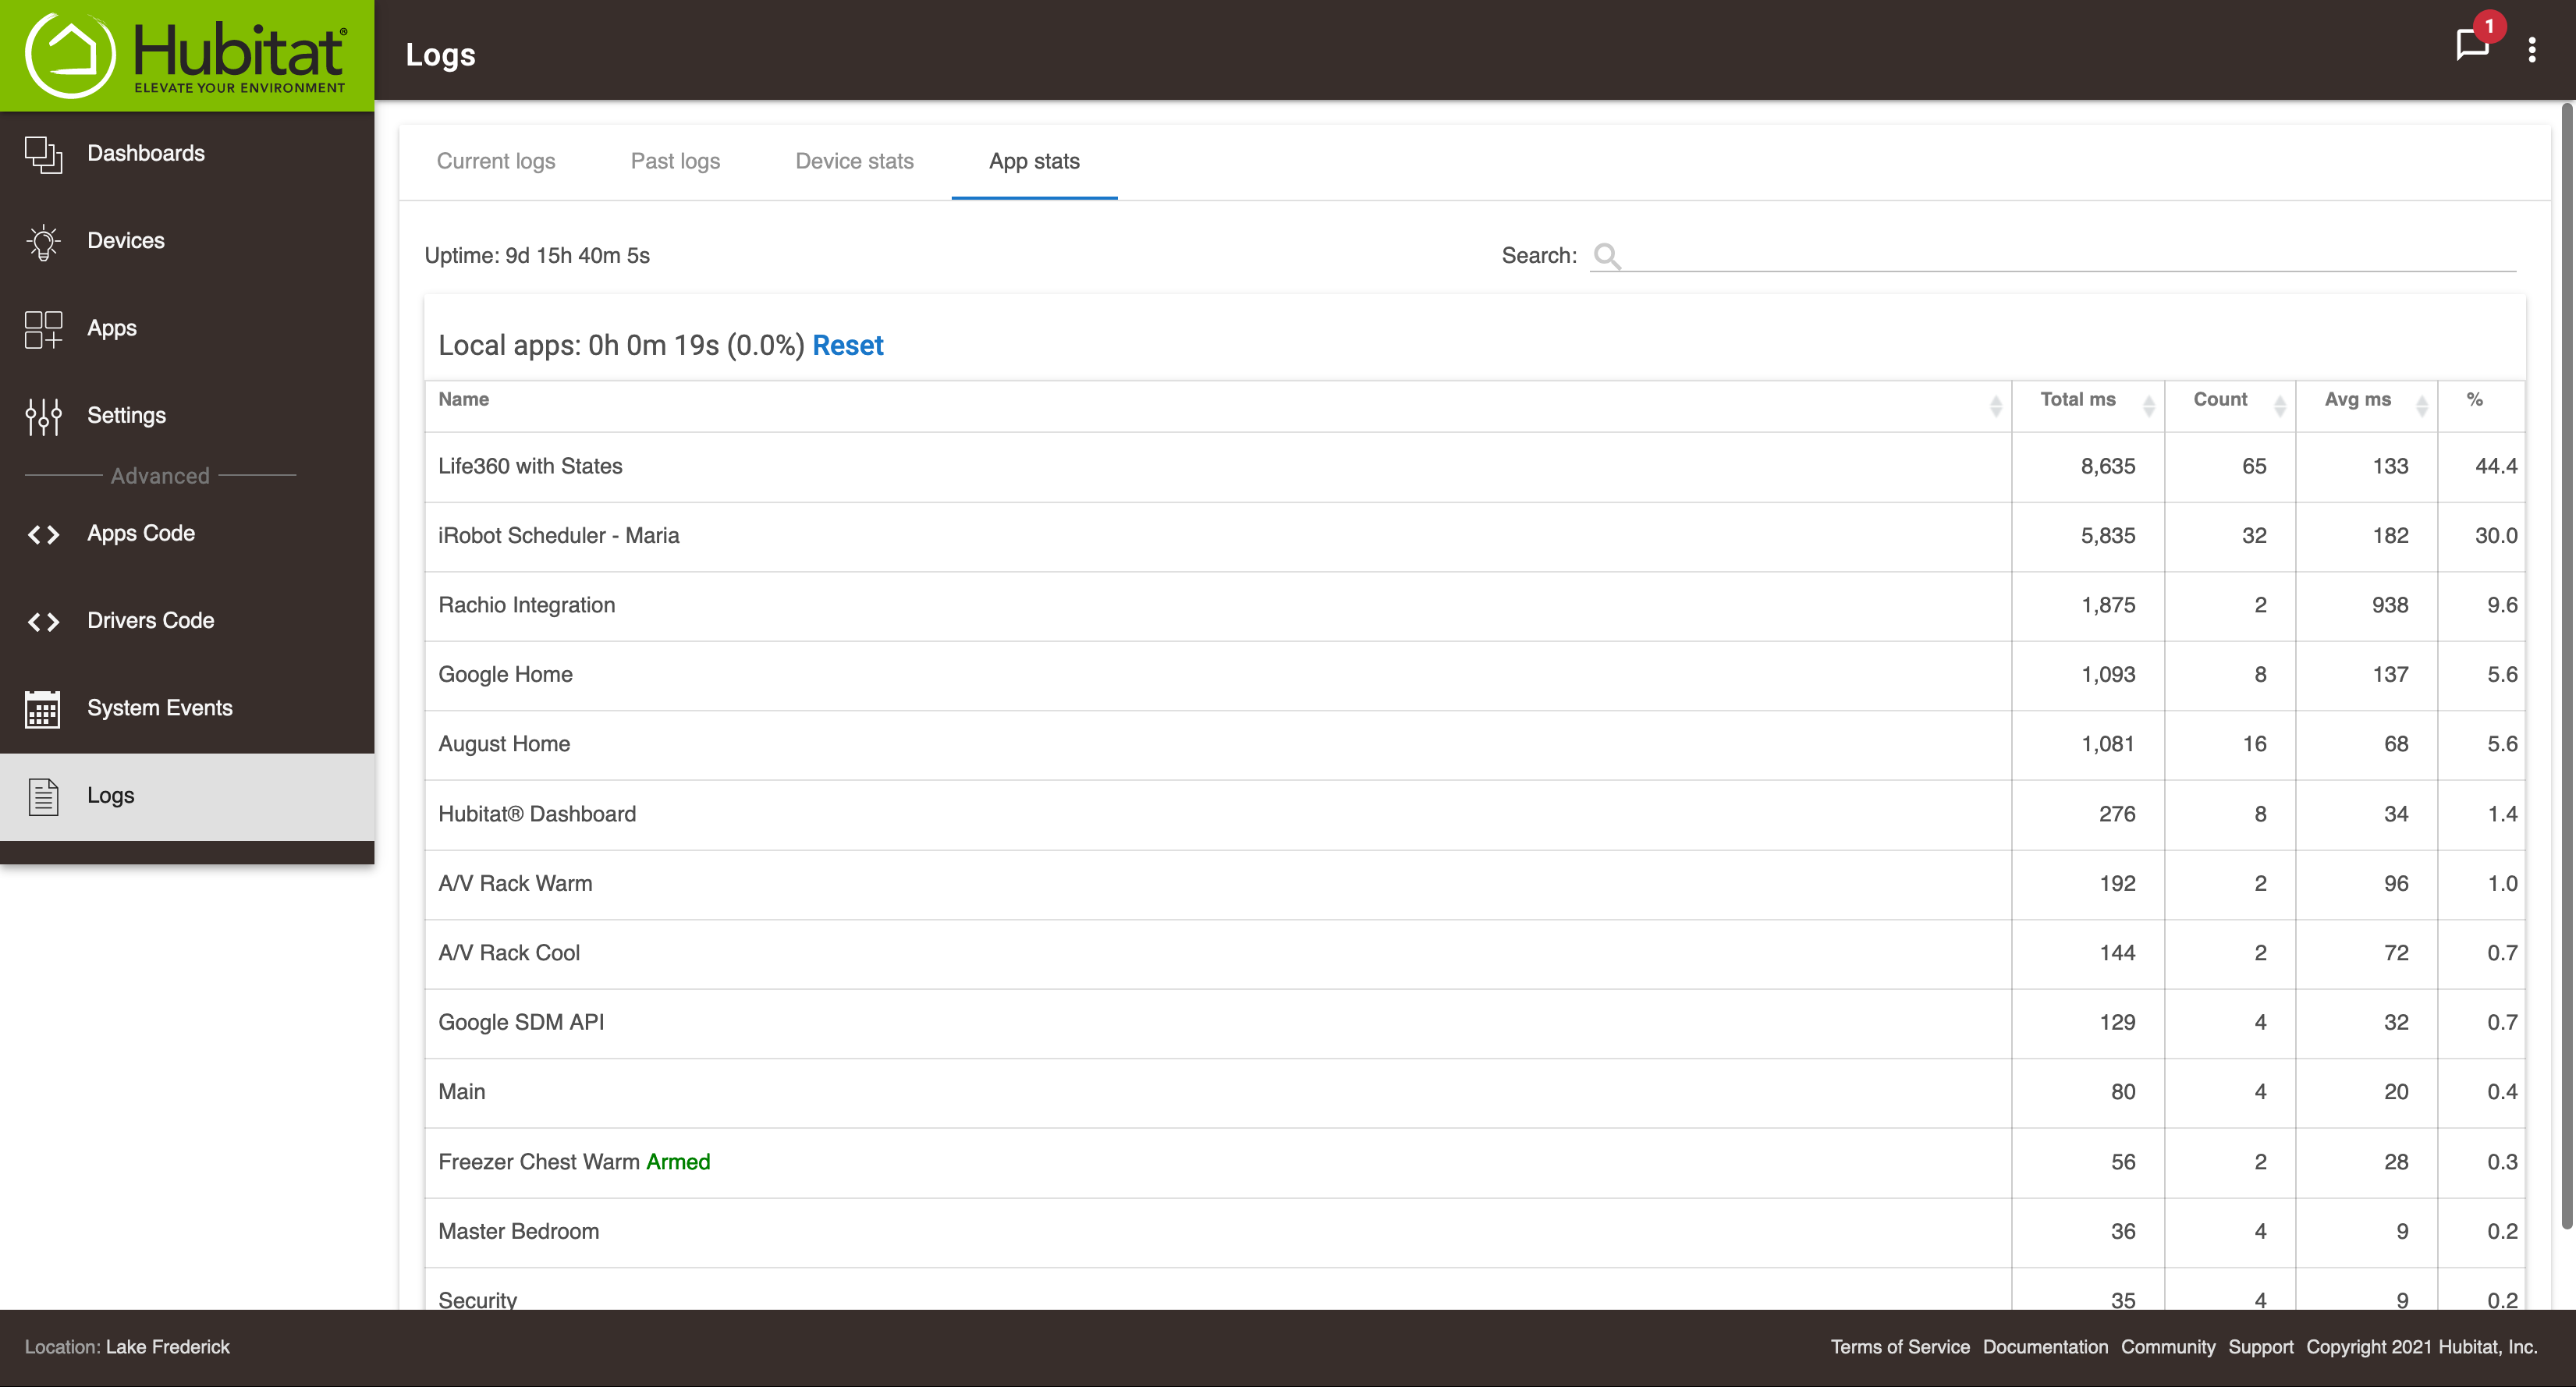
So I am getting the error now as well and it looks to be a few Apps I have added... I guess my only option is to remove them and report the behavior to the author of the apps and wait for a fix correct? See the attached screenshot for the app load.
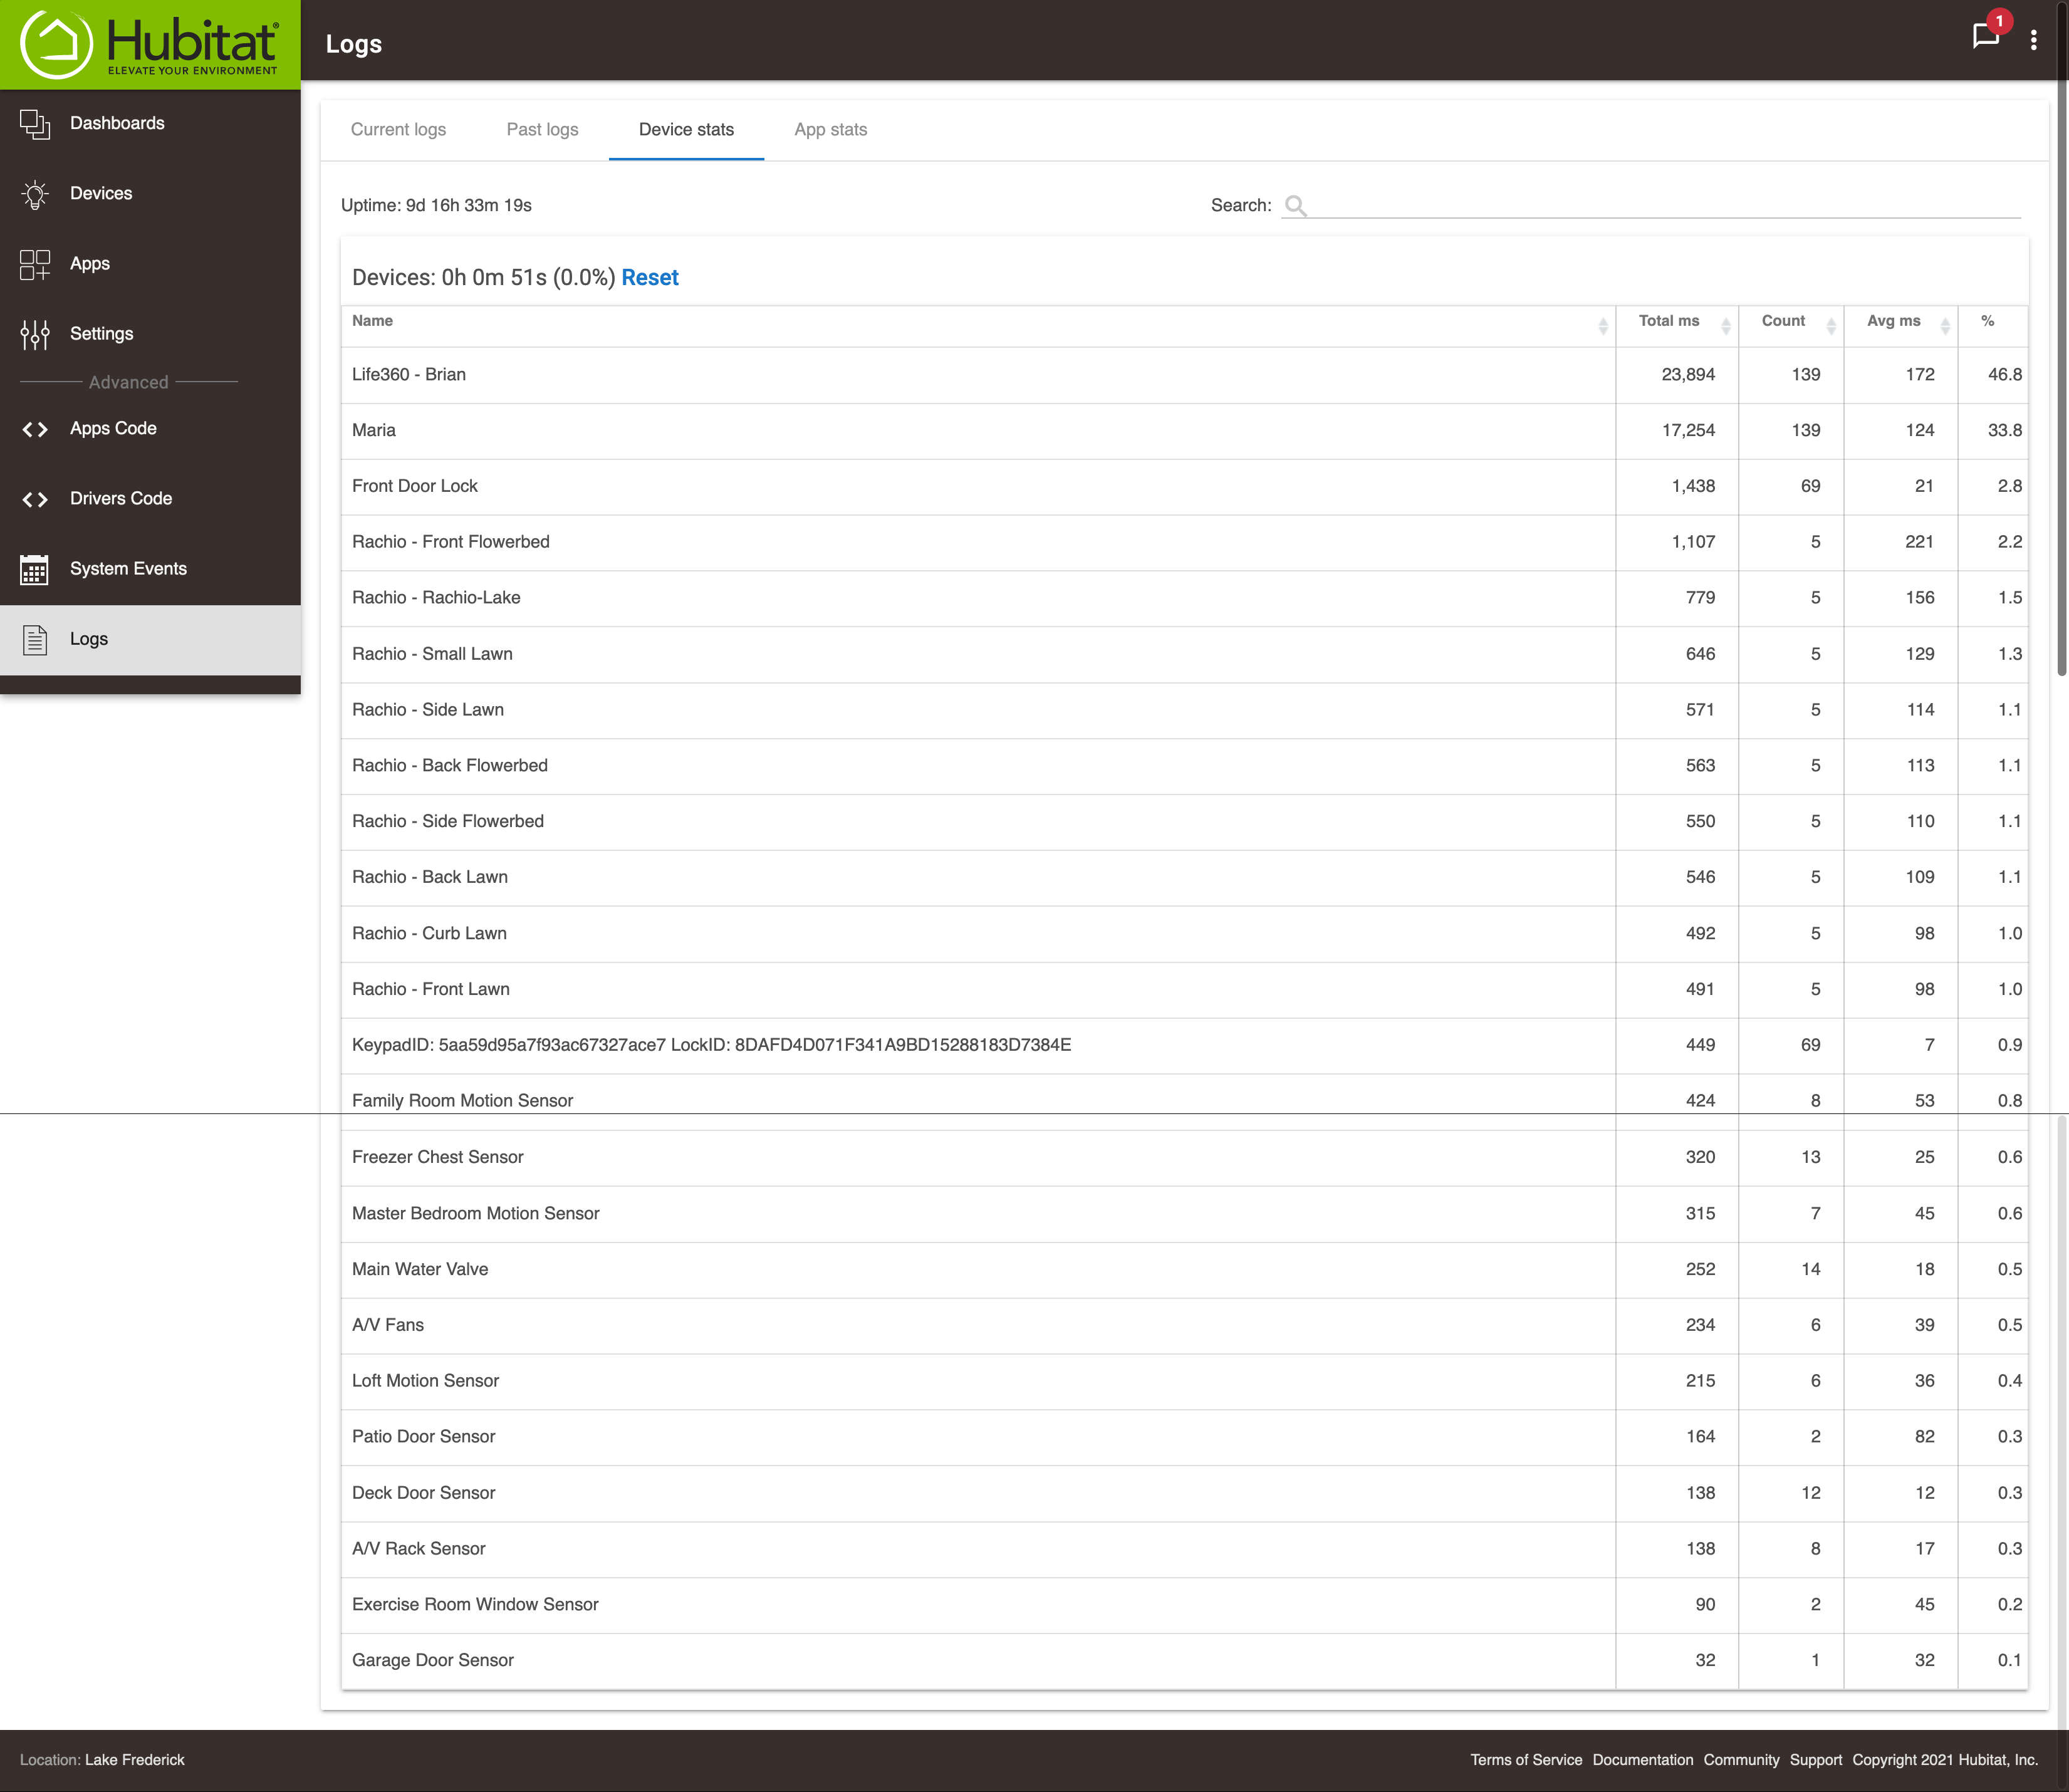
Here is the device tab... The alert is still active and comes back after reboot etc... What is the percent on the side mean? Is it not like taskmgr for windows showing the active usage? If the total time for both tabs is 0% why is the alert showing? What am I supposed to be looking at here for CPU Load / Mem usage on the HE? Thanks!