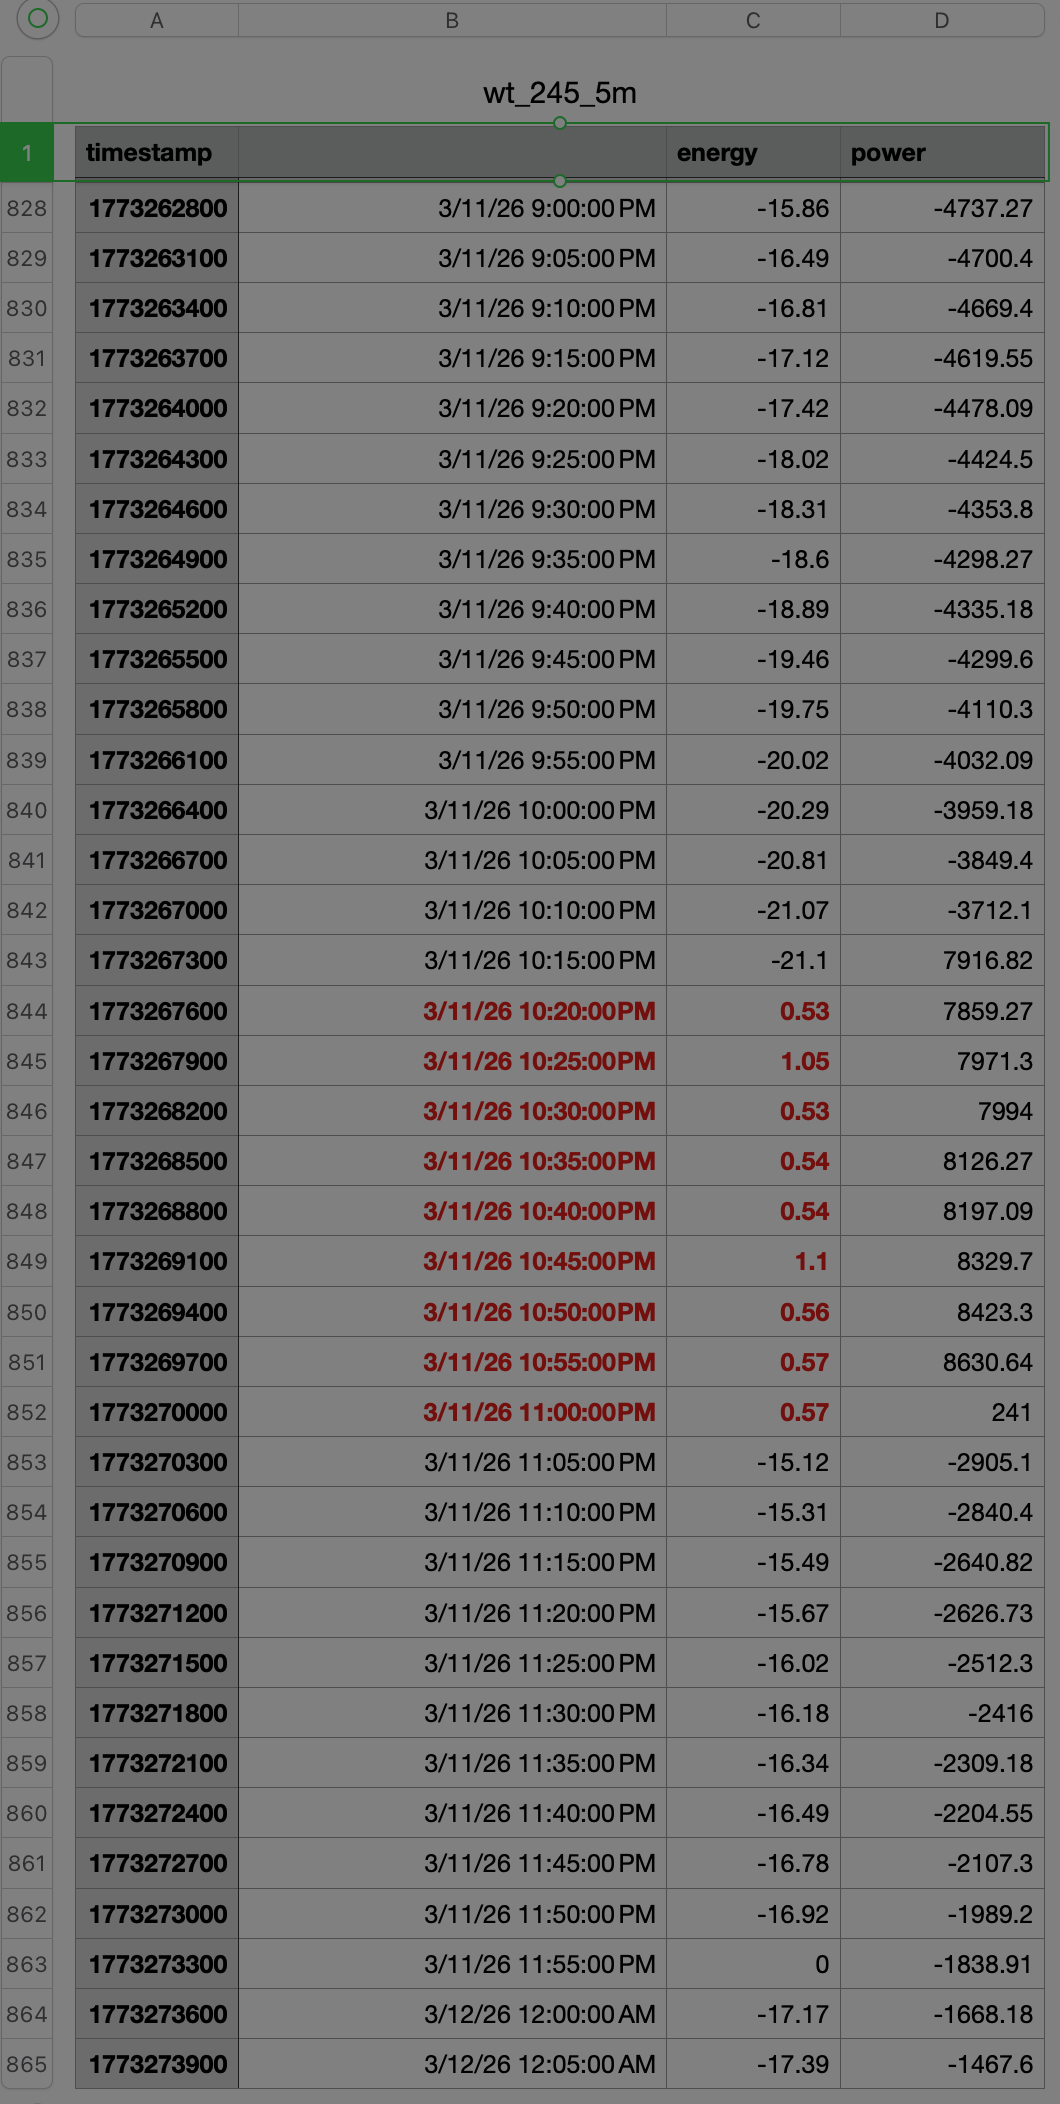
First, my apologies to everyone for an excessive number of posts as I worked through this. More difficult to figure out than the initial setup, because "it was working."
Now. I determined that the reason the csv file wasn't getting data was because the attributes Watchtower offered at device config and was looking for (power, energy) are not served by the device. I fixed it by adding
    // Aeotec HEM-8
    'energy-Endpoint-5': [min:0, unit:'kWh', minMax:false, probe: { device, app, events, begin, end -> calc5minAverage(device, app, 'energy-Endpoint-5', events, begin, true) }],
    'energy-Endpoint-6': [min:0, unit:'kWh', minMax:false, probe: { device, app, events, begin, end -> calc5minAverage(device, app, 'energy-Endpoint-6', events, begin, true) }],
    'energy-Endpoint-7': [min:0, unit:'kWh', minMax:false, probe: { device, app, events, begin, end -> calc5minAverage(device, app, 'energy-Endpoint-7', events, begin, true) }],
    'power-Endpoint-5': [min:0, unit:'W', minMax:true, probe: { device, app, events, begin, end -> calc5minAverage(device, app, 'power-Endpoint-5', events, begin, true) }],
    'power-Endpoint-6': [min:0, unit:'W', minMax:true, probe: { device, app, events, begin, end -> calc5minAverage(device, app, 'power-Endpoint-6', events, begin, true) }],
    'power-Endpoint-7': [min:0, unit:'W', minMax:true, probe: { device, app, events, begin, end -> calc5minAverage(device, app, 'power-Endpoint-7', events, begin, true) }],
to SUPPORTED_ATTRIBUTES in watchtower.groovy. I must have also done this when I first got device working, and then forgotten. Which of course the update overwrote. Note to self, unless you wish to add these to the code yourself, Dan. (Endpoints 5 are power/energy imported, endpoints 6 power/energy exported, and 7 = 5+6. I only use the 5s, but listed all three for thoroughness. The HEM-8 offers many other endpoints, but let's be practical here.)
I also modified the generic 'energy' attribute to use calc5minAverage() instead of calc5minIncrease(), because I want the KWh graph to be cumulative. Is there a better way to make it cumulative, using increase? I don't see a way for chart.js to support deltas.