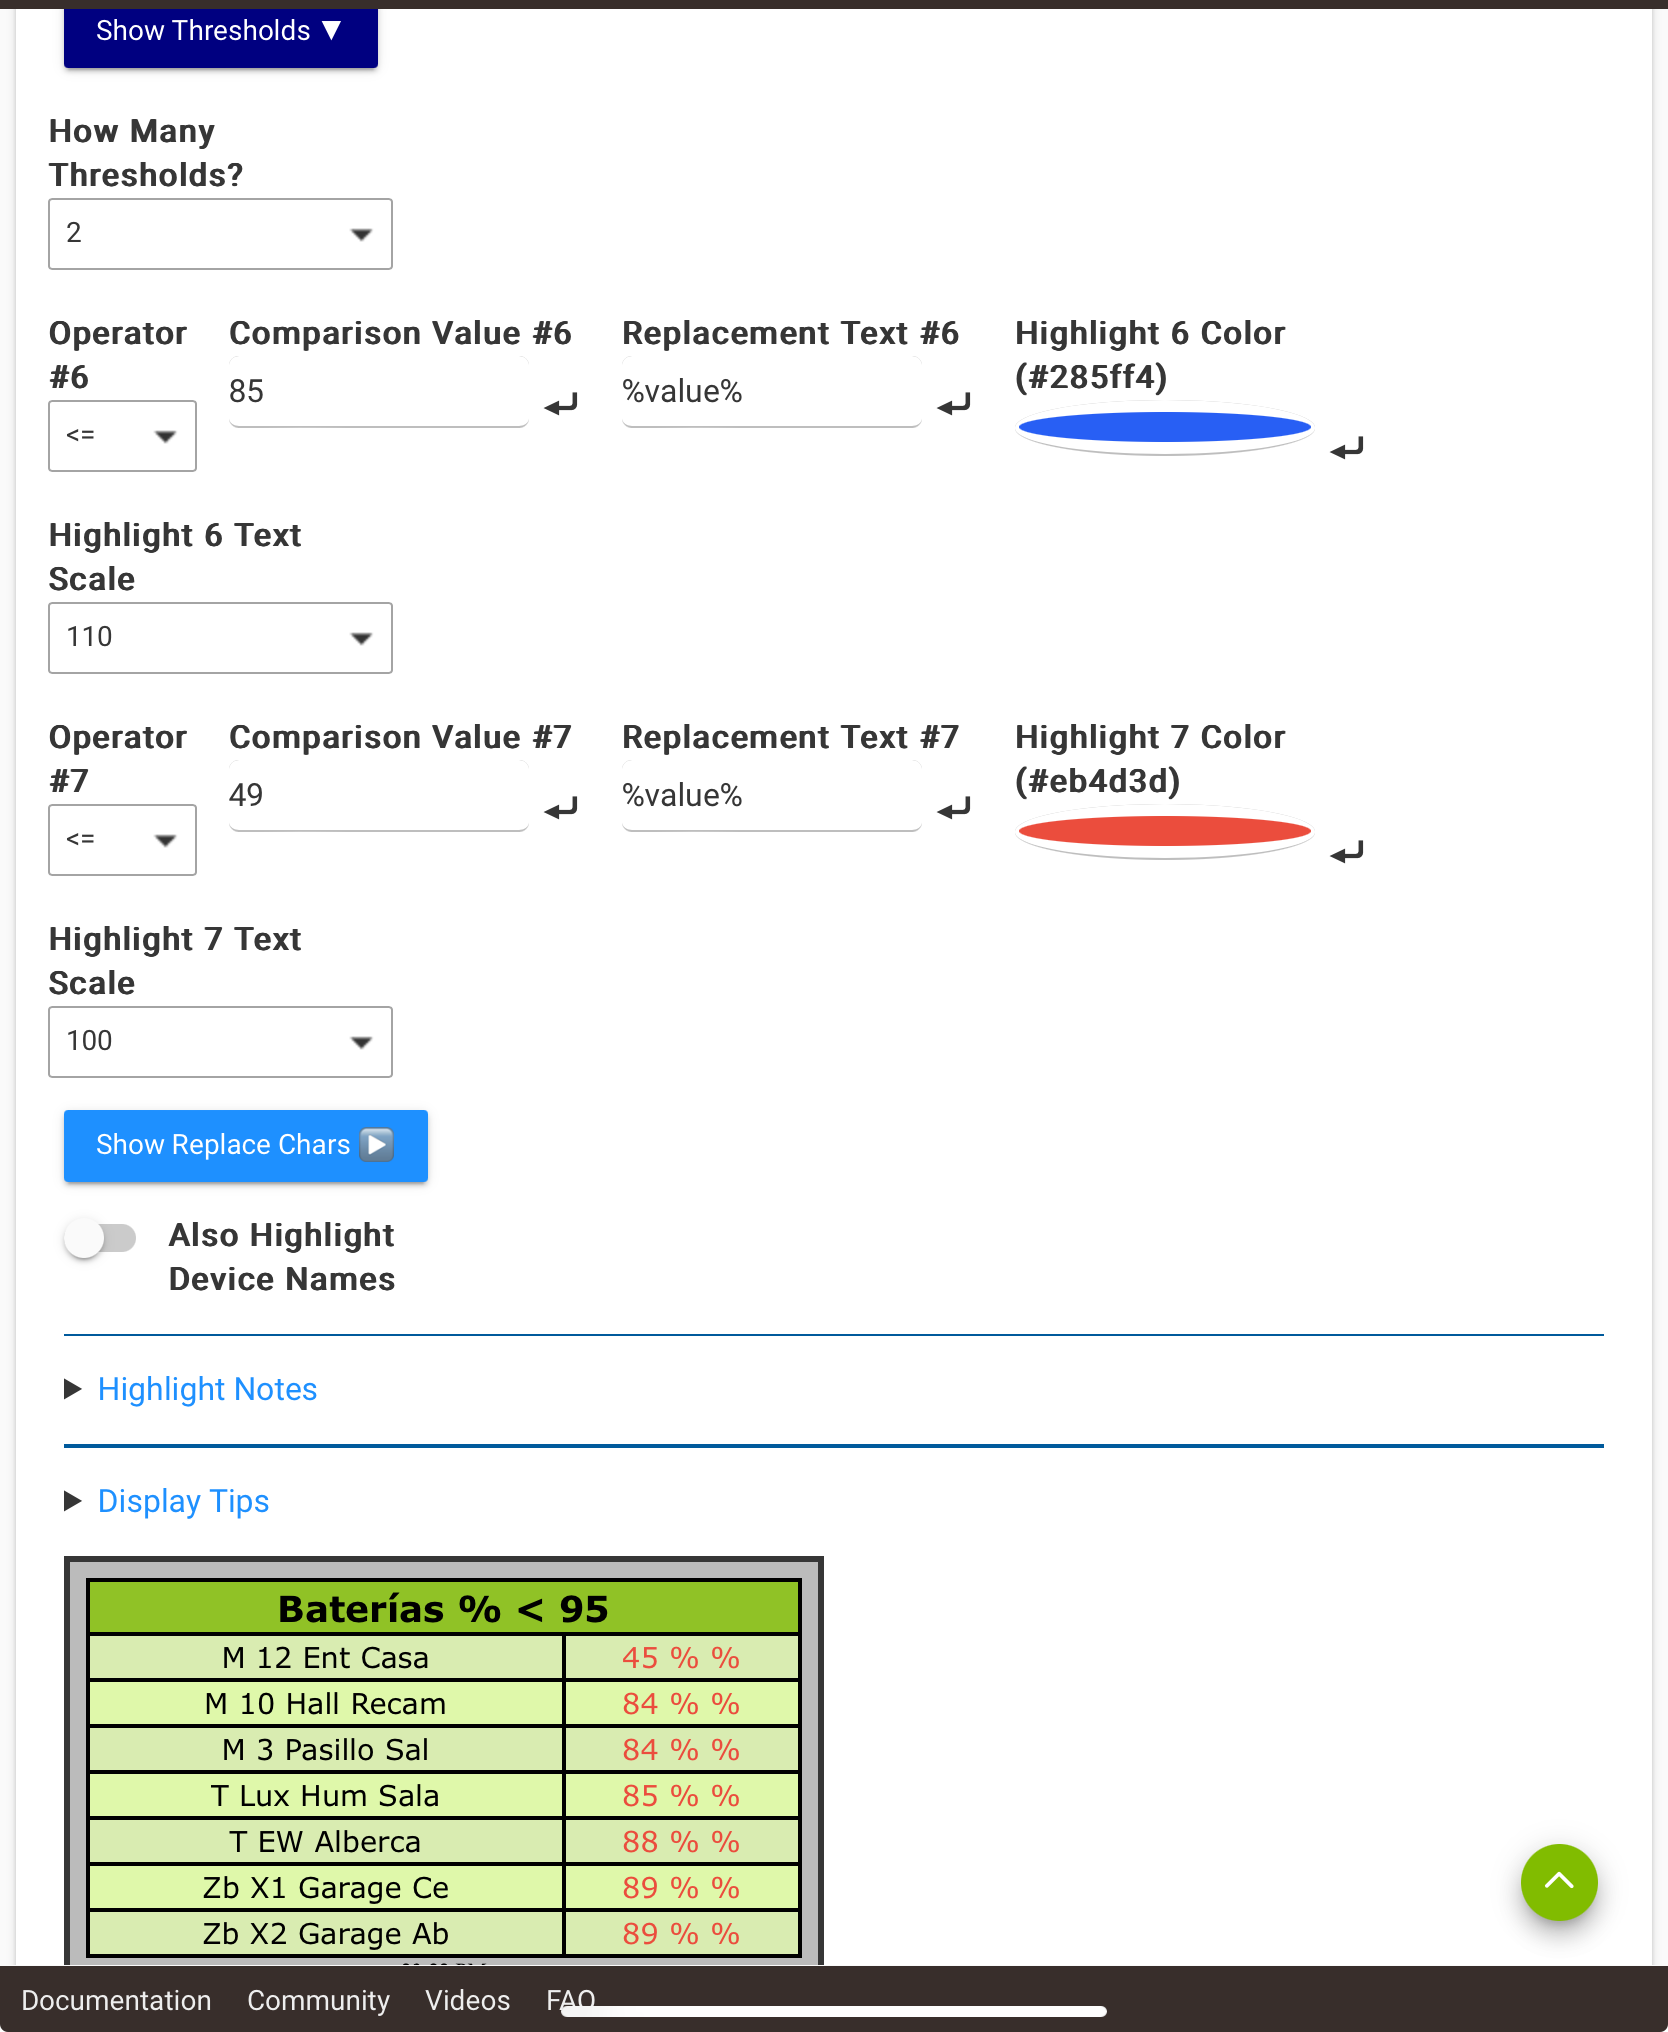
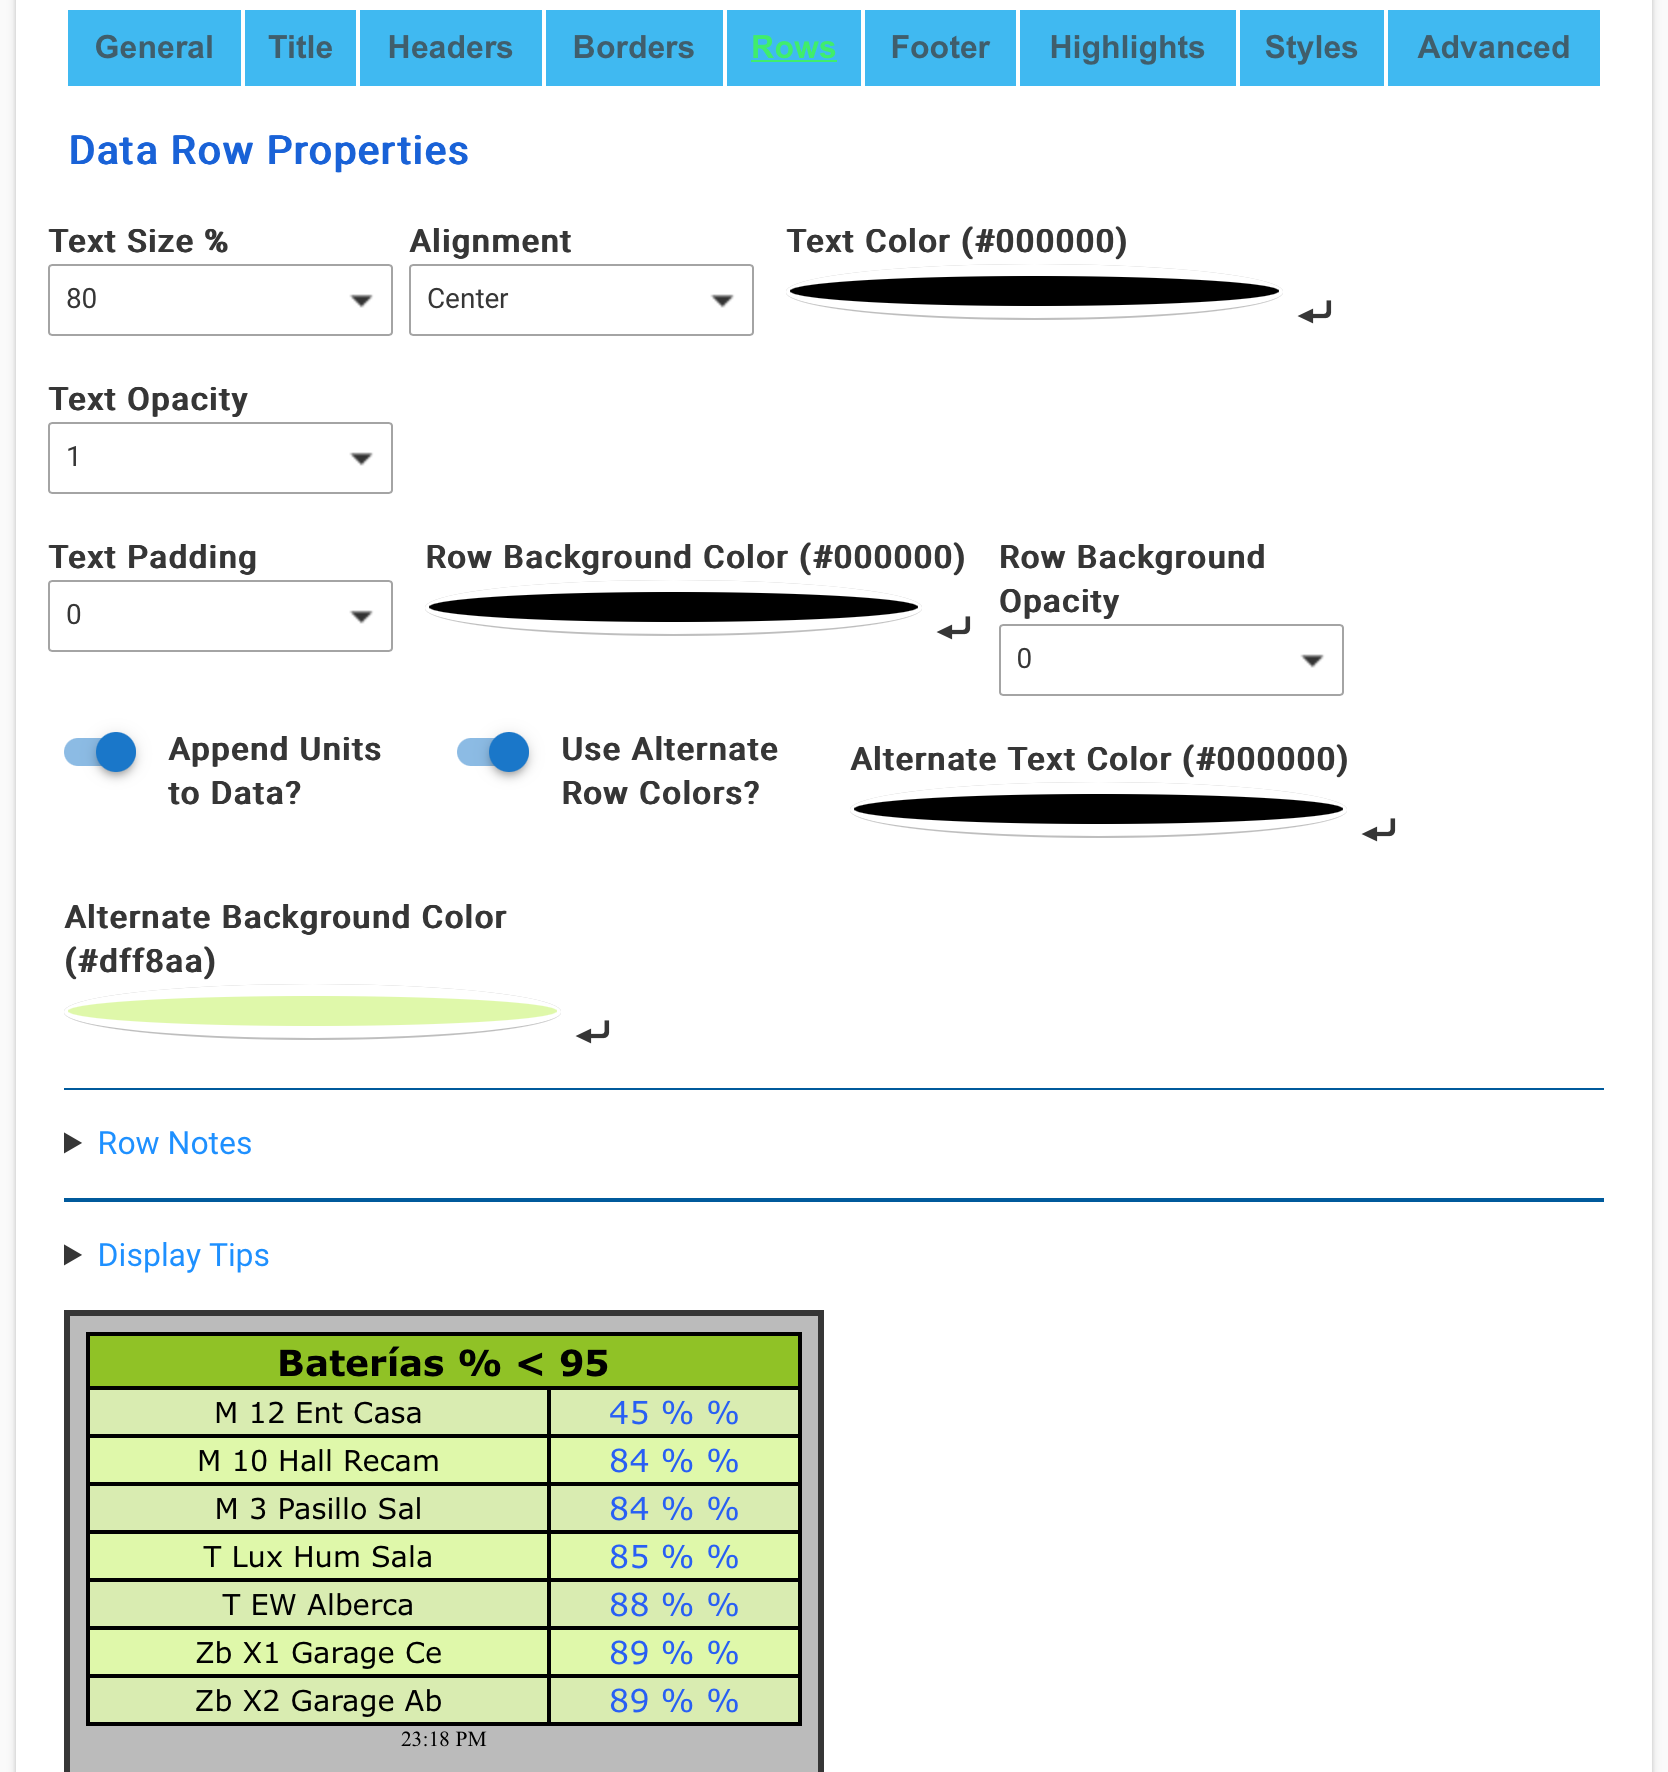
Rodolfo, I have been able to duplicate your results. The 1.4.4 update on 1/2/2024 was supposed to handle any float values that come back as Null. It does that, but the syntax was not quite correct and it seemed to mishandle non float values. The duplicate units and failure to color code are a secondary effect.
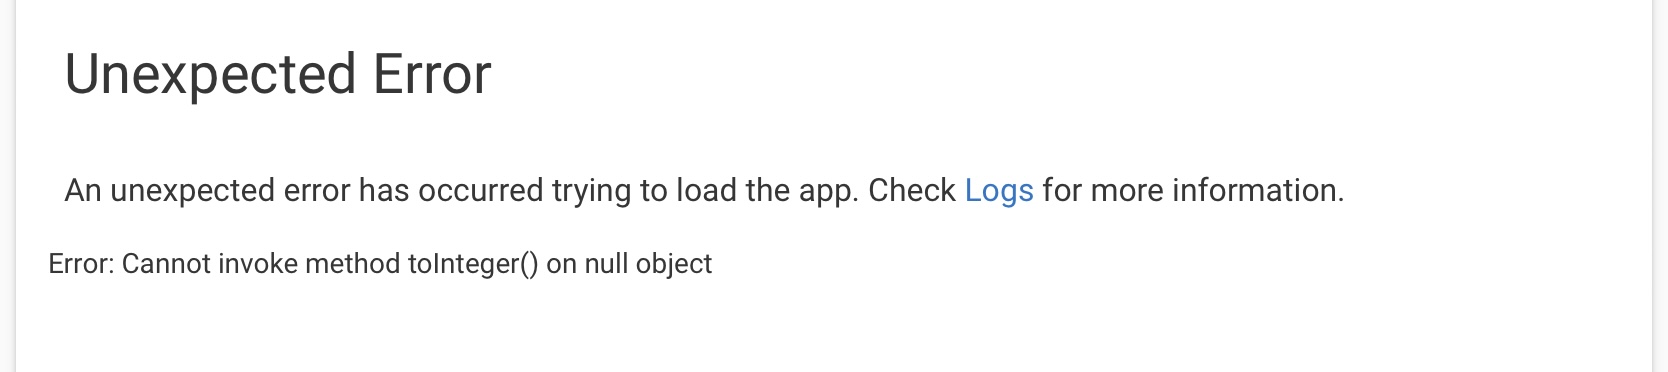
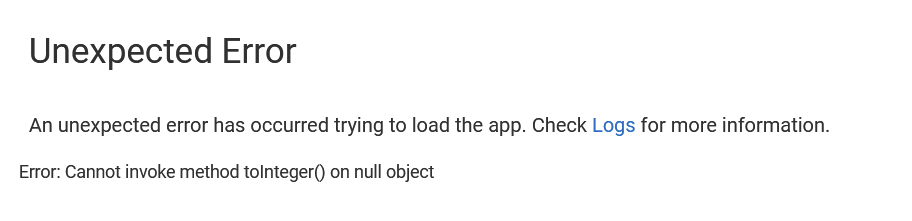
The "Unexpected Error" required some additional null handling. For some reason Hubitat have elected to make it possible to have a "No Selection" option that can't be removed and returns a null value when selected. I've fixed this too.
I need to do some more testing and tomorrow I'm going out of town for the weekend. I'll do my best to get it done tonight, but I can't promise anything.
Sorry for the inconvenience and thank you for your patience. With the new code it should just start working again without any need for intervention.
Oops. Created and edited a grid, in Free Form (probably not what I wanted). Then I set the Variable count to no selection. Error and orphaned grid tile, that I can't delete. Can't open it to delete it. Never got down to Publish section to assign tile and name. Recovery suggestions?
Log msg...
Sorry about that Bill, not your fault. A selection of "No Selection" returns a null to the program. I try and catch all those and handle them but obviously I missed this one. I'll get it fixed but not until Monday as I am going out of town for the weekend.
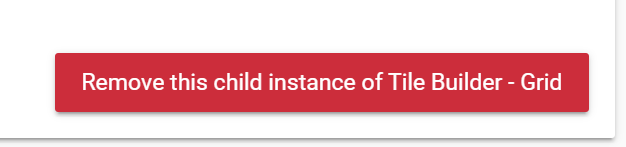
You can get rid of the tile in this state by clicking on the gear in the upper right hand corner
then scrolling all the way to the bottom.
If you have work invested in that it will recover with the next update but it sounds like deleting is what you want.
In attribute monitor the attribute list is limited to the well known capabilities\attributes and that attribute is used to filter a list of devices that share that attribute. temperature1 of course is not a standard attribute so it does not appear in that list.
If you use Multi-Attribute Monitor it expects a mish-mash of devices and allows you to specify any attribute of any device. Once you select a device it queries that device for a list of its specific attributes and all of them are displayed regardless of how common or oddball they are.
Multi Attribute Monitor can do most of what Attribute Monitor can do but because it expects a variety of attributes to be selected it does not offer sorting or filtering of attributes. But I expect it will do what you want it to do. Grid also does this but with multi-columns but that is only available for Advanced users.
FYI, a slightly annoying issue in Firefox. Had trouble with a grid tile getting truncated. Searched through the tile config to be sure I hadn't caused it. Deleted, rebuilt, etc. Then noticed it was scrolled in the tile, even though there was enough room to display all of the rows...
Then I checked on Chrome and in the phone app, all was OK...
Obviously Firefox is not up to snuff on HTML formatting. Wasn't surprised Firefox seems to lag somewhat.
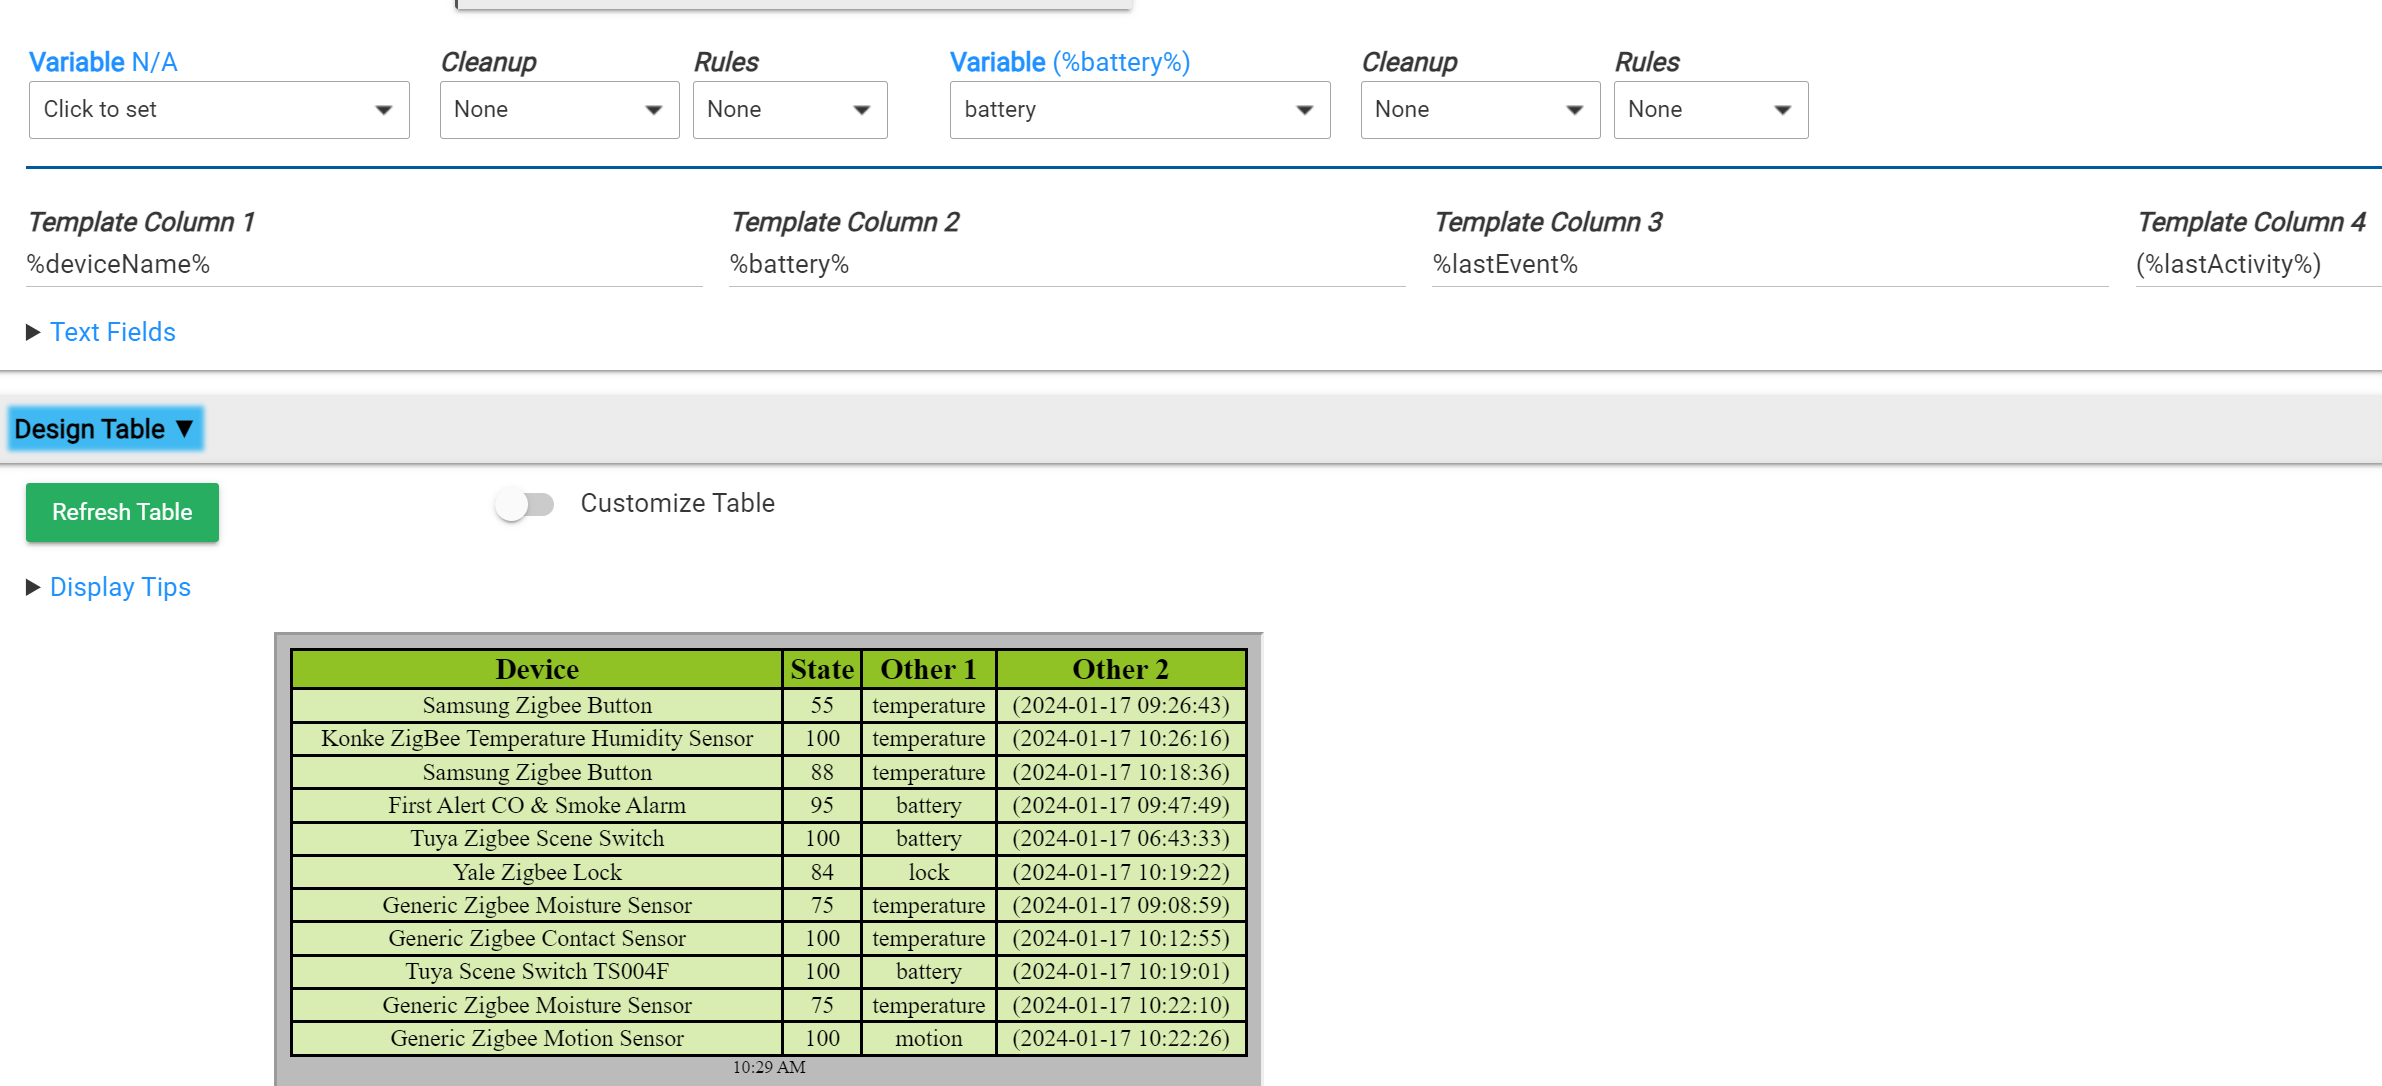
Is there a way to essentially combine those two into one tile just using Grid?
Where it has columns for:
Device | Battery Level | Last Activity (hh:mm)
then shows both low battery and inactive devices?
I can sorta create what I’m wanting but using “lastActivity” shows the full date and time and I couldn’t figure out how to get sort and filters working the way I wanted in Grid.
If it’s not really possible, could you share how you got the two separate tiles into one Grid tile?
I think it would be a good example for the docs, I didn’t see it, but honestly didn’t look too hard.
Hello, is there a way to show if a value is increasing or decreasing? Like an arrow up or down or just change value colors red or blue. My main usage will be in grid but could be useful everywhere
Grid does not have filtering or sorting (only default sorted by device Name). But if that is not a concern you can do this. You have to set the Gather Event Info to True for %lastEvent% and %lastActivity% to info to be available.
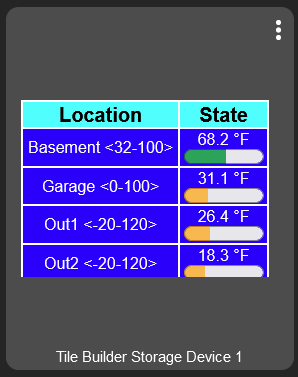
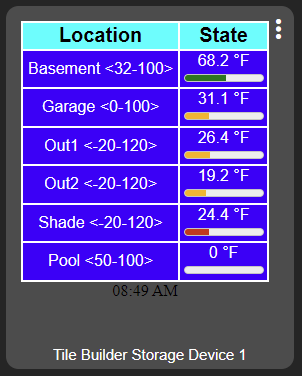
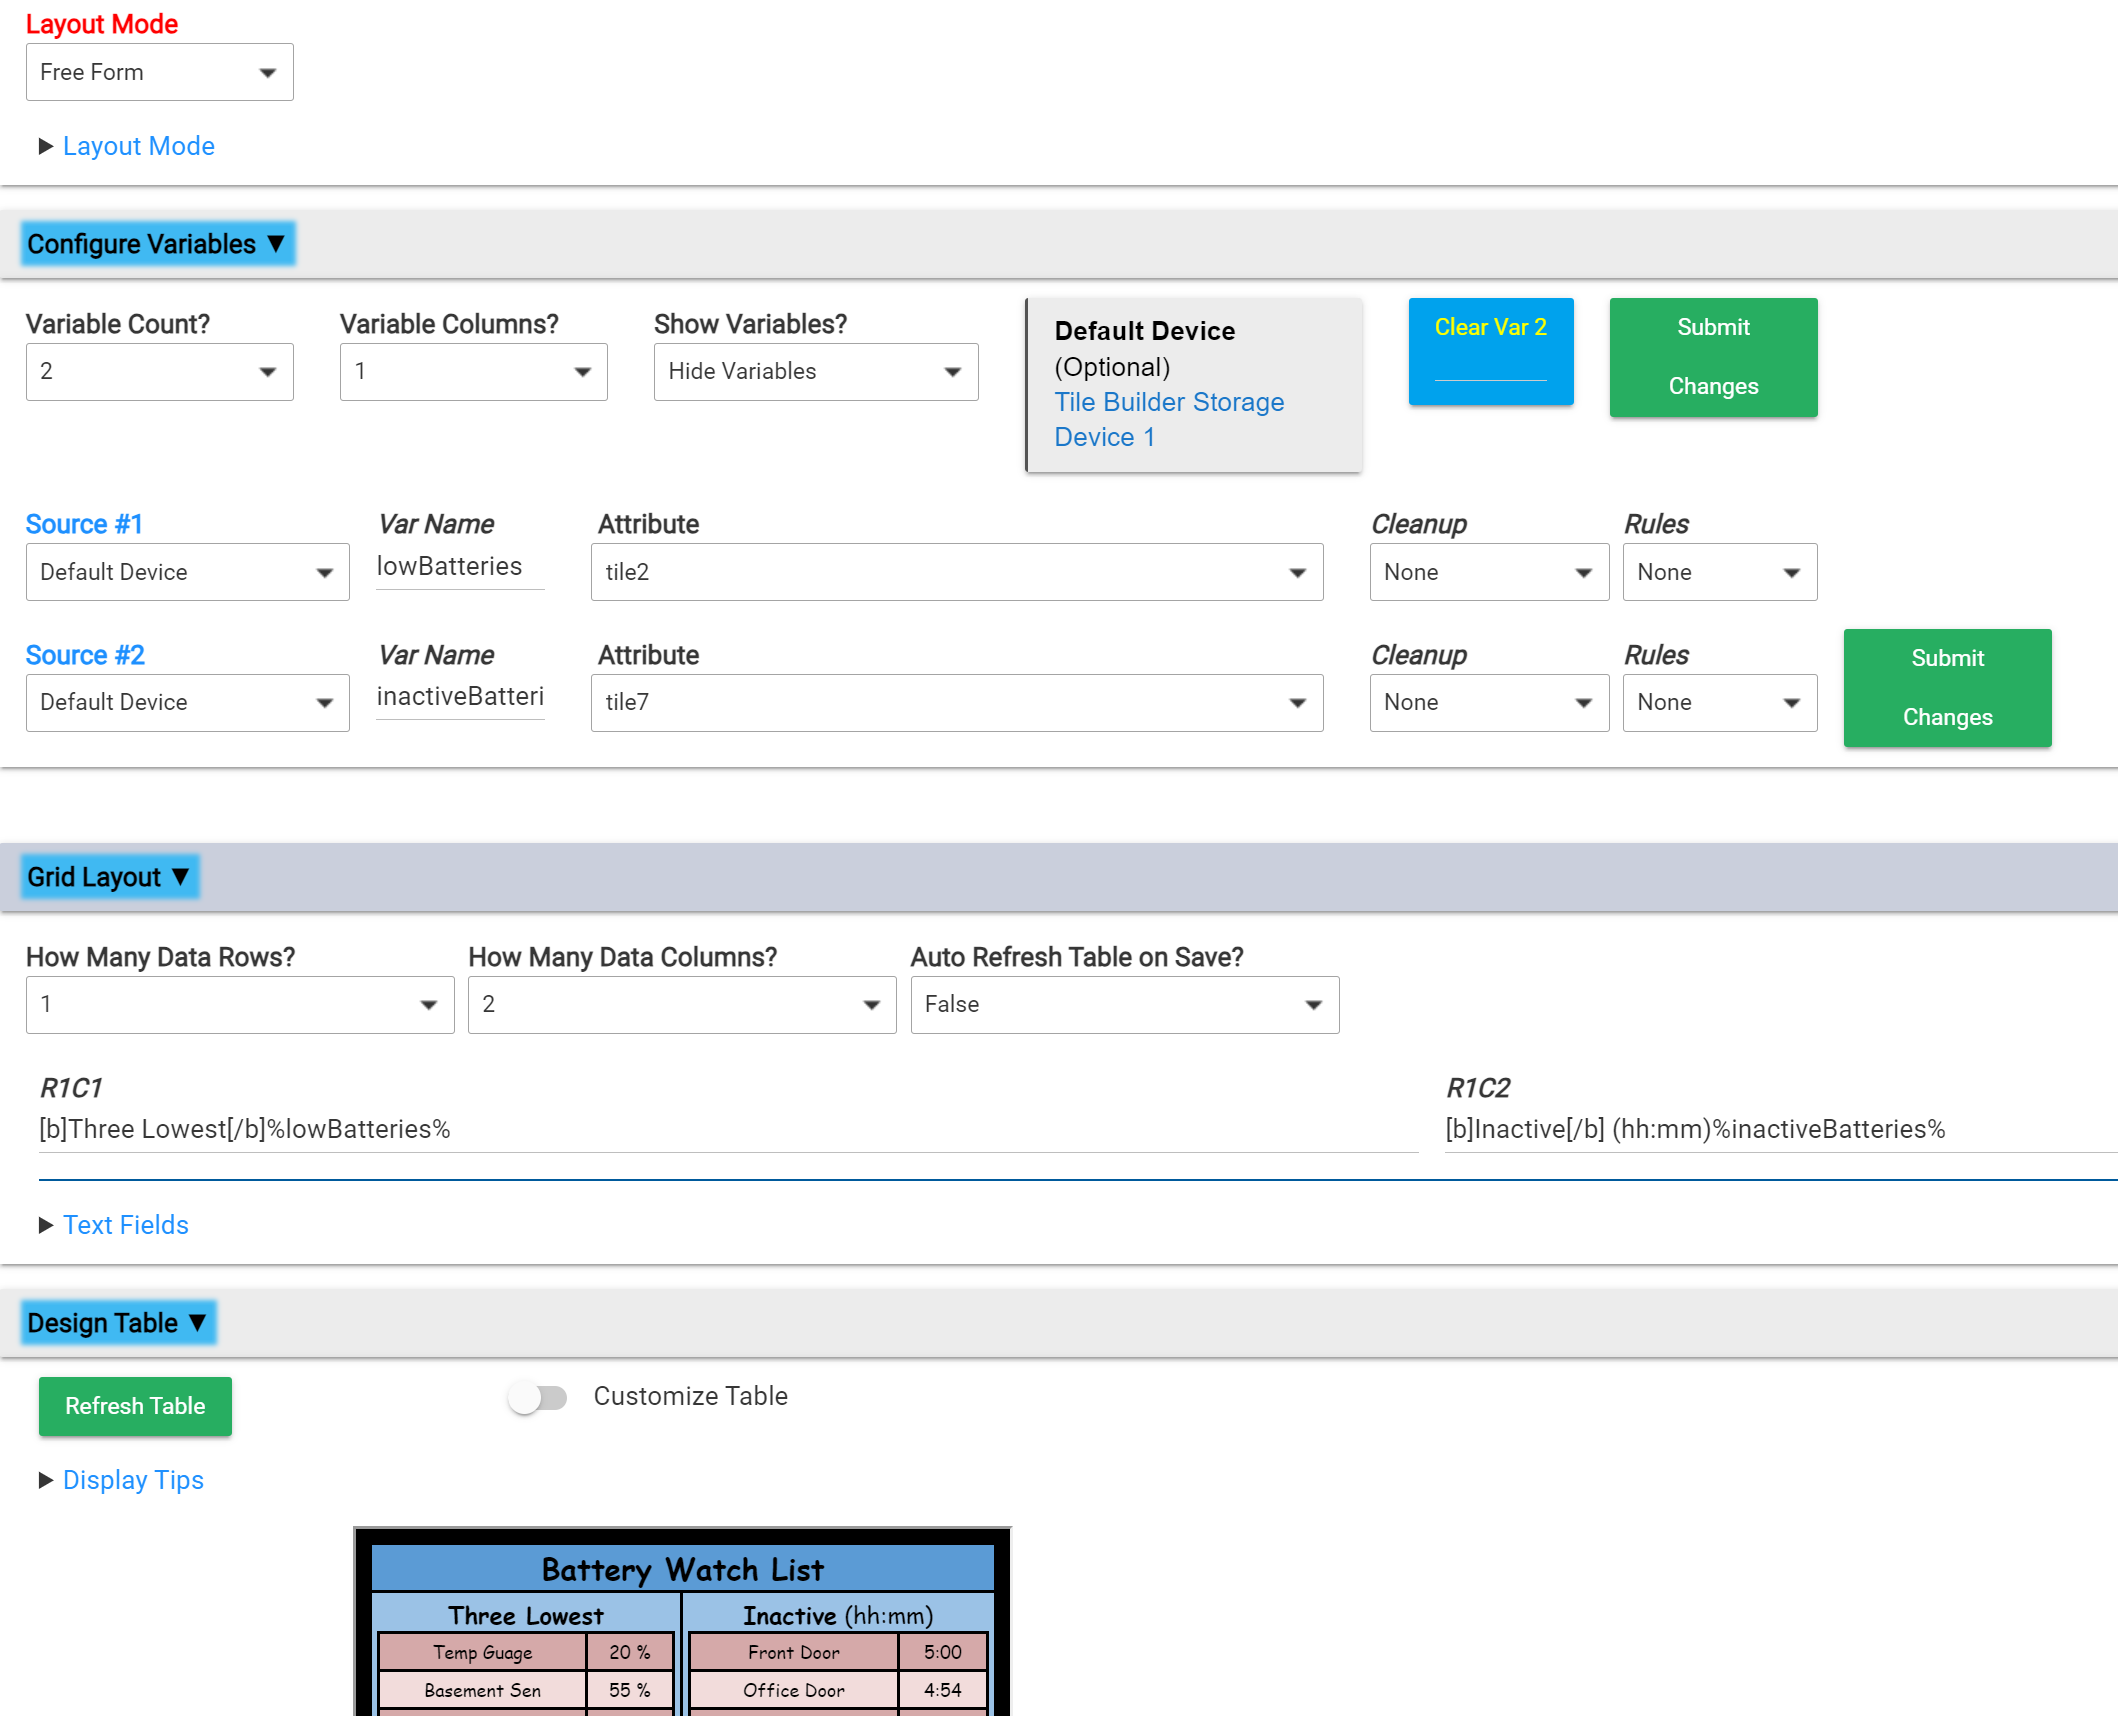
The method I chose was to create two small tables (the inner tables) using Attribute Monitor and Activity Monitor. Then I created a Grid with 1 data row and 2 columns. Then I point those to the Tile Builder Storage Device attribute that contains the inner tables.
When either of the 2 child tables gets updated the Grid will also be updated.
Not shown here but when using nested tables make sure the child tables are not refreshing too frequently or it can bump up your CPU usage.
P.S. I do plan on adding some Date\Time cleanups for reformatting. I am also considering adding lastActivity as an attribute so it would have access to this cleanup method. I'm going to be gone for a month so I don't expect to get to these until March or so.
I have considered that but there are multiple obstacles.
The existing value that Tile Builder knows about may be rounded so I'd have to go back and get the prior value to the the comparison with. That's an extra round trip.
How long would a value be at a number before it was considered stable (no arrow). If everything has a directional arrow it's going to lose it's meaning.
What level of change would generate an arrow. If a temp goes from 68.71 to 68.73 do you really want an arrow in that case. Probably not.
Some devices report frequently and others report infrequently so the meaning is somewhat inconsistent in terms of its duration.
There are a few other smaller reasons but those are the factors I considered. Maybe sometime but it's not on my roadmap at present.
I’ve got that working fine, but the full date and time takes up a lot of horizontal space so I was looking for the hh:mm like in Activity Monitor. That or use the healthStatus.
I’ll play around with the two tile method in Grid for the meantime.
Yes they do. In Activity Monitor it's an elapsed time calculation so obviously shorter. Once I add lastActivity to the list of attributes you will have more options when combined with cleanups.