UPDATED - Nov 2021
I found the forecast.solar API to be inaccurate, and as such I will not be doing any more work on that driver. I switched to the Solcast API. You can find the Solcast driver below.
6 Likes
It seems to be very usefull driver. However Im getting this error:
2022-03-16 13:14:58.915 errorgroovy.lang.MissingMethodException: No signature of method: com.hubitat.hub.executor.LogWrapper.deubg() is applicable for argument types: (java.lang.String) values: [[{"pv_estimate":0.1359,"pv_estimate10":0.0602,"pv_estimate90":0.2339,"period_end":"2022-03-16T12:30:00.0000000Z","period":"PT30M"}......
Continuing much further. Any hint how to fix this? API key as well site ID is inserter correctly, Im able to get response from http address that driver is requesting in logs (https://api.solcast.com.au/rooftop_sites/f8c5-XXXX-9667-XXXX/forecasts?format=json&api_key=JYUIXXXXXg1R0O5GXXXXX9279XXXXX5j) key and site ID changed to not expose it in public.
Looks like a Typo slipped in. It was only an issue when debug logging was enabled, but I have updated the driver. Should be fixed now.
2 Likes
Perfect, it works. Thank you. It will be used on freshly build solar battery management. If there will be enough power next day, I can discharge this add-on battery to use the production excess.
may I please have some help
I am getting this error messge
groovyx.net.http.HttpResponseException: status code: 404, reason phrase: Not Found on line 78 (method refresh)
thanks
I just tried it and substituted my api_key (from Solcast) and resource_id (location from Solcast) and it works.
I'm assuming you have done the following?
- Create a free account with Solcast
- Add your Site ID and API key to the virtual device
You may want to double check your api_key and site_id by logging into your account.
thanks. working now.
has mistaken the API key with API address
1 Like
This is great. I just signed up for Solcast and installed the driver. The estimates do seem fairly close to accurate.
One question though: On the driver screen I see these attributes:
- 24 Hour Peak Production : 12.866
- 48 Hour Peak Production : 12.866
- 1 Hour Estimate : 7499.3000
- 72 Hour Peak Production : 12.866
- one_hour_estimate : 7499.3000
- energy : 96.42745
- power : 96427.45000
- 48 Hour Estimate : 173.20130
- 72 Hour Estimate : 226.82175
So basically I see a 1 hour estimate, and then 48 hour estimate, and then 72 hour estimate. Is there a way to see a 24 hour estimate?
I do see a 24 hour "peak production" value, but not a 24 hour estimate.
I just thought I'd ask if II was missing something obvious before I started messing with the code.
Thanks,
-Jeremy
Power and Energy are the 24 hour estimates.
You have a much larger system than I do 
Thanks, that makes sense now.
My system is 17.36kW and I'm adding another 6kW (Along with a 15kWh battery built myself from raw cells) for my well house. Once that's done I'll be up to a little over 23 kW total. One of the things I'm trying to accomplish is having 100% of our water pumping (We have a well) handled via solar. So I want to use the solar forecast to drive whether or not the irrigation system runs. If the forecast says we'll have enough sun to pump that much water: Run the irrigation. Otherwise skip a day.
I was about to write my own driver for this and just happened to stumble onto this. This is great. Thanks
Thank you for creating this driver, I was going to write my own when I stumbled across it. ![]()
I’ve only got a little 5.4kW system split across to arrays - I assumed I needed to install 2 instance of the driver, each with their own resource code and then use RM or something to sum the data into a Hub variable?
I never even considered whether two instances would work, but I customized the code so that it pulls both my front and back arrays and reports the individual and total values all in one instance.
I could share, with the caveat that I was in no way trying to make my solution pretty or reusable for anyone else. I just hacked away at the code until it produced something I could use.
1 Like
Hey, can’t possibly be worse than the Amber electric driver I wrote using ChatGPT. ![]()
Btw, have you noticed that energy forecasts are more accurate first thing in the morning? Eg, Solarcast estimated that I'd get 10kWh's today early on, but by the end of the day it was claiming 17kWh's. I got 9.7kWh's for the day. ![]()
I only refresh the data once at 4am (when the sun isn't shining) to get a daily forecast, so I haven't noticed that.
What data field are you seeing that in? I only see fields that report the next hour, the next 24 hours, and the next 48 hours, but no field for 'today'. They're all rolling periods starting at the time of the API call.
If you see 10 kWh in the morning and 17 kWh later in the day, it means tomorrow morning is going to be higher production than this morning was. Conversely if you see 10 kWh in the morning and 7 kWh later in the day, maybe it's going to be cloud or rain tomorrow morning.
In any case, I've uploaded my code to Github here: https://raw.githubusercontent.com/youzer-name/Solcast_dual/main/solcast.groovy
The readme is here: Solcast_dual/README.md at main · youzer-name/Solcast_dual · GitHub
If you find any issues please let me know. There are a few debug log lines that were in the original that I've commented out, but I don't remember why, If you need to debug and don't see all the logs you need, you might want to uncomment those lines.
EDIT: I just realized the 'peak' numbers for my driver are not accurate. It's simply a total of the two peak values, but since those may occur at different times (my arrays face NE and SW), that doesn't represent an actual peak value at any given time of day. I really only use the 24 hour totals anyway, and bring them in to my Powerall Dashboard so I can compare production to forecast like this:
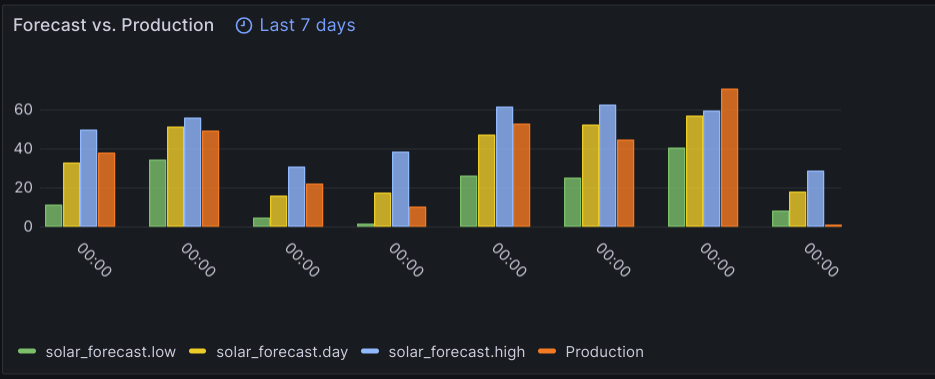
and show today and tomorrow's forecast like this:
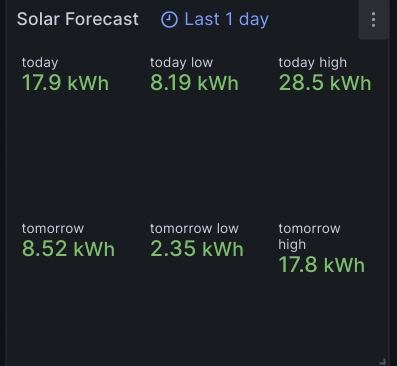
I have to tweak the efficiency factor on Solcast a few times a year to keep the forecasts in line with reality since I have shading that gets much worse in the winter.
1 Like
It was both the energy and power fields, and they kind of crept up gradually through the day. Although there was a big jump around midday from about 12 to 17, so maybe that was looking to tomorrow.
I’ve since changed to to run daily which the code suggests is 7:51am every day.
My code will run at 04:07:51. The original had a similarly specific time coded into it, and I think I just changed the hour.
Also, I was editing my previous post as you were replying, so scroll up if you didn't see the last part after "EDIT:"
You could find the earliest sunrise of the year in your location and change the code to use something a little before that as the daily run time.
1 Like
Cheers, I’ll take a look later today when I have some time.
I just gave it a go and it works great, nice work!
My only suggestion is to add rounding to 2 decimal places to the numbers to improve legibility.
For my Amber driver, I added it to the data processing section like this:
void processCurrentIntervalResponse(data) {
    if (data instanceof List && !data.isEmpty()) {
        def currentIntervalData = data[0]
        BigDecimal roundedPerKwh = currentIntervalData.perKwh?.setScale(2, BigDecimal.ROUND_HALF_UP)
        BigDecimal roundedRenewables = currentIntervalData.renewables?.setScale(2, BigDecimal.ROUND_HALF_UP)
        BigDecimal roundedSpotPerKwh = currentIntervalData.spotPerKwh?.setScale(2, BigDecimal.ROUND_HALF_UP)
        sendEvent(name: "currentIntervalPerKwh", value: roundedPerKwh)
        sendEvent(name: "currentIntervalRenewables", value: roundedRenewables)
        sendEvent(name: "currentIntervalSpotPerKwh", value: roundedSpotPerKwh)
        sendEvent(name: "currentIntervalChannelType", value: currentIntervalData.channelType)
        sendEvent(name: "currentIntervalSpikeStatus", value: currentIntervalData.spikeStatus)
        sendEvent(name: "currentIntervalDescriptor", value: currentIntervalData.descriptor)
        sendEvent(name: "currentIntervalEstimate", value: currentIntervalData.estimate)
    } else {
        log.warn "No current interval data found in the response."
    }
}
If you are interested and I get time, I’ll cook up a HTML dashboard tile with some of the information on it.
1 Like


