Thanks @Alan_F just setup this driver. Would be nice to have an html tile to show forcast for today (low, day, high) same for tomorrow and the next day.
What did you use for your graphs?
Thanks @Alan_F just setup this driver. Would be nice to have an html tile to show forcast for today (low, day, high) same for tomorrow and the next day.
What did you use for your graphs?
The graphs above are from Grafana.
I use Node Red to listen to the log socket on the Hubitat and write the data to MariaDB and InfluxDB databases (MariaDB for the general log entries, InfluxDB for time-series data like device states and this solar forecast data). Grafana can display the data from those databases. All of these run in Docker containers on a Raspberry Pi.
I'm working on this, but I just hit the daily API call limit while testing. Once I get a chance to run a few more tests I'll update the code on Github.
I'm also going to comment out the calculations for 24, 48, and 72 hour peak production since this discussion made me realize that the peaks for two separate arrays don't occur at the same time and adding the numbers together isn't accurate.
I don't really use the Hubitat dashboards to display info like this, but it sounds like @greglsh would be interested if you get the time.
No worries, I’ll knock it up tomorrow and send you the code.
I’m too lazy to use grafana, I do know how to, but one day I might find the motivation.
Good idea, I’d like to see those for each array too.
I already have it running for my Powerwall Dashboard (GitHub - jasonacox/Powerwall-Dashboard: Grafana Monitoring Dashboard for Tesla Solar and Powerwall Systems) and I've found it useful for a lot of other things.
The individual values for each array were reported in 'state variables', but not all of them were being sent to "Current States". I'm going to update the driver so everything is sent to Current States rather than "State Variables" so you can reference the values from Rule Machine if needed.
Nice! I’m going to install it on my server today, the graphing and energy dashboard are the only thing I miss after deleting my Home Assistant vm for the umpteenth time. ![]()
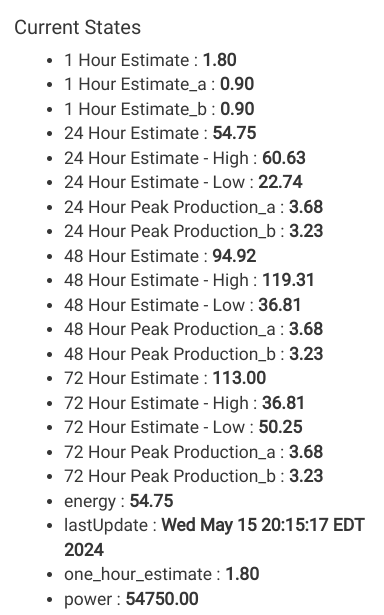
It's Thursday in GMT (and Australia) so my daily API limit has reset and I was able to test the updated code with the rounding, and this is what it currently produces:
(ignore the issue with the 72 hour - high estimate not making sense... I fixed that typo already but don't want to burn another API call to get another screenshot)
Before I upload this to Github, what do you think of deleting the energy and power readings (and the energy meter / power meter capability for the device). I just carried them over from the original driver, but I have no use for them and I'm not sure what the original logic was for having the 24 hour estimate be set as energy and 1000x the 24 hour estimate be set as power. If you don't have a use case for them I'm going to delete them from my version.
I also just noticed, because I'm running this just before dark (rather than in total darkness before sunrise like usual) that the 1 Hour Estimates also have a 1000x multiplier on them. I'm not sure why. There is no way my panels would produce 1.8 kWh in the next hour. It's raining and almost completely dark. The raw data says a more believable .0009 kWh each, so I'm going to drop the 1000x on those estimates.
I'm in Melbourne. ![]()
I use the combined "Energy" estimation, as it's quite useful to know in advance if I'll have a decent amount of power to run the house and charge the battery. (My system has only 5.4kW of panels + 5kW inverter).
The "Power" number is in Watt Hours, and personally I prefer Kilowatt Hours to read - I can see the Power number being useful in some calculations tho, so I would keep it.
Ok, keeping them in there if you find them useful.
You'll want to set the device to use the "device" driver and then use the buttons to delete all Current States and all State Variables to clean it up, then switch it back to the 'Solcast_dual" driver.
The odds that I introduced some new error while editing are > 0 ![]()
Works great! I've created a basic Dashboard tile, cant ran out of API calls before I finished testing. ![]()
It's basic, so it should work:
Just add this to the attributes section:
attribute "htmlToday", "string"
this to the end of your Data processing logic
    // Create Dashboard tiles
    PowerTile()
and this wherever it suits you (I cant test the logging atm):
// HTML Solar Dashboard Tiles Logic
def PowerTile() {
	if(txtEnable == true){log.debug "update htmlToday called"}		// log the data returned by WU//
	htmlToday ="<div style='line-height:1.0; font-size:0.75em;'><br>Total Est: ${device.currentValue('energy')} kWh<br></div>"
	htmlToday +="<div style='line-height:50%;'><br></div>"
	htmlToday +="<div style='line-height:1.0; font-size:0.75em;'><br>Peak A: ${device.currentValue('24 Hour Peak Production_a')} kW<br></div>"
	htmlToday +="<div style='line-height:1.0; font-size:0.75em;'><br>Peak B: ${device.currentValue('24 Hour Peak Production_b')} kW<br></div>"
    sendEvent(name: "htmlToday", value: htmlToday)
    if(logEnable) {log.info "htmlToday contains ${htmlToday}"}
	}
EDIT: fixed some bugs (I just made a command to run the HTML portion so I could test without hitting the API.
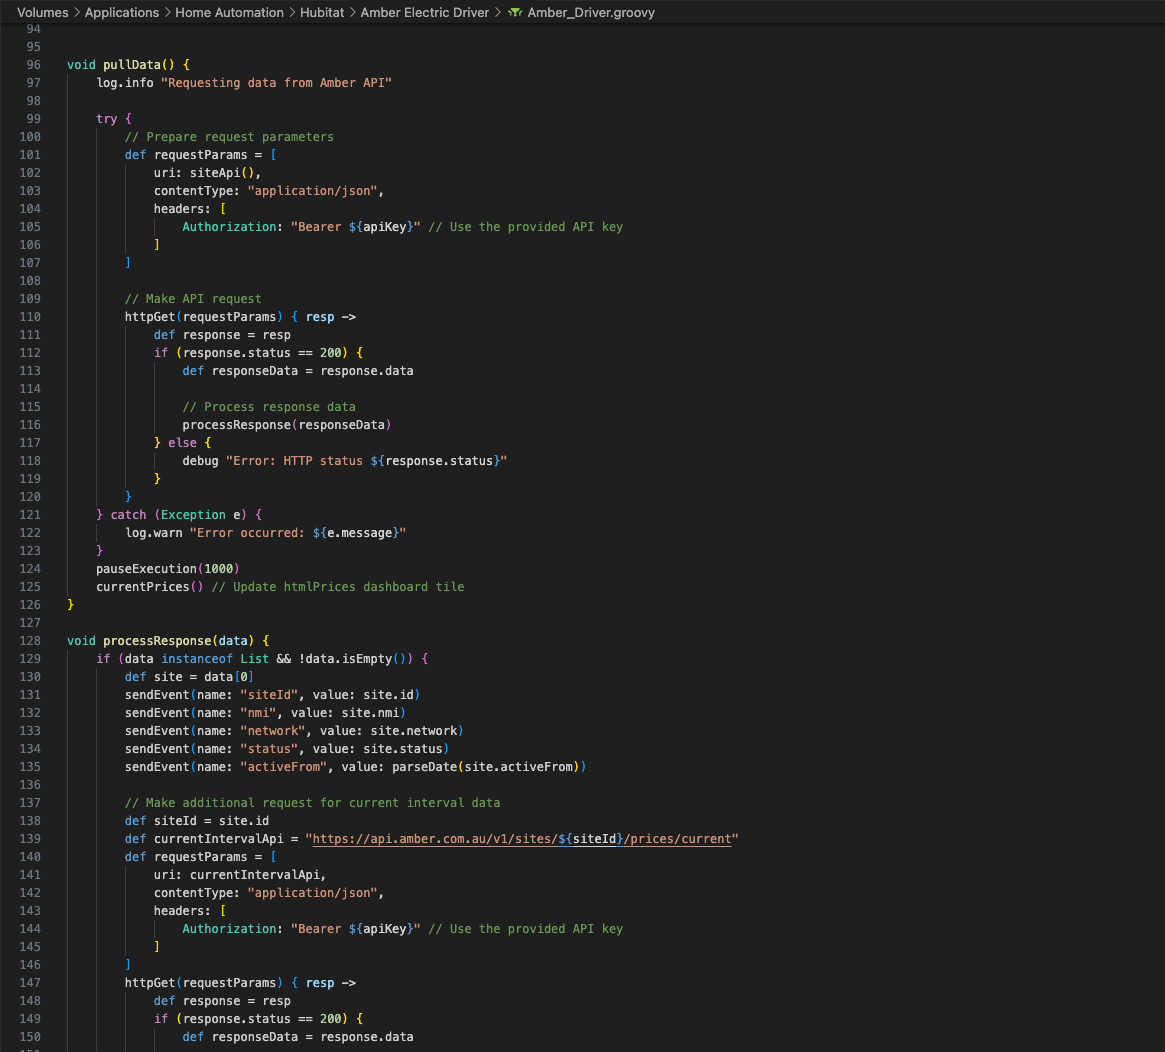
Btw, because this a rate limited API, there's a trick I found useful making the Amber integration, and that is break up your API call and data processing. eg:
then you can just add temporary commands to test on the data you already have, eg
command "processResponse"
you can remove them later, or just comment them out prior to a release:
// command "processResponse"
I didnt do this with my Amber driver as I was being lazy, but you can also add a built-in clear state function too:
command "clearState", [[name:"Use Only 1 time to Clear State Variables no Longer Used"]]
void clearState() {
    state.clear()
}
and you can even add a call to that function before polling the API if you want to ensure a clean data pull:
clearState()
I will try to incorporate all of that tomorrow. I'll probably call it "html24hour" instead of 'today' since the values it are displaying are based on the next 24 hour's forecast and only represent today when this is run once a day before sunrise.
Sounds good. ![]()
I reached out to SolCast asking if we could get access to more API calls while working on our free Hubitat integration, and they gave us access to a 50 call per day test API for the next week.
I’ve PM’d you the details. ![]()
I tested using sendEvent followed by a reference to "device.currentValue" in a test driver and the problem I encountered is that unless I pause execution between the two commands, device.currentValue is not showing the value that was just set by the sendEvent.
Even when I tried to use the skipCache flag ( device.currentValue('attributeName", true) ) it wasn't getting the current value. I don't like the idea of pausing execution to wait for the values to update, so instead I created variables for each value and then used the variables in the setup of the html tile, avoiding use of "device.currentValue" anywhere.
I added an input toggle to select whether you want the html tile to be created. It will only log the html tile content if debug logging is selected, rather than just info logging as in your example.
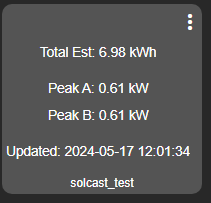
I also added the last update time to the tile (in local time), so you can see what 24 hour period it is showing.
I still don't see the point of keeping the energy and power values, but I've left them in there for now. The energy value is always identical to the 24 Hour Estimate. Anywhere you refer to the energy you could just use the 24 Hour Estimate. The power value is always 1000x that value, but power should be expressed in watts or kW, not watt hours or kWh. It makes no sense that the 'power' being reported by this device is the 24 hour production in watt-hours.
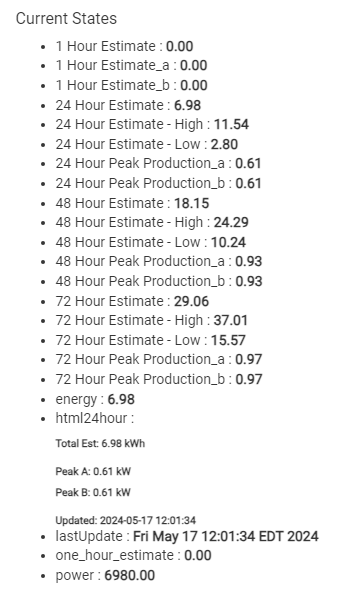
I found another cut/paste error that had the wrong value for the 72 hour high estimate, and I changed the version for the latest update to the forked app to 1.0.1.
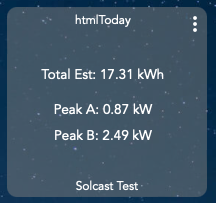
The states from the device now look like this: (the a and b numbers are the same because I used the test API you provided and set the same resource ID for both a and b)
The HTML tile looks like this:
I’ve seen this issue with Weather Underground too, you can just add a 1 second delay in front of the code blocks that need it.
Good point, I haven’t really had a good play with the code to see what is derived from what.
Btw, can you please add
capability "Actuator"
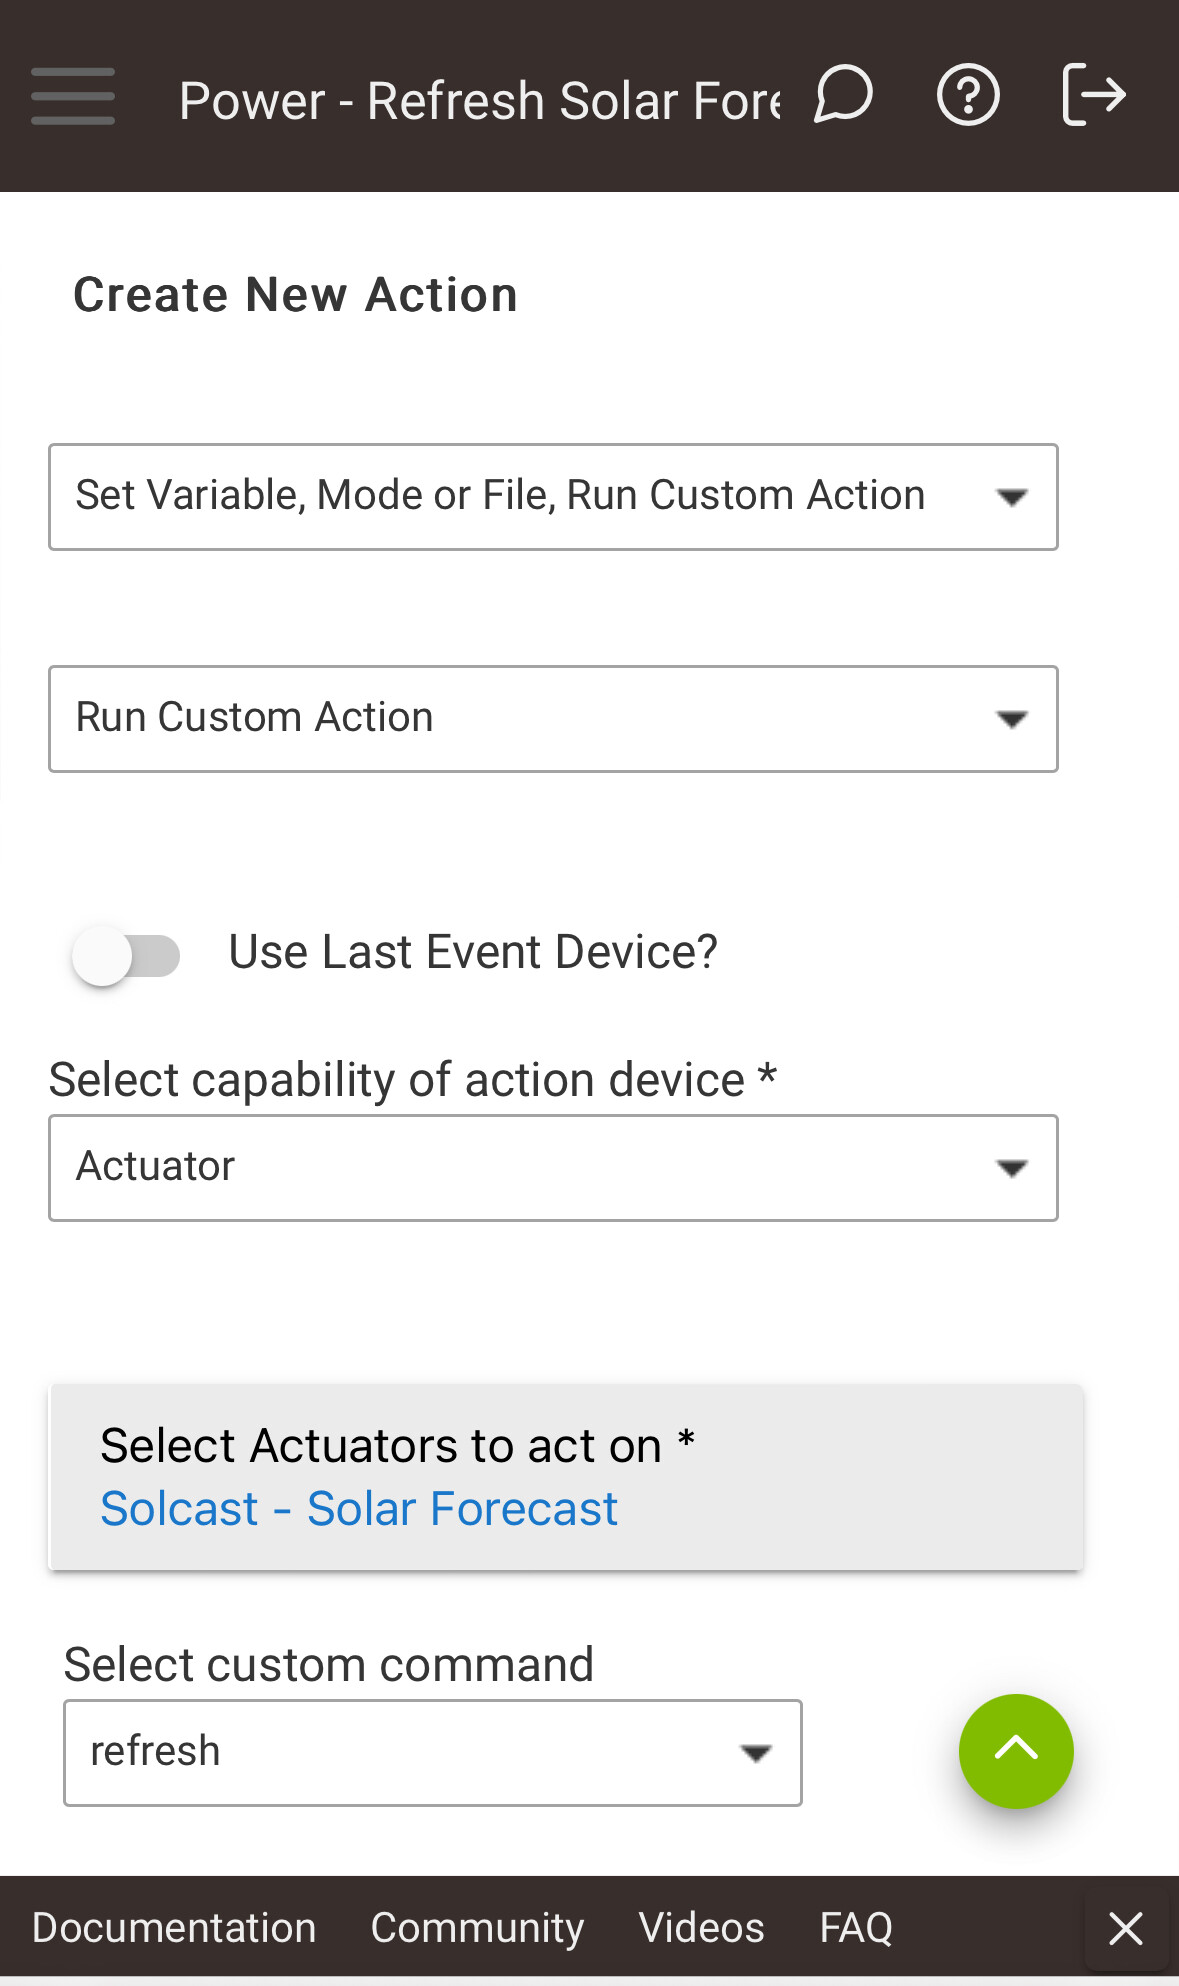
To the driver? This allows folk to create their own custom run time using rule machine. Eg say I want it to run everyday, but at 9am (this seems to produce more accurate data for me).
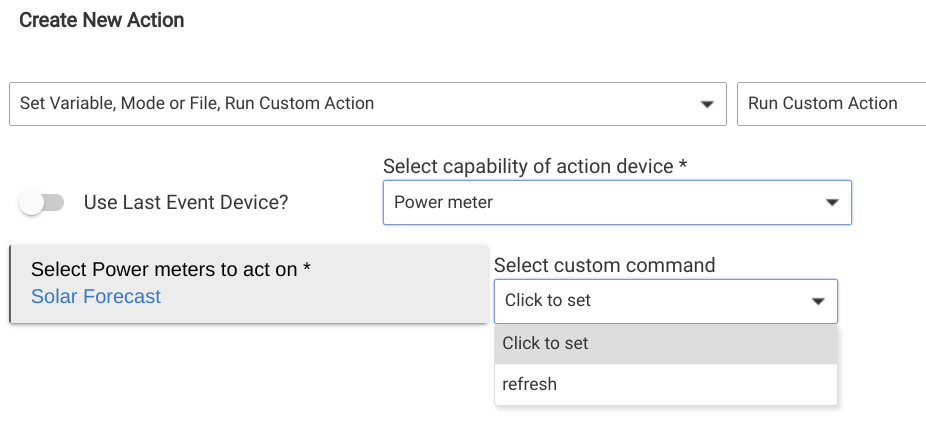
I could add actuator, but it isn't needed. You can select 'power meter' in the 'Select capability of action device' box and the solar forecast will be listed in the 'Select ... to act on' box.
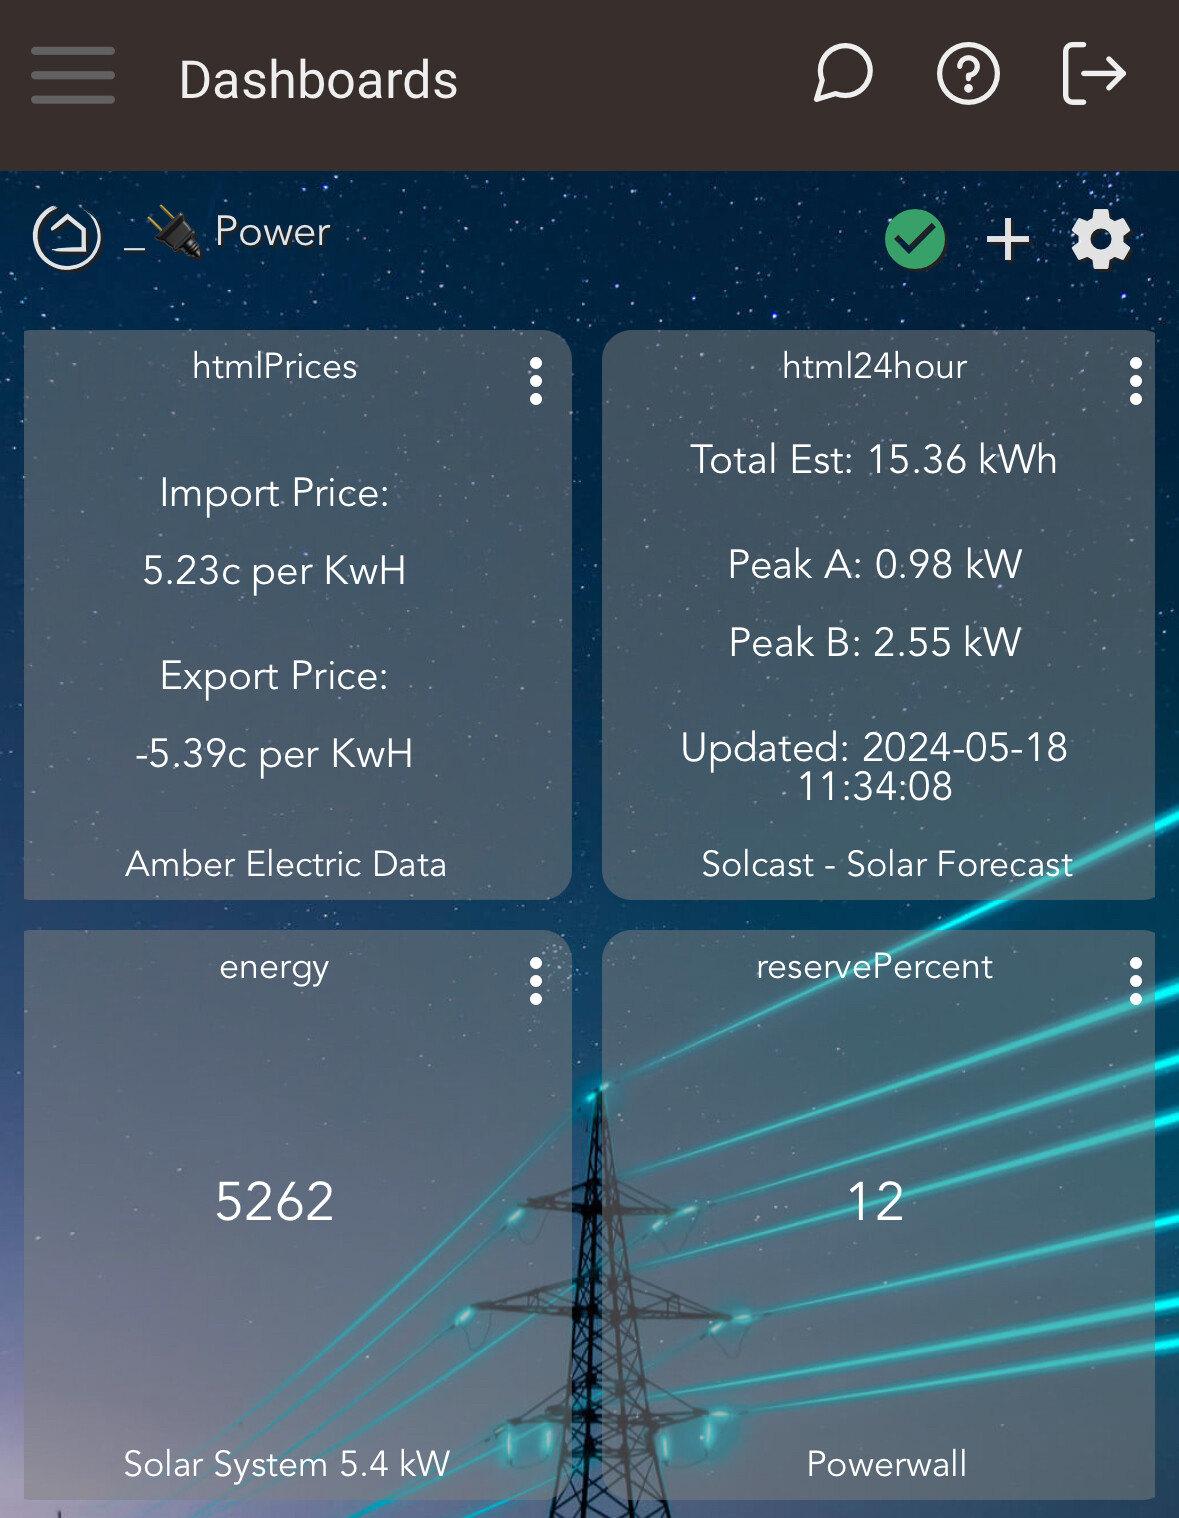
p.s. - something seems to be wrong with your tile... it's saying it's already tomorrow, when I just checked and it's still today... ![]()
Well you learn something new every day! ![]()
I’m not following you? It’s the 18th of May according to every clock I own.
Download the Hubitat app