That got me thinking....
New beta...
0.1.4 - 07/25/22 - New Options - User selected X-Axis label device, Map order selection
That got me thinking....
New beta...
0.1.4 - 07/25/22 - New Options - User selected X-Axis label device, Map order selection
And I could not find any settings relating to this in the app settings page
Still no go. Running 0.1.4 Not sure what's going on. I have also removed the app, the virtual device, and the tile completely and reinstalled from scratch with the same result...


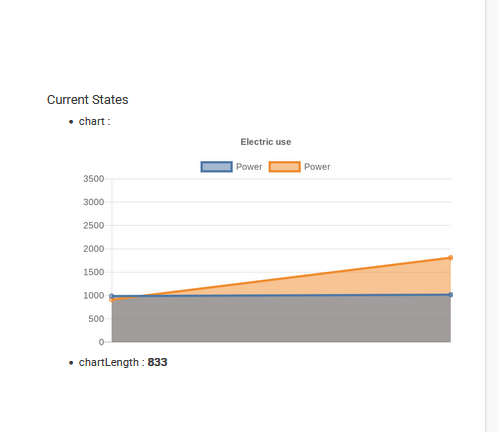
What is the chartLength you see in the virtual device page?
833, well under the 1024 limit

New bundle...
0.1.5 - 07/26/22 - Fixed x-axis with Event Data, code cleanup
Anything in the logs??
Hi @bptworld
I'm running Quick Chart - 0.1.5.
Getting some strange things going on when I try to define a line chart for temperatures using a 'collector' file. If I use device events the chart displays just file.
Here are the settings I am using.
Collector screen shot page 1.
Collector screenshot page 2.
No errors in the logs
Chart screenshots
Manually generate a chart.
Logs at this point.
The error is generated every 5 minutes as I have set the chart to refresh every 5 minutes.
File Manager screenshot
Show me a debug log of the collection app, please
@bptworld
There are no errors just this.
I have opened the collector child app and gone through the screens.
EDIT: This has just appeared in the logs. I'm assuming this was a temp change that was reporting to the collector file.
Why did you cut that off!? I can't troubleshoot if you don't let me see what's going on.
Okey Dokey. Oops. 
Just me making an executive totally uninformed decision that it probably wasn't necessary as the error was later.
Here you go.
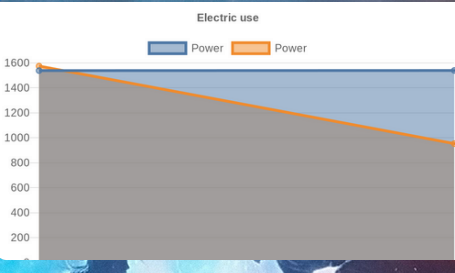
So weird it's working intermittently.. One thing happening still is the bottom of the graph being cut off...
Dashboard

What it should look like..
I love the idea of this, unfortunately I am having some issues. I have created a collector, and it creates the file in the file manager and adds data into the file, but I am unable to choose the file in the chart section.
The only thing I do see in the dropdown of the chart session is a Hubitat dashboard backup file:
Any idea what could be the problem? I have re-installed the app.
Did you name your collector file using the .txt extension?
ie.
yourFile.txt
Nope, I didn´t, so fixed that and I am now able to select the file. Unfortunately it does not display what I am expecting, although the collector file contains the correct data. If I enable the device directly in the chart, I get closer to what I am expecting, but too few data points.
in both circumstances I am running the same attributes.
Still getting nothing on dash... Still not sure why...
Please show me the file from the debug logs
Are you using any special CSS formatting or smartly?