@bptworld Still getting this whether I choose chart or charti. But the device shows the attribute
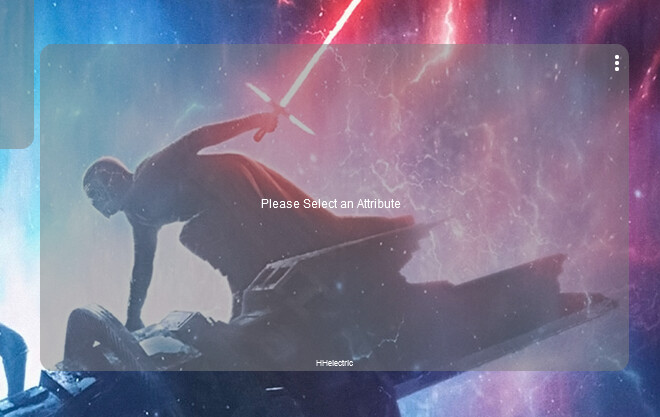
But when you click iframe handler I'm not sure if this is expected behavior
@bptworld Still getting this whether I choose chart or charti. But the device shows the attribute

But when you click iframe handler I'm not sure if this is expected behavior
I had the same issue. Tried changing the devices I am collecting data (Temp in my case) and it seems like there are some devices that when you add them to the app the virtual device will collect the data and include a chart in the device page but will not show on the dashboard.
Could not yet find the logic behind it ![]()
In my case it's iotawatt out putting power which is just a number for the attribute
IE:

Edit: Just rebuilt the child with Temp from a sensor and same thing.
When I’ve seen something similar, it was due to having a script tag with a debugging alert() in the HTML that was generated.
Any errors in the log?
When I use 'file manager' for a line chart, when I click on generate chart I get this.
Not that I'm seeing. Since setting to temp the dash Icon is working...
Setting it back to my iotawatt now shows properly... Strange. I'll keep monitoring. I have it set for every 5 mins. Also as you can see when in the iframe, the bottom portion that contains the DAY is cut off.
Ignore the title
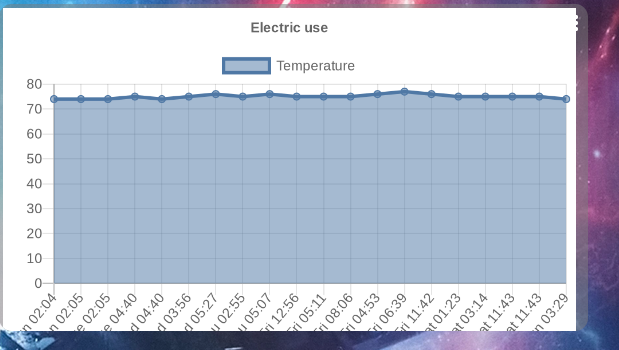
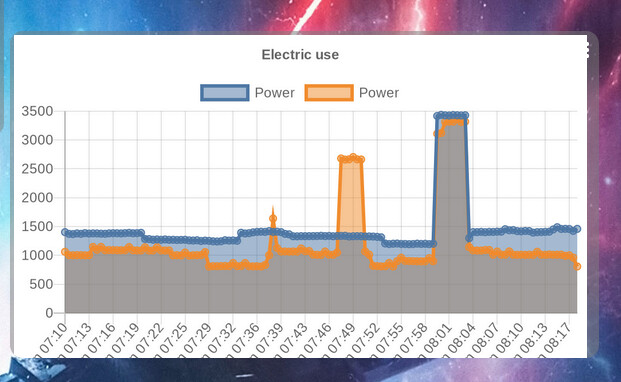
As you can see when I open the image in a new tab it shows the day
My chart is working pretty good mostly! Great app. The only odd thing I’m seeing at the moment is the days of the week are swapped in the chart. Thursday, Sunday Saturday, Friday
Yup, I mentioned sorting issues in a previous post. Work in progress. 
Hi @bptworld not sure if you missed this post that shows an error so I'm doing a gentle nudge.
I do appreciate all you do for us mere mortals and I'm only mentioning this again just in case you did miss the post.
If you did see it sorry for the prompt.
New Bundle...
0.1.3 - 07/25/22 - Added more logging, working on sorting - lots more to do!
Personally I like the background, so I think a chart might detract from the aesthetic you (Lucas Arts I expect) have created....
Nice, days are in order now! Maybe just nice to swap the order of the sorting for next beta version though 
I know you know what you are doing but bear with me...
To Display on Dashboard:
Also noticed on your device page, you're not running the latest version! You should have a 'chartLength' attribute. Remember, if this number is above 1024 ... it won't show on a dashboard.

Can you please explain how is the chartLength calculated?
Example of how the chart is built:
https://quickchart.io/chart?f=png&bkg=$bkgrdColor&c={type:'${gType}',data:{labels:${theLabels},datasets:[{label:'${theAtt}',data:${theData}},{label:'${theAtt}',data:${theData}}]},options: {title: {display: true,text: '${theChartTitle}'}}}
Then the characters are counted:
theCLength = buildChart.length()
Hi @bptworld,
I can not figure this out.
When collecting data from 3 devices to create a chart I get a chart length of 1889.
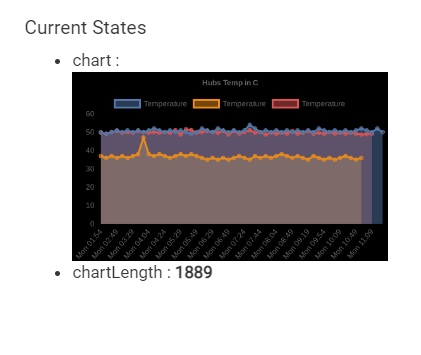
No changing anything but adding one additional device I now get a chart size of 1405:
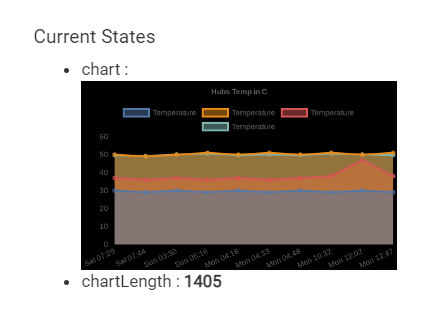
I must be missing something
It looks like it's using a lot less data points per device
It sure looks like it. But why?
The added device is a contact sensor with temp capability and the other 3 are: 2 HE hubs using @thebearmay HubInfo driver polling data every 10 minutes and one virtual temp device using node red to collect data from my Raspberry PI once every 30 minutes.
What determines the X axis points showing?