[RELEASE] Prometheus device metrics / hubitat2prom in C#

Hola,
I geeked out on smarthome monitoring, using Prometheus to gather metrics, and Grafana to make pretty charts. I came across a Python Promethus exporter here - this worked well for a while, but I wanted to do more, and I don't particularly enjoy using Python, so, doing what any self-respecting developer does, I ported it to my favorite platform, .NET! :crazy_face:

My port of hubitat2prom, written in C#, can be found here; Docker images are here. Setup documentation can be found in the repository readme. I run this on a Raspberry Pi 4 alongside PiAware and a few other Prometheus exporters.

Like the original Python solution, this uses the Hubitat Maker API to gather device metrics. Those metrics are then translated into Prometheus exporter metrics so Prometheus can ingest them, and Grafana can chart them.

Unlike the Python version, I've added or changed the following:

  • Support for all device attributes, with some attributes being explicitly handled. See here.
  • Reduced HTTP requests by an order of magnitude - one request for all information instead of one per device. This is done with the Maker API /all endpoint.
  • Added endpoint to get Prometheus metrics for a specific device.
  • Type safety, even among types that differ within the Hubitat API.
  • Async support for all I/O, freeing up CPU resources on the host system.

Here's an example of the metrics I'm collecting for one of my switches.

From Maker API:

{
    "name":"Plug - PiAware",
    "label":"Plug - PiAware",
    "type":"Zooz Power Switch",
    "id":"1063",
    "date":"2022-03-08T07:33:28+0000",
    "model":null,
    "manufacturer":null,
    "capabilities":[
        "Configuration",
        "Actuator",
        "VoltageMeasurement",
        "Refresh",
        "PowerMeter",
        "EnergyMeter",
        "Outlet",
        "Switch",
        "Sensor"
    ],
    "attributes":{
        "voltage":"123.025",
        "dataType":"NUMBER",
        "values":null,
        "voltageL":"0.000",
        "voltageH":"8073117.696", // god knows what happened here
        "frequency":null,
        "powerL":"-2147476.366",
        "switch":"on",
        "powerH":"3665038759.25", // D:
        "power":"7.731",
        "energyDuration":"30.37 Days",
        "current":"0.103",
        "currentH":"134217.832",
        "currentL":"0.000",
        "energy":"5.58"
    },
    "commands":[
        {
            "command":"configure"
        },
        {
            "command":"off"
        },
        {
            "command":"on"
        },
        {
            "command":"refresh"
        },
        {
            "command":"resetCurrent"
        },
        {
            "command":"resetEnergy"
        },
        {
            "command":"resetPower"
        },
        {
            "command":"resetVoltage"
        }
    ]
}

From this application:

switch{device_name="plug___piaware"} 1.0
current{device_name="plug___piaware"} 0.103
energy{device_name="plug___piaware"} 5.58
power{device_name="plug___piaware"} 7.731
voltage{device_name="plug___piaware"} 123.025

Here's what my Grafana dashboard looks like, using data from this app.

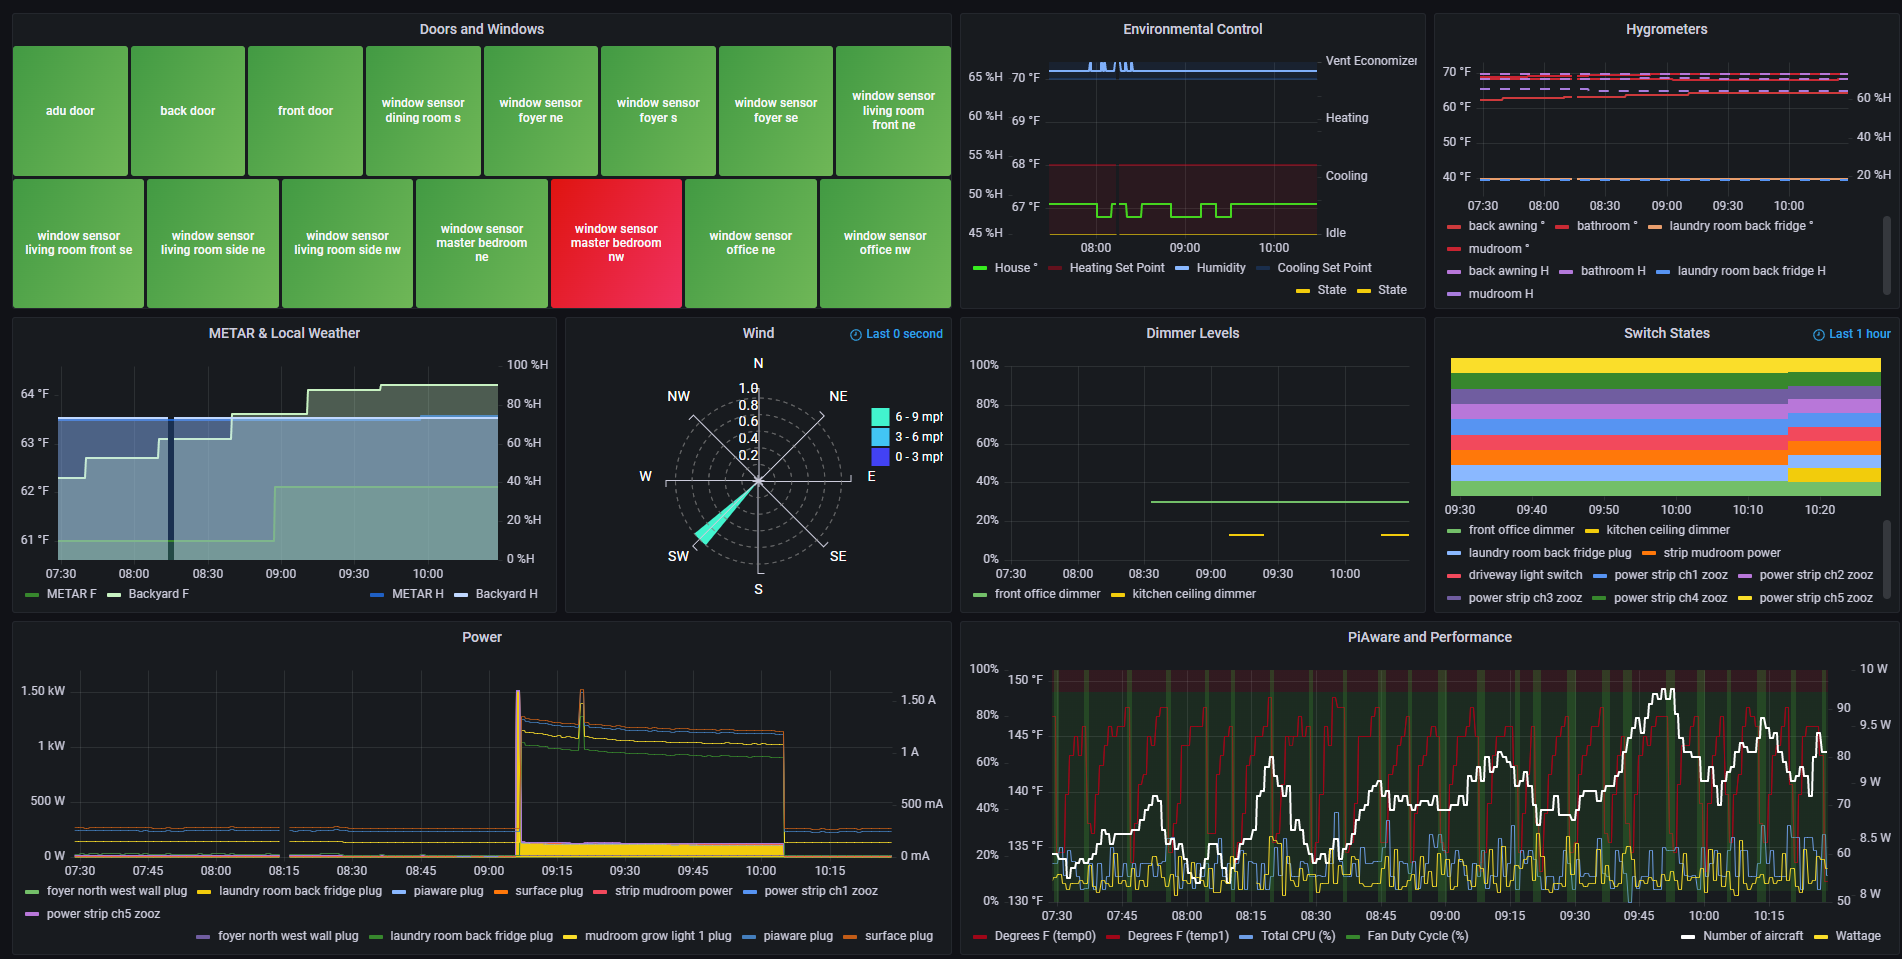
Hope others find this useful!

Latest Release

4 Likes

Thanks for this! I had been putting off setting up grafana and influxdb, but getting hubitat2prom (plus Prometheus and grafana) running in docker was easy!

1 Like

Great! Glad this was able to get your project off the ground.

This is brilliant - thanks so much for putting this together.

I came across a small issue when setting up some battery monitoring. I have a couple of devices that were offline and the battery value was not a numeric but a string “unknown”, this causes an exception and the rest of the JSON doesn’t get parsed

{"battery":"unknown","dataType":"STRING"}

   ---> System.FormatException: Either the JSON value is not in a supported format, or is out of bounds for a Double.

Would it be possible to handle none numeric types, perhaps convert to -999 to indicate an issue?

Many Thanks

D

You're welcome!

Good catch. I'm surprised I haven't run into this myself. If you don't mind, can you share what devices these are, and the full output from one of these Maker API endpoints?

All: http://<your hubitat IP>/apps/api/<app ID>/devices/all?access_token=<access token>
Specific device: http://<your hubitat IP>/apps/api/<app ID>/devices/<device ID>?access_token=<access token>

Would it be possible to handle none numeric types, perhaps convert to -999 to indicate an issue?

Yes, definitely. Would the value -1 work for your use case? This is the pattern I have been using for "unknown" and "invalid" values, e.g., switch state.

-1 would also be fine.

Frustratingly, it looks like the sensor that was reporting an “unknown” seems to have sorted itself out and just as I go to capture the requested info, it is now reporting a numeric value. So I’m afraid I can’t reproduce the issue - but hopefully helpful in identifying an edge case issue nonetheless. I could have sworn I also had a sensor reporting “undefined” - but again I can’t reproduce this to be sure.

D

No worries - glad you're device is working now, and hope hubitat2prom is working out for you. I'll write a relevant test case and hopefully have the bug sorted out.

Can you share what device this is? I'm in the process of writing more device-specific behaviors, and this information can help with that.

For your reference Hubitat2prom does not parse errant string values for battery statuses correctly · Issue #2 · aholmes/hubitat2prom · GitHub.

Great Thank you.

This is the driver that was reporting the “unknown” values temporarily: https://raw.githubusercontent.com/ymerj/HE-HA-control/main/genericComponentBattery.groovy

On a seperate note, is it possible to bring in the last event date somehow? I wanted to create a dashboard displaying “problems” and was thinking it include devices that havent reported any activity > X days

Thanks! That helps.

Hmm - my first thought is that Prometheus should be capable of doing this for you. Would the absent and absent_over_time functions get what you're looking for? Unfortunately, both do not pass through any labels, but it looks like someone's found a clever alternative (there are a couple other solutions on that page as well).

Here's what each of these solutions looks like for me (1m would be changed to Nd for your use case).

That’s an interesting approach I hadn’t thought of .. I’m pretty new to Prometheus but how does this work: is it expecting a change every 1 min in your example ? What happens if the device is off and there is no change in the power attribute value ? Would this then be picked up by the absent function and therefore produce a false positive?. If a device stops responding or updating i assume maker api just holds the last value - so how would the proposed solutions work in that scenario?

Thanks for your help and advice!
D

absent works by outputting a "1" if the metric is missing at any given time. Prometheus, by its nature, is time based, so the gist is that, for each sampling, absent will result in an empty vector or "1". A sample is your metric, and the time at which that metric is sampled. Read more about this at Instant vector selectors.

In my screenshots, you are seeing what happens when I shut down hubitat2prom for a few minutes - which means Prometheus is missing values for the hubitat_power metric for each time my query is sampling within the time period (from 0:14 - 0:18), while each other sample has a value (and so absent returns an empty vector, and nothing is displayed on the chart for those times).

absent_over_time uses a range vector (a selection of samples over a given time period), then applies that vector to determine what to return. In my screenshots, the effect is that a "1" vector is returned if the metric is absent over the last 1 minute. In your case, you might select "1d", which is the equivalent of "return a 1 if the vector is absent over the last 1 day," I believe within a sliding window (if I'm describing it correctly). This means you will effectively see the window in which a metric is missing for "at least" the length of your range vector selection.

I strongly recommend reading some of the sliding window docs, and about the different types of queries you can make (instant, range). I'm not particularly well equipped to explain how Prometheus works in depth. :frowning:


Okay, so all that said - your question is prescient. Maker API indeed reports the last value coming from the device driver as far as I can tell. I have had some devices that will always show the last value, and I have also seen some end up reporting nothing (although I haven't dug into why or when that happens).

What happens if the device is off and there is no change in the power attribute value?

In this case, Maker API will report the last value, whatever it is (and presumably based on what the driver reports). I have some Zooz ZEN15 devices that report 0 power draw when I turn them off, and this is passed through from Maker API. I also have a hygrometer that died, whose last reported battery value was "1" and that is what Maker API returns despite the device being completely dead.

Would this then be picked up by the absent function and therefore produce a false positive?

No - any value is considered "present," while the absense of a metric value is, well, "absent." So "0" is "present" in an instant query, and seconds/minutes/hours/days/weeks/etc of "0" are "present" in a range query. Think about it as null (absent) vs. not null (present).

If a device stops responding or updating i assume maker api just holds the last value - so how would the proposed solutions work in that scenario?

If Maker API consistently reports the last value, absent will never return "1", so it won't really work for what you're describing unfortunately. In this case, your best bet may be to presume a specific value to represent an outage - perhaps "0" or "-1" (once I get around to fixing that battery bug, and if Maker API reports a non-numeric value). You can also rely on something that you know to be a "bad" value, or rely on a threshold - like perhaps you want an alert when the battery is <= 10.

You can go further and take advantage of the sliding window functions and the bool operator. For example, here's a way to query for any values that average <= 10 over a 12-hour period, and then return a 1 for any of the devices in the metric, without returning any of the "working" devices. This is what it looks like for my previously dead hygrometer.

(avg_over_time(hubitat_battery[12h]) <= bool 10) > 0

You can even further and manipulate metrics below a threshold to show as "0" while also showing other metrics, and other values for the devices in question. Check this out. This shows any "battery" values <= 10 as 0. This works (meaning the or is not short-circuited and the second query is triggered) because (avg_over_time(hubitat_battery[12h]) > 10) is "absent" (in the same way absent(...) works) for the metric when the value is <= 10.

(avg_over_time(hubitat_battery[12h]) > 10) or ((avg_over_time(hubitat_battery[12h]) <= bool 10) > 0) * 0

Hope this helps!

1 Like

Hey @dan-edge, I've resolved the bug you reported. Thanks for bringing it to my attention.

Here's the docker image and the GitHub release for v1.2.1.

The change in behavior means a metric is not reported if there is an error when deserializing the JSON for that attribute (an attribute is transformed into a metric) from Maker API. This means any individual metric, like hubitat_battery, can fail without affecting any other metrics.

The error is caused by the device driver reporting the string "unknown" for the battery attribute, and an assumption I've made in hubitat2prom. That is, hubitat2prom expects that battery is either a decimal, integer, or nonexistent. See hubitat2prom/DeviceSummaryAttributes.cs at v1.2.1 · aholmes/hubitat2prom · GitHub (ignore the "thermostat" comment). If battery is any other type, like a string, deserialization fails.

There are a few reasons I opted to "skip" the attribute over reporting -1 for the metric:

  • Because of where hubitat2prom deserializes the JSON, there is no clear way to handle failures in attribute-specific ways
  • Due to the lack of attribute-specific error handling, -1 will cause problems with metrics whose value can legitimately be -1
  • Not reporting the metric has the advantage that the promql absent functions can be used to detect these kinds of outages

In a future release hubitat2prom will support device-specific handlers, which means I can do something more advanced than "skipping" the attribute for device drivers whose attribute values might differ from other devices with like-named attributes.

Hope this works for now! Please let me know if you run into any further problems.

1 Like

thank you for taking the time to detail this - its extreamly helpful! Sorry for the slow response - work took over the last couple of weeks

You're welcome! Shoot me another reply if you need anything else.

1 Like

Hi,

I ran into problems with the old python version (it stopped working all of a sudden, don't know why). So now I'm giving this version a shot. However, when loading it through docker-compose on my rpi5 it says "exec format error".

I have installed .net on the rpi.

Any ideas what might be missing? I read the readme, but can't find any prerequisites other than installing the Maker API on the hubitat, which I've done.

It seems like the issue is that the docker image is only provided for amd64, not arm64. But the OP @aaron4 seems to run it on an rpi4, wich is also arm64. Am I missing something here? I'm kind of new to Docker...

Thanks for any ideas/pointers.

Hi @wentzel,

Thanks for the report! I actually don't use the Docker image, so I'm not able to thoroughly test it as much as I'd like.

I think you are correct about the image architecture. I've made a change to support both amd64 and arm64. Can you please try the Docker image aholmes0/hubitat2prom:v1.2.3 (or use the tag latest) and report back whether it's working for you on the rpi5?

Thanks a lot for trying to help out with this @aaron4 ! It seems like latest hasn't been updated yet, but I was able to pull when specifying v1.2.3.

Now It goes a step further, but I get another error message: "exec ./hubitat2prom: no such file or directory".

Again, I'm not really a programmer, and I'm not great a docker, so I don't know how to see a more detailed error message than what I get from docker-compose logs. So this is all I have :frowning:

Interesting. I will dig into this and see what I messed up. Will report back soon!

Can you share the contents of your Docker compose file?

  hubitat2promCsharp:
    image: aholmes0/hubitat2prom:v1.2.3
    platform: linux/arm64
    container_name: hubitat2promCsharp
    env_file:
    - './.envCsharp'
    ports:
    - 8080:80
    restart: unless-stopped