I've recently dumped InfluxDB for Prometheus so I needed a way to get the data from Hubitat into the data store.
I took the decision to make the most of the Maker API and write a small web-service that can run in a Docker Container or on something like a Raspberry Pi which scrapes the MakerAPI and returns the output in a format suitable for Prometheus to consume.
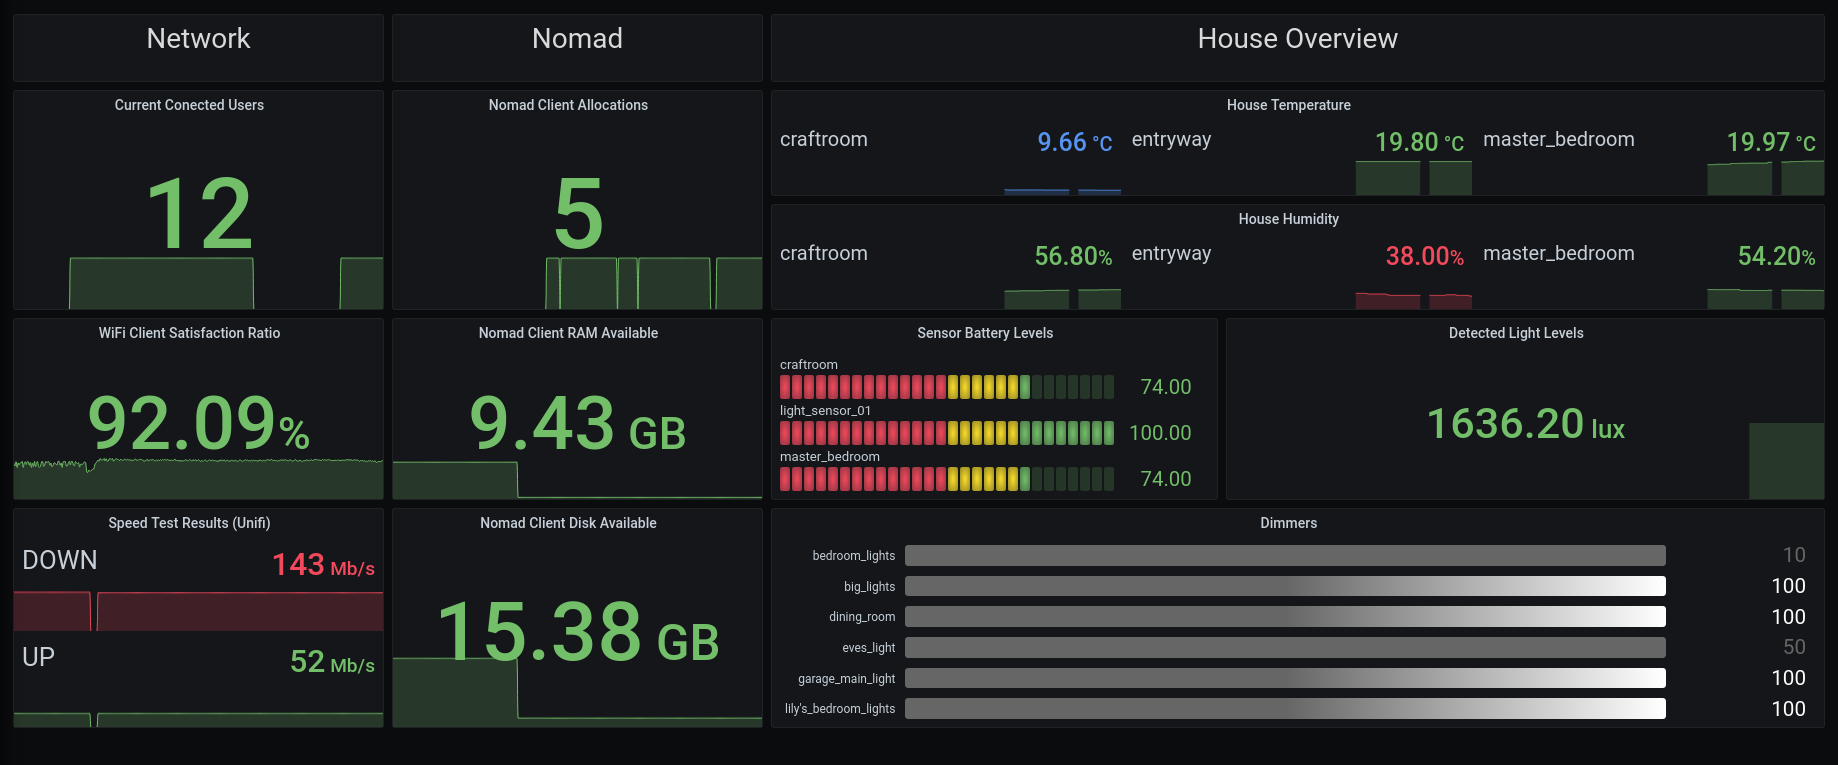
I'm planning to release the code and full documentation in the next couple of days, but here's an example of what my current dashboard in Grafana looks like:
Yeah, absolutely, I'll include instructions for that as well.
It's written in Python using Flask, so in theory it's as easy as installing the requirements (Flask, Requests, PyYaml), writing the config file, and running the script - that's how I've been testing it anyway!
This is great! Although i guess im headed for a Pi cluster with all the importers and stuff i added this week. Also my InfluxDB just started having RAM issues today, so a few more Pi's have to be added for me to change my network up. Man, with how mainstream grafana and Prometheus are, it would be awesome if the hubitat staff baked in an exporter so we dont have to poll it externally futher taxing the hub.
Agreed about it being baked in, that would have made life a lot easier!
I was using InfluxDB and Elasticsearch up until a few weeks ago, then the whole licensing issue thing with Elastic made me look at other options at work, which made me reconsider my choices at home too!
I also wanted to play with a TSDB that would cluster without costing me the better part of £25,000/year (looking at you, Influx!) but could still be self-hosted, and figured it was probably time to give Prometheus a go.
I'm now running Prometheus for metrics and Loki for logs, and I'm really pleased with the results.
The scraper/exporter side of Prom is a bit weird for me as I'm used to pushing metrics to my server, not exposing them to be scraped, and I'm still concerned about what this means in a more professional environment where you have to traverse NAT and VPN's, but it's working excellently for home!
My full setup is a server running Nomad for the container orchestration, Consul for DNS/Service Discovery, Vault for secrets managment, and Traefik to tie it all together via a proxy, with Pi's scattered across the network running the Nomad client to serve up the containers.
The main thing I've found though is that Loki and Prometheus are far less resource intensive than Influx/Elasticsearch, so that could be something to keep in mind if you're seeing RAM issues.
Man, all the cool Hashi tools at play here, and my favorite little gopher, Traefik! Almost makes me miss my job! What is running on your containers, if you don’t mind me asking?
Thanks for this, I have been pondering the switch to Prometheus, as well.
The other containers are running various things to do with home automation or stuff I'm testing out.
I've got octoprint running in one for my 3D printer, CNCJS on another for my CNC Machine, Prometheus/Loki/Grafana in others, and a private docker registry in another for testing stuff without having to release it into the wild, and all of them show up on the network as <service name>.service.my.domain automatically thanks to Consul/Traefik!
I blogged about it a few years ago, and I really do need to update that post and migrate it away from the current site as I'm closing that site down!
I am trying to add this to docker compose and below is the error I get. Full disclosure that i am pretty new to docker, but trying to figure out best way to run my services as they keep growing. I like how you can tag dependencies in compose. Let me know if you have any ideas. I'm just trying to point to the config i saved in docker/hubitat2prom/config/hubitat2prom.yml.
So far i have one pi solely running pihole. The other started out running just influxdb & grafana and using the hubitat app to push the data there. I havent had a problem so far, i have one hub that all devices report to using hub mesh (prior to that, used hubconnect). Also have a few apps/ or devices that are lan only on there.
Now i have started pushing unifi stats to influxdb (and the DPI data has taxed my pi).
Since its time to lay it out different, i want to change to dockers.
I'm also going to add a syslog to my Unifi UDMP and thinking of a transparent proxy (or forcing dns to pihole might work).
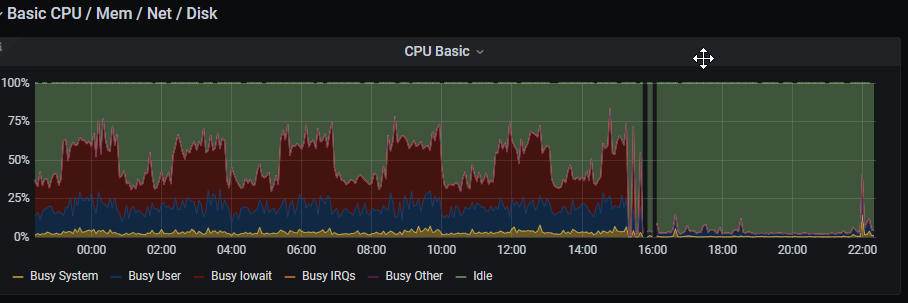
On the topic of Prometheus vs InfluxDB. Below is a screenshot of when i changed Unifi-Poller from writing to influx to writing to Prometheus. The grafana dashboards load much faster as well. In my week of running Unifi-Poller in Influx (YMMV).
It is strange to me as its publishing tagged text to a webpage that gets parsed by grafana (curious what security options are available as well. I use splunk at work, but that's very heavy compared to this stuff. I can see many more collectors being written for various services that i have/ will have in the future.
Summary
pi@raspberrypi:~/docker $ docker-compose up
WARNING: Some services (hubitat2prom) use the 'configs' key, which will be ignored. Compose does not support 'configs' configuration - use docker stack deploy to deploy to a swarm.
Building with native build. Learn about native build in Compose here: Redirecting…
Creating network "docker_default" with the default driver
Creating up-poller ... done
Creating up-hubitat ... done
Attaching to up-poller, up-hubitat
up-hubitat | standard_init_linux.go:219: exec user process caused: exec format error
Hey, great to see more folks trying this out, and thanks for the feedback.
I'll see if I can cross-compile the container to work on ARM, it would be useful for me too as I have a cluster of pi's hanging off the back of a nomad server for my container orchestration, I just tend to keep it pinned to my x86_64 box for now.
As far as performance etc is concerned, I've steered clear of Prometheus for years, preferring ELK for logging and TICK for metrics, however I figured it was about time I gave it a go and like you I'm blown away by the speed.
I'm still learning, so can't be 100% sure what's causing the increase in disk performance, but I agree that it at least "feels" quicker!
From a security stand point, Security | Prometheus explains the security model at Prometheus. I can't say I'm enamoured with the concept that untrusted users have access to the web UI, but I guess you could mitigate that by putting it behind an authenticating proxy such as NGinx.
@ajones - I think I've got the cross-builds working, or at least I can get this running on my Pi 3B+, any chance you could give it a go?
You need proffalken/hubitat2prom:pr-2 as the docker image name, and you'll want to run in privileged mode (not ideal, but it seems to be an issue when running on a pi ) so you'll need the following command line:
docker run --privileged -v "$(pwd)"/config:/app/config -p 5000:5000 proffalken/hubitat2prom:pr-2
Success! Yes it works great Loaded your sample dashboard and all my stuff came over. Im used to Relational Databases and i very much liked working with Influx in Grafana. I have to become better aquainted with Prometheus and how to query it (and how data retention works). It was like when i learned splunk at work and the SPL felt unorganized at first.
Awesome work! ill continue to see how it works and report back!
Been playing with dashboards a bit a few questions if you know them. Great work! i love the performance!
Am i able to to change the port by just choosing new when i bind in docker?
Any way to take all the attributes on the config file and let them be written as an environment variable in docker instead of having a file?
Switch brings back 1 for on 0 for off. Is there a transformation to do in grafana? Can this be called like switchbool and have switch bring back "on" or "off".
Does this poller hit the maker api on its own schedule to update the values being posted to port 5000 or is that realtime?
Is there much risk of performance impact from the maker API being called by this program?
I ask because i have 3 hubitats. I can have docker handle the port issue if i have to, but I would like to not have to have 3 config folders floating around and it might make it easier to do it with a docker command directly.


 ) so you'll need the following command line:
