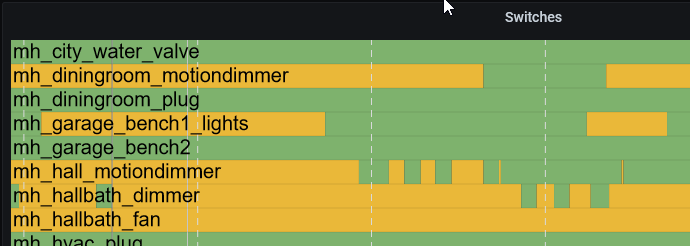
Okay i figured out number 3. Prometheus only takes numbers.. I use the discrete panel in grafana to read things like lock status, fan speed, etc. (More than 1,0). I added the below capabilities, and prometheus barfed at the metrics pages. Only one returning a number is power. Is there an elegant way to get prometheus to handle this?
  - motion
  - water
  - power
  - speed
  - lock
Looks like label values might be what were after here.
(1) Yes, this should work, as long as the port that the settings are pointing to "inside" the container remains the same, the "outside" port can be whatever you want, allowing you to run multiple containers.
(4) The data is returned in real-time because that's the easiest thing to do. Again, please log a bug at Issues · BudgetSmartHome/hubitat2prom · GitHub and I'll have a think about this and how it might be implemented
(5) No idea. There's obviously going to be some impact, but what that impact is I'm not sure because Hubitat doesn't let me see what's going on inside it. All I can say is that I've had this running for over a month now in various forms (testing it before I announced it etc) and I've not seen an impact, but that is anecdata and I'd love to be able to get something a bit more concrete!
Awesome!
4: i dont see a need to log a bug. I dont see any alternative or need to change this to not render the page in realtime.
2: Sure, i will add a code sample on github for number 2. Grafana's docker capabilities come to mind (i can modify the config, or i can pass variables to install certain plugins at start of the container).
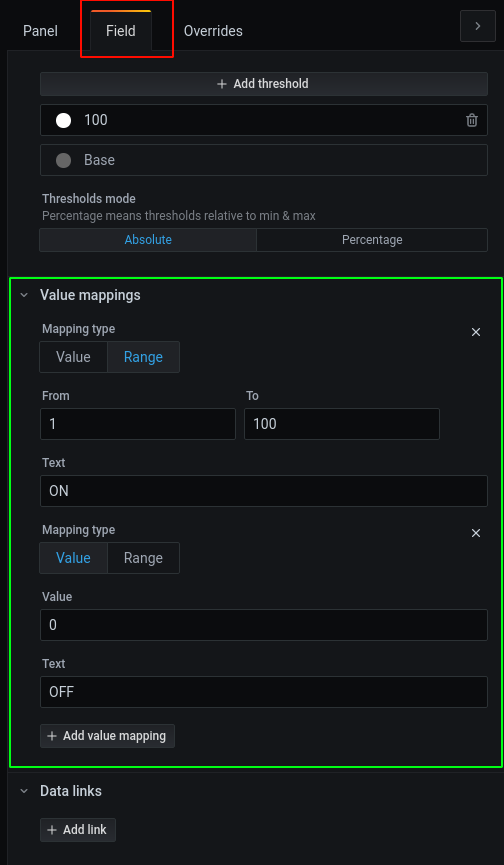
Thanks for the demo on mapping values. This would work for my use case, but unless you transpose each possible string that might come back for a given attribute in the app code, then i cant map it. So the examples below are built in capabilities/attributes that bring back string's for "currentValue".
motion (active/inactive)
water (wet,dry)
speed (High,Medium/High,Medium,Low,Off)
lock (Locked,Unlocked)
So you could assign numeric values to each of these (like you did for on/off), but if they change or vary in drivers, the script has to be updated. Also, custom attributes wouldnt be handled. (plus im assuming im missing some capabilities (contact, rgb, etc).
In the article i attached, it discusses handling these strings as "labels". I guess there is some downside as each unique label gets some sort of index or file or something. The caution was writing things like error stings or IP address where there may be thousands or millions of unique text strings. In our case, it doesn't seem like it would be over hundreds, so performance likely wouldn't have any impact.
The upsides is that you could list the capability to write to database, and whether to use the label or number for it, next to your list. You wouldn't have to hardcode lookups on the poller and then hardcode them back in grafana. Something like the below.
-battery(num)
-contact(string)
-switch(string)
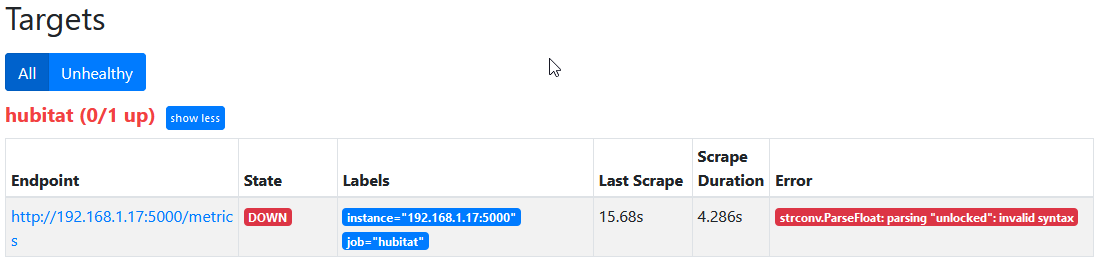
Currently, if i add any of these stringvalues attribute types to the poller, i get the below error on my metric scraper.
This is all great, just identifying issues outside of the example metrics. Prometheus and docker are still somewhat new to me, so build it how you see fit! I think this exporter might be the best way to get Hubitat stuff into grafana!
Thanks, that's all really useful, that last bit about the strings is definitely a bug.
Data like that is better stored in a log engine such as Loki (which can then be queries by grafana ) so let me take a look and see the best way to store that without needing a lookup table between values and strings.
Also, thanks so much for testing all of this out, you're finding the bugs I didn't know about but that need to be fixed!
I started working around with this yesterday and ended up getting it to work last night. Running it on a QNAP NAS Container. Using the hubitat2prom container you created, Prometheus and Grafana. All on the QNAP NAS. Works great. Thank you for the great work!
Hi,
Thanks for writing hubitat2prom. It's been useful and easy to use, and good inspiration for my projects.
I ported the project to C#/.NET (my preferred platform) - you can find it here. Docker images are here. Hope you don't mind me borrowing the name, but I'm happy to change it.
I added and changed a few things:
Some support for additional fields. Here are the "known" fields I added explicit support for. Here are the "Hubitat to Prometheus" transformations for some fields that need it.
Reduced HTTP requests by an order of magnitude - one request for all information instead of one per device. This is done with the Maker API /all endpoint.
Added endpoint to get Prometheus metrics for a specific device.
Type safety, even among types that differ within the Hubitat API.
Async support for all I/O, freeing up CPU resources on the host system.
Hope others find this useful!
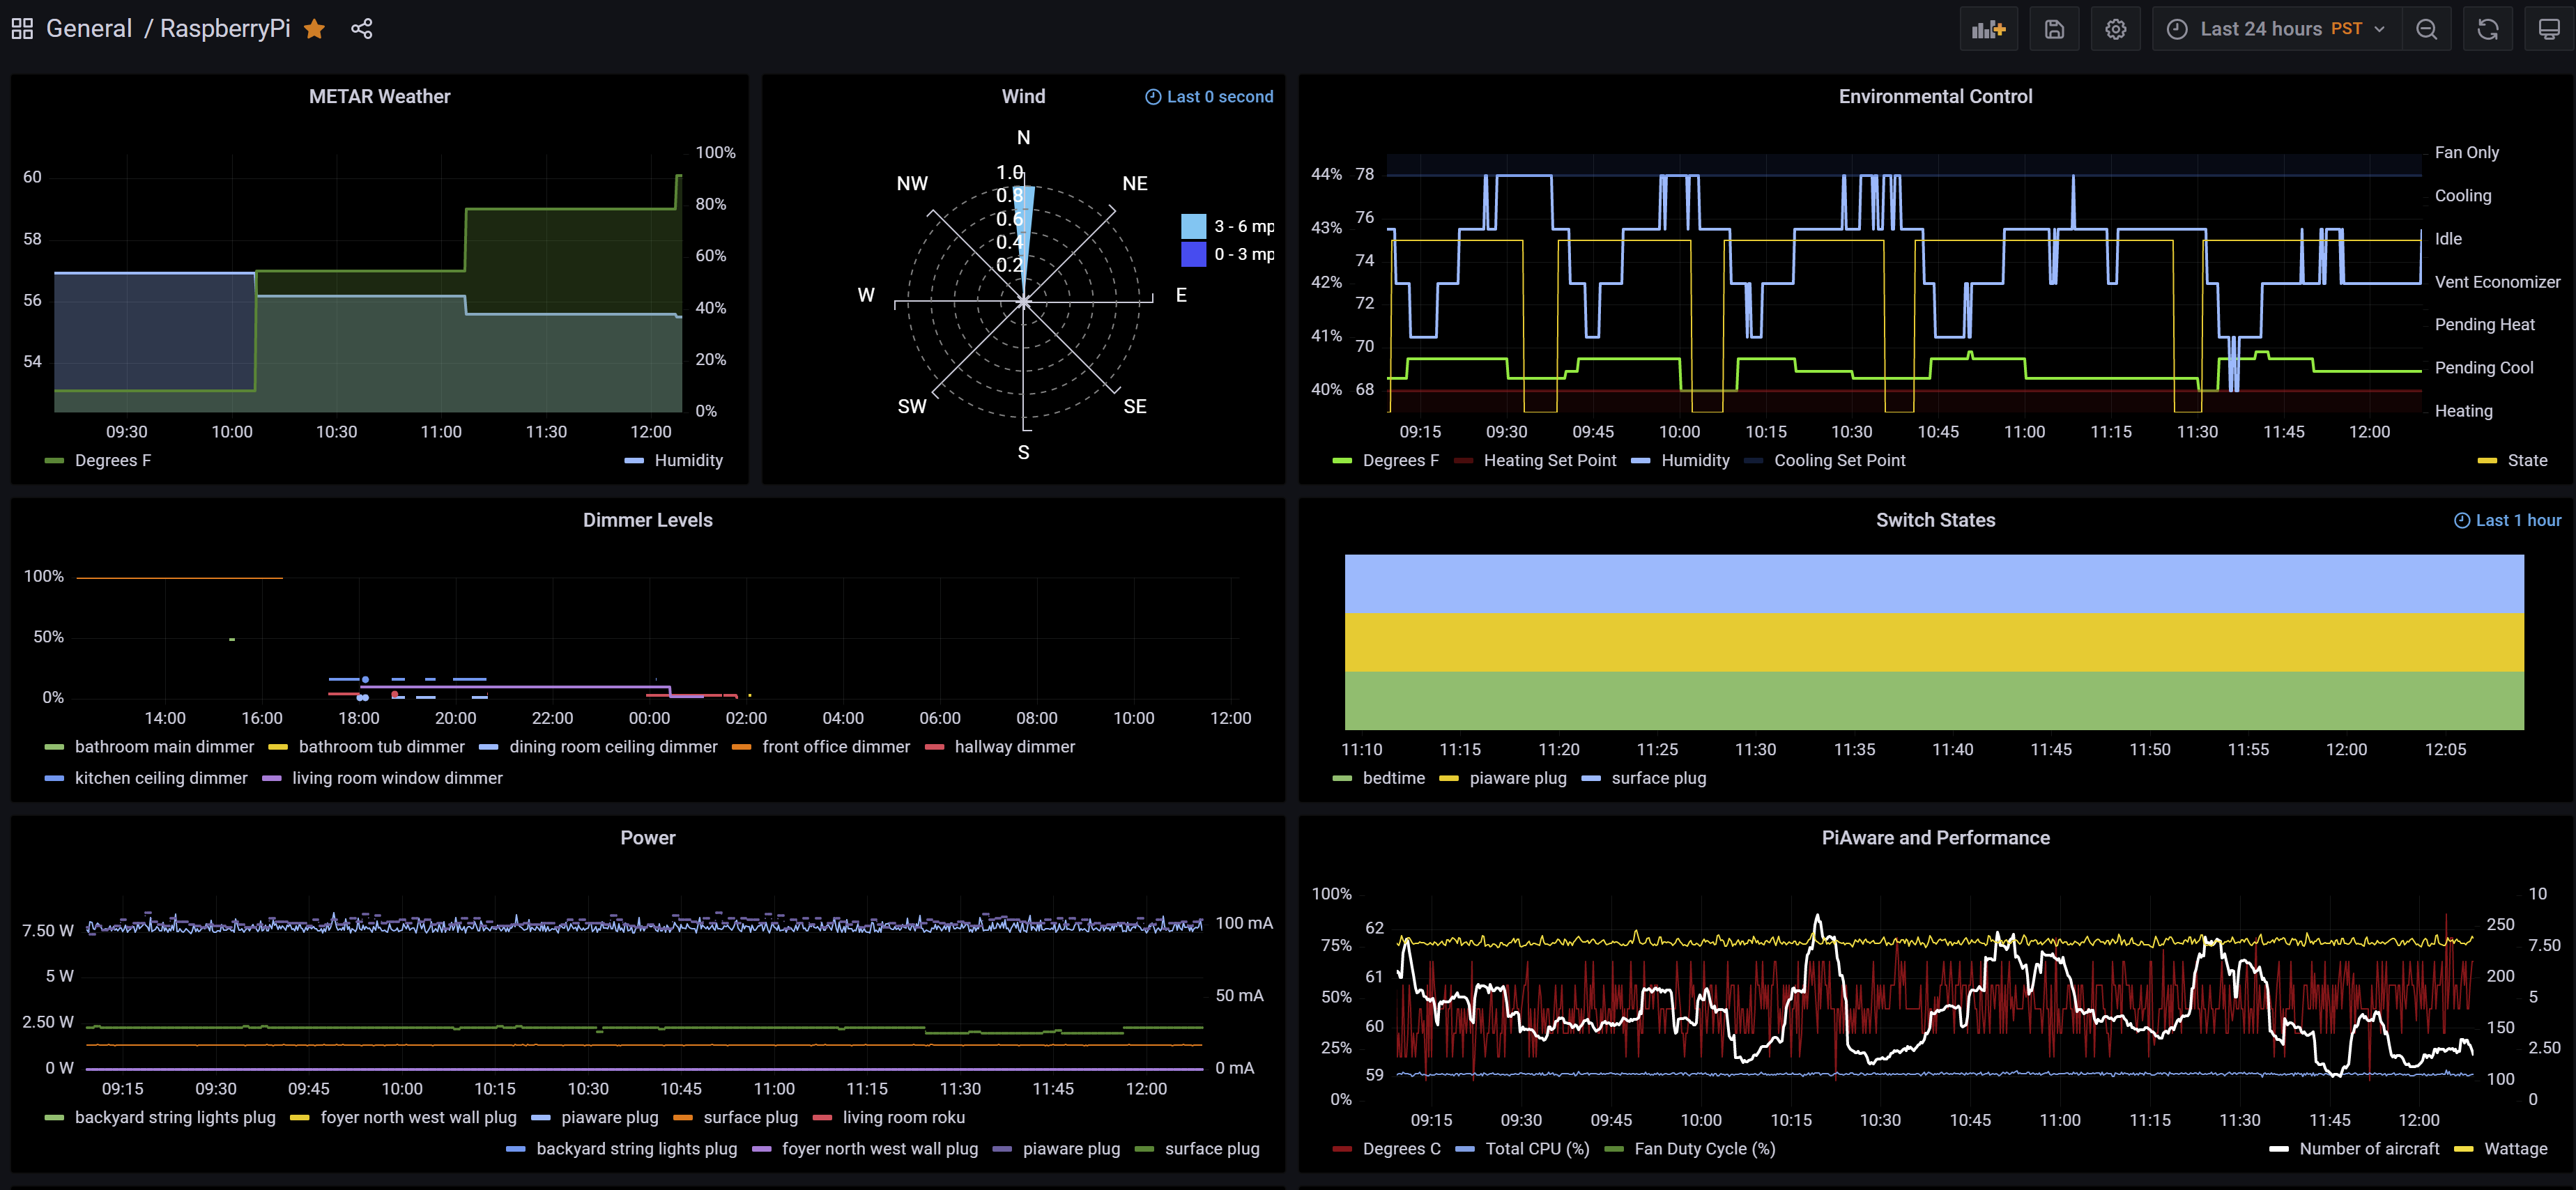
Oh, and here's a shot of my Grafana dashboard for posterity's sake.
I've actually migrated away from Hubitat and back to HomeAssistant (see my blog post for more on that!), so I'll probably archive off the python version shortly anyway.
 There's obviously going to be some impact, but what that impact is I'm not sure because Hubitat doesn't let me see what's going on inside it. All I can say is that I've had this running for over a month now in various forms (testing it before I announced it etc) and I've not seen an impact, but that is anecdata and I'd love to be able to get something a bit more concrete!
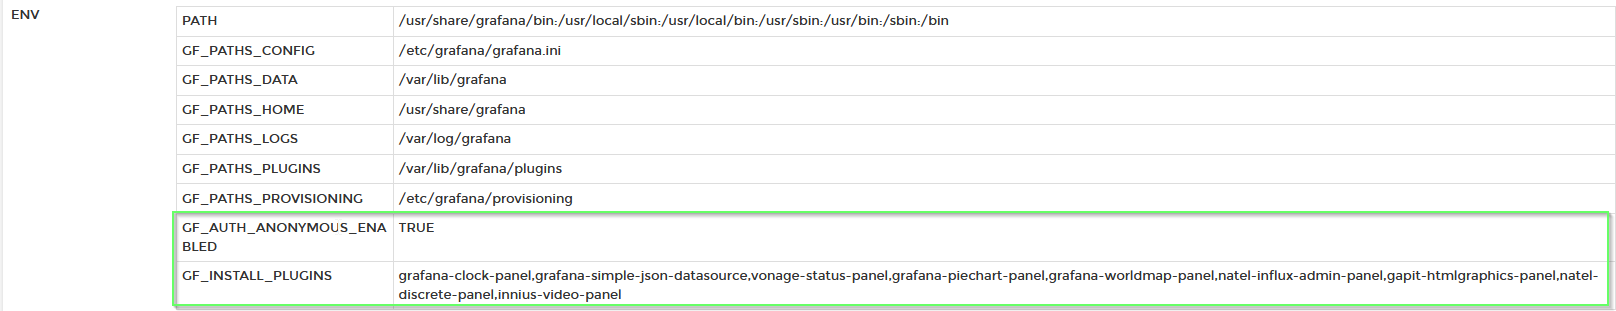
 ) so let me take a look and see the best way to store that without needing a lookup table between values and strings.