Configuration is covered in Post #801. Here is a LINK. I only mention using state for education and helping everyone understand the issue. I have alway appreciated it in the past when developers not only explain what was fixed but also what the problem was and how it was fixed.
1 Like
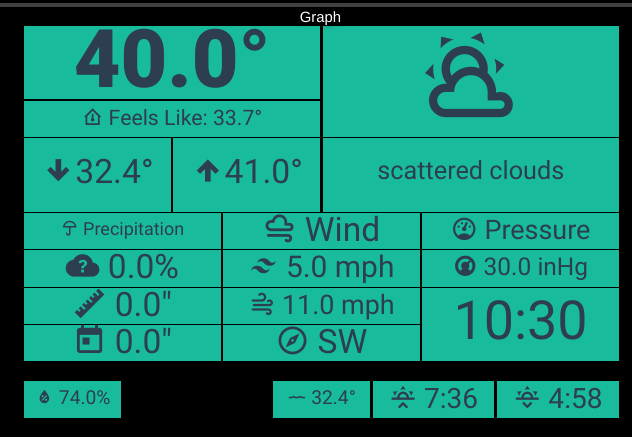
Thanks for the fix. What is the possibility of adding a time stamp field to the weather / forecast tile?
Very possible. Let me take look. Should be easy
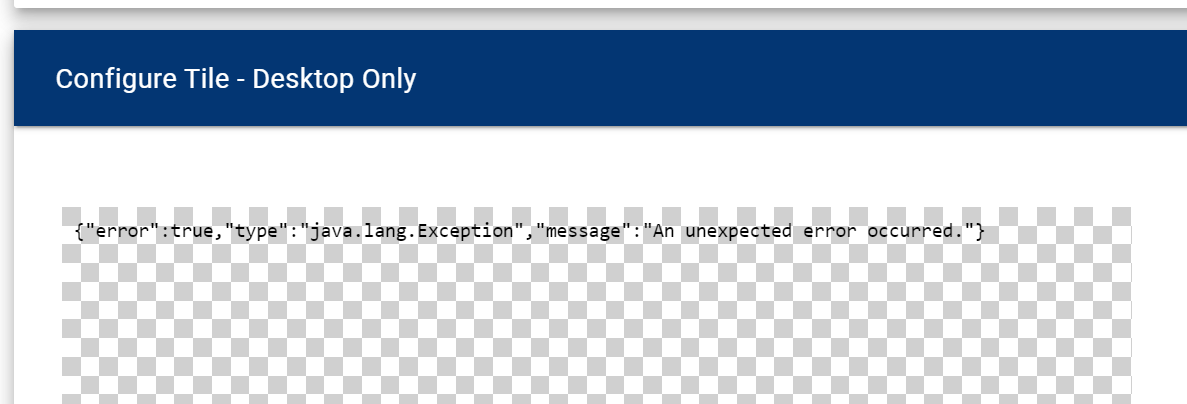
I've never been able to get Weather Tile 2 to work. Every attempt I get a {"error":true,"type":"java.lang.Exception","message":"An unexpected error occurred."}
I have uninstalled and reinstalled with no change.
@charley I had the same issue after upgrading to 4.30. Rebooting Hubitat fixed it (I didn't try just getting the token again w/OpenWeather...I should have tried that!)
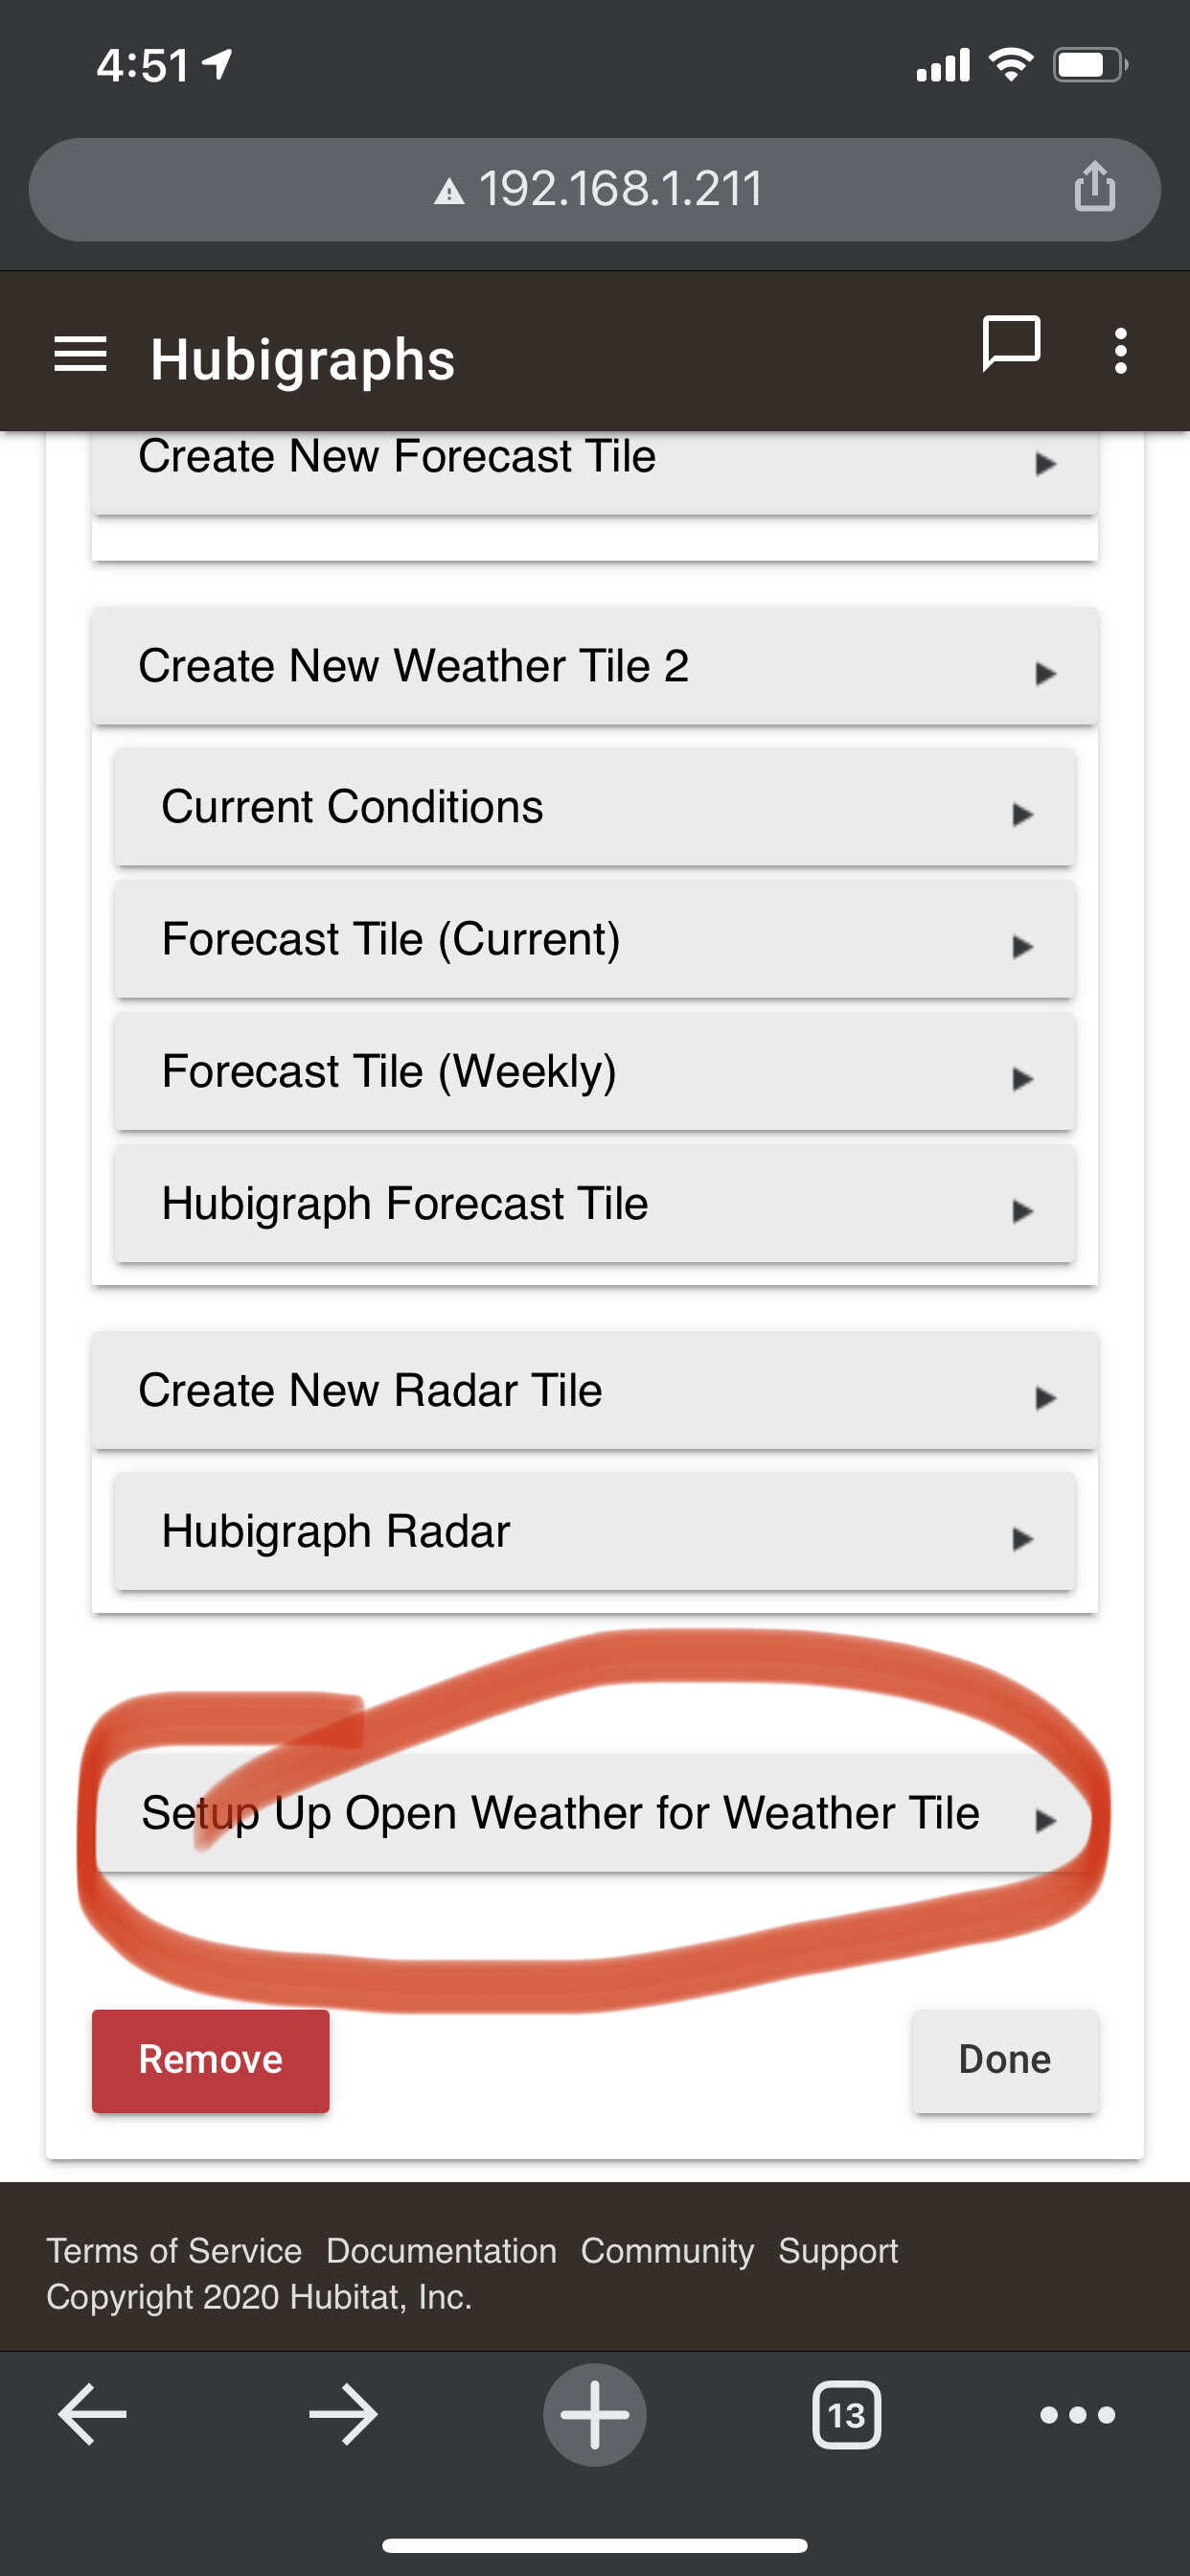
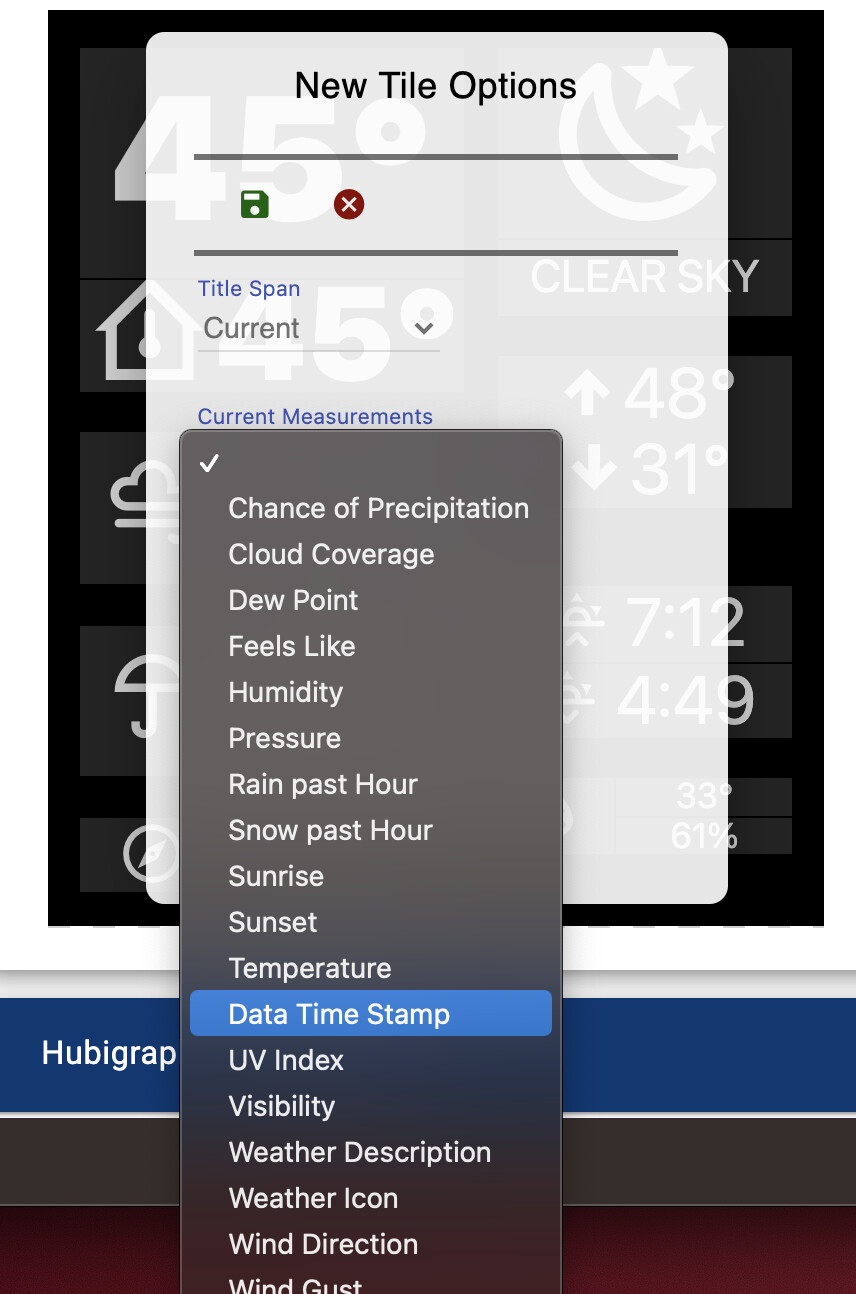
I am not looking in the right place. I deleted forecast 2 and created a new Dashboard tile but I don't see a timestamp field.
Did you load the update? After that, double tap on the screen, press the “plus square”, current and Data Time Stamp
Well I don't know what happened but non of my graphs are working since the last update.
Error: Cannot invoke method currentState() on null object
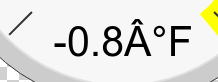
And the encoding is still broken
Which graph is this and which template?
Gauge... I had to recreate the gauges again.. no biggie but it shouldn't have lost the devices it was linked to.
thanks @thomas.c.howard and @scotte.
I had done that when I first installed HubiGraphs, but not after the reinstall. Don't know why it initially failed, but it is working now.
Nice work on this app.
I’ll take a look. Webpage encoding...ugh
Just noticed something this morning. I had my HE using an automatically assigned IP address. When I created some dashboard Hubigraphs, it was set to 192.168.1.50. All worked well. Then last night it appears the HE was re-assigned by my router to 192.168.1.20. When that occurred, the graphs no longer worked on the dashboard. They were still pointing to 192.168.1.50 (original one). I have sinced assigned a static IP for HE in my router to the original 192.168.1.50, and the graphs work again.
All good here. My logs are clear of the 1024 errors.
Thanks
@tzoom Yep, that's indeed an issue. What worked for me was going into each Hubigraph application and disable/enable the API (last item on each of the sub-application screens).
Thanks, I have it working correctly now with the time field as well.
Chrome on debian Linux... Version 87.0.4280.88 (Official Build) (64-bit)

