One more question: Only on the Gauge? or was there another Graph Type?
I think so.. I looked at the other types of graphs I use and just the gauge has the encoding problem.
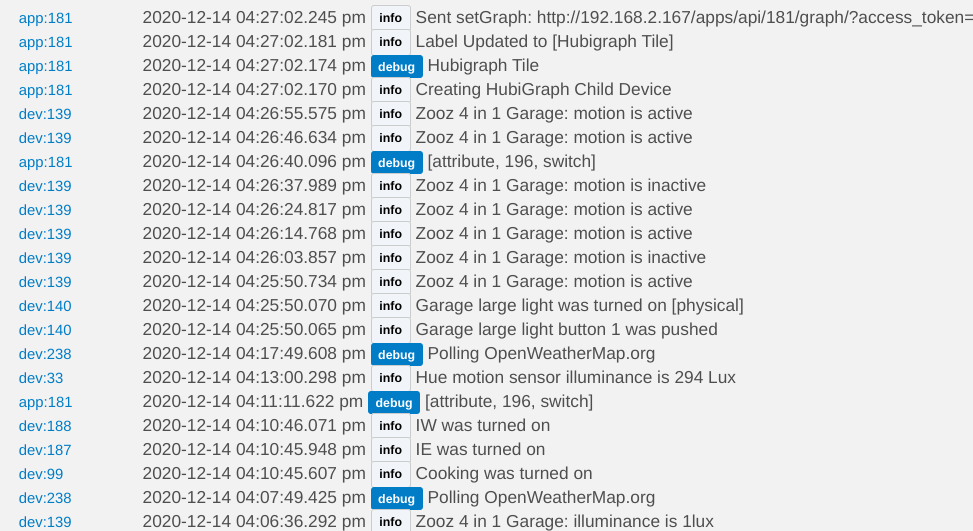
I was trying to run my Temperatures Heat map today and it gets stuck at "Getting events (3/4)". I don't think I changed anything on my side since it was last run. The logs show the following each time I run it:

Any idea if there may have been a change in the code that requires some type of refresh? (I just hope it doesn't mean I have to re-order my devices... That takes a long time...)
On that note... Any plans to do something that keeps the device order even if some are added or removed in heat maps? That would be really awesome!
Hello all. I got Hubigraphs installed, created weather tile 2.0 app. URL works but I can't seem to figure out how to get it working in dashboard. I permissioned it in the dashboard. I can add it to the dashboard but I can't seem to get the data loading live in the dashboard. Tried picking different templates but nothing seems to work. What am I missing?
1 Like
I am getting the following error when trying to create a Heat map of when my various devices have last reported in:
java.text.ParseException: Unparseable date: "2020-12-08 12:00:07+0000" on line 518 (getData)
This used to work just fine. Any ideas what could be causing this?
1 Like
I’ll take a look; something about the dates changed in the latest releases....
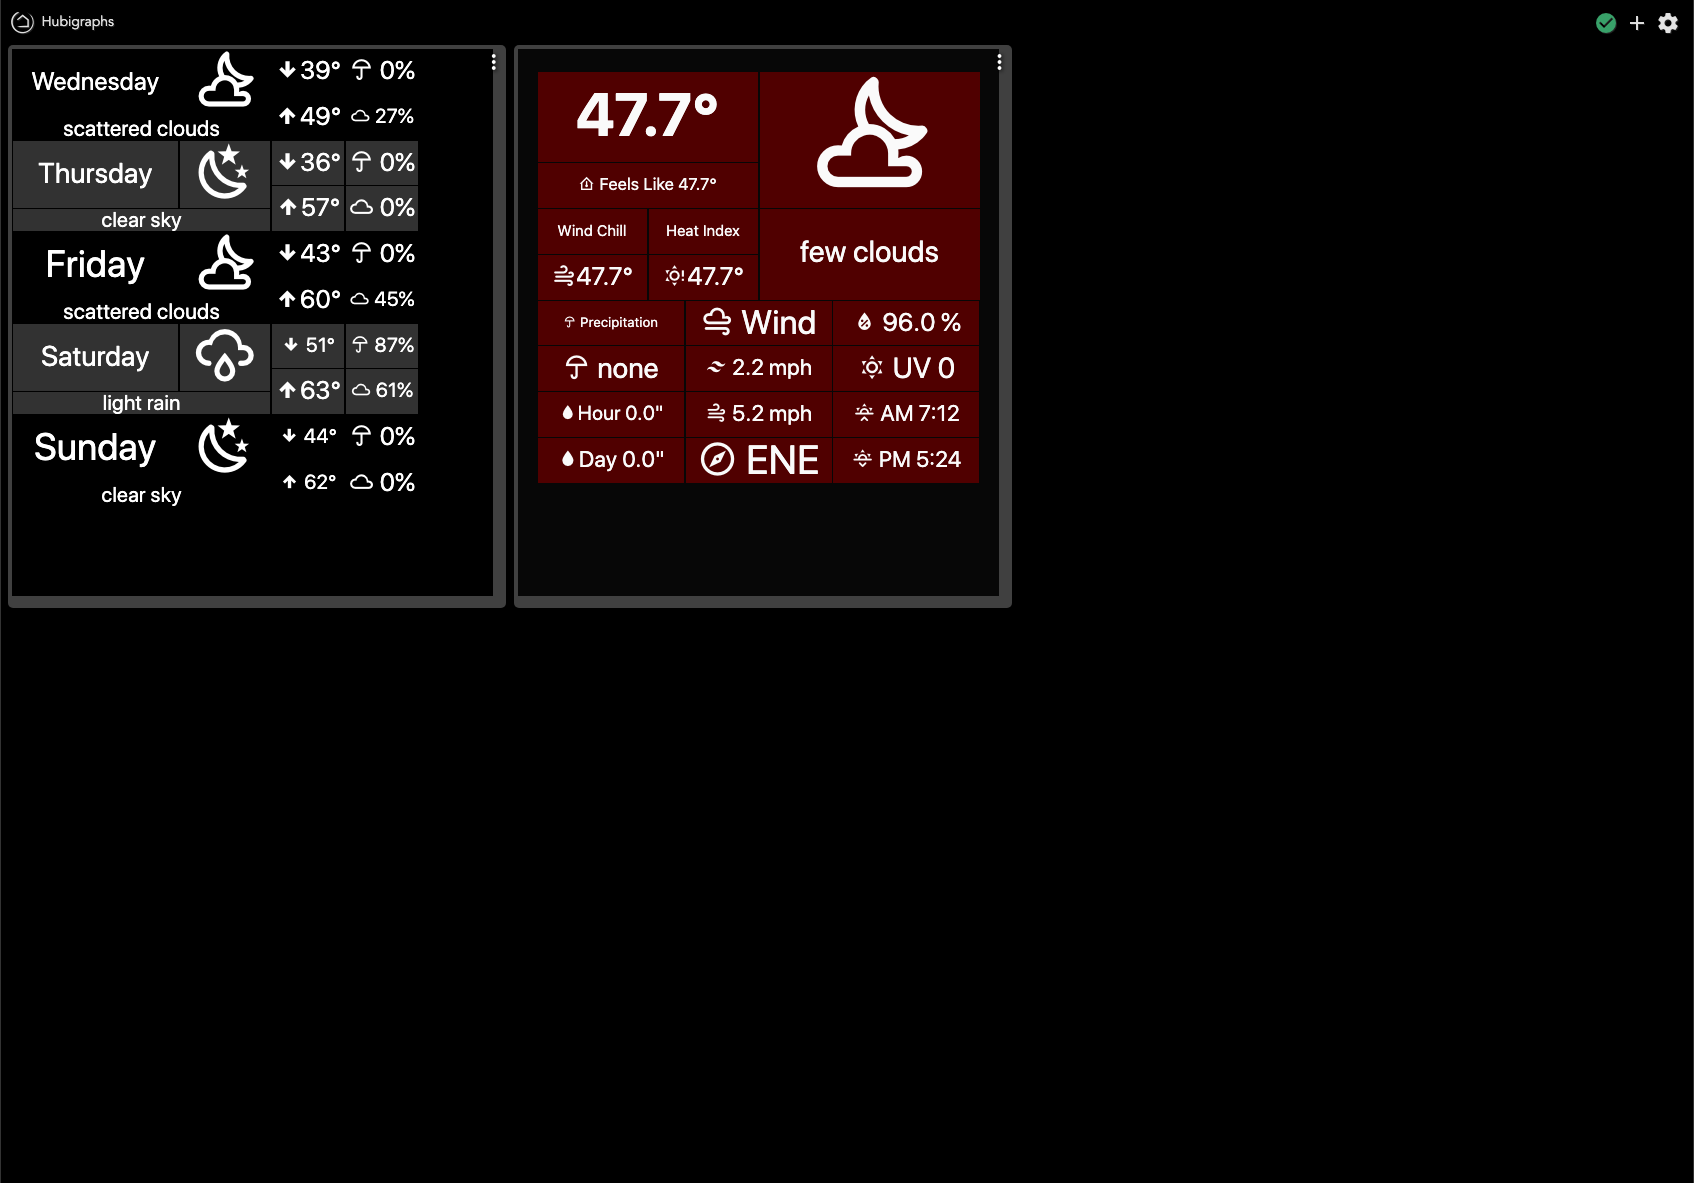
Sunrise and sunset are not changing. Weather Tile 2. Seems to be working except for sunrise and sunset. The times have been unchanged since I set it up six days ago. I think this would be immediately after you implemented the 1024 fix.
Firstly, LOVE the app, absolutely amazing and can't wait to see what all it can do.
I hate to ask for fear it is a 'stupid' question or covered somewhere else but . . . I have created a weather tile and placed it on a dashboard. The tile shows fine locally, connected to my wi-fi, but will not show on the cloud link? Is there a setting or something that I am missing and can review?
I don't think you can view the tiles through the cloud link. Only locally. In my case I use a VPN so I can view the tiles when not on my local network. I am not 100% sure but I believe that is true, Since I have had my VPN setup well before I started using Hubigraph I have never tried any other way.
It seems though it has been asked before, but I realize there is a lot of thread to go through here.
Make sense, thank you for the quick reply.
hmmm. Tile 2 uses the OW data... I'll keep an eye on it...
@shawn.foist agree with @terminal3. I tried in initial development to access through the cloud; to no avail. I could give another try...maybe...
If you get around to it, the app is amazing, I am loving exploring everything. Ordered another hub, will make 5, to use for internal dashboards and graphing.
Thank you for all your work!!!
@Sebastien, I have a fix in; it is small, but reading the forums and looking at the code it might fix the issue. Please let me know.
1 Like
Yup! Whatever you did, the graph now appears instantly when I open the link! Absolutely awesome!
Thank you so much!
1 Like
I added an “Z” to a string; that’s all I did...
1 Like
It was a mighty powerful “Z”! 
New release: Added "Precipitation Tile" to the daily tile.
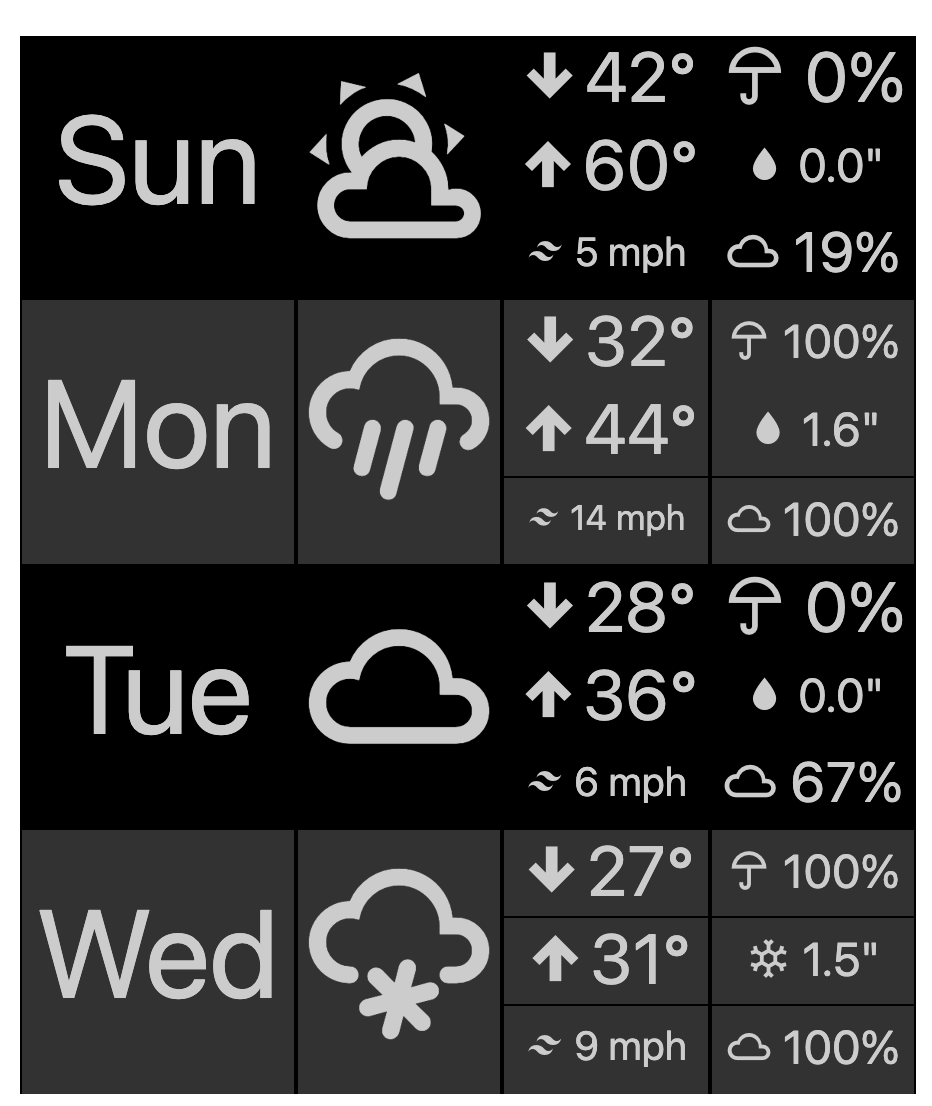
I realized that this week we have forecast rain and snow. Although Weather Tile 2.0 supports rain and snow, it has to have a tile for each. The wife told me that it is unacceptable. So, I made modifications.
The user can now select precipitation (as well as snow and rain) for the daily forecast tile. The tile will "magically" set the accompanying icon to either a water drop (rain) or snowflake (snow). See my forecast below for an example:
2 Likes
What is the source of the debug log entries? I do have debug turned off in Hubigraph where available.