On the dashboard settings for that dashboard, go to the templates tab and change the background color of the attribute template.
Amazing, thanks for this 
Many thanks @Derakkon. Banging my head against the wall over this one, but it was so obvious after you pointed it out.
So I installed Hubigraph with the Hubitat Package Manager but it does not show up in my list of apps. I do see it in the Package Manager as being installed. Any ideas why?
Hi there and welcome to the madhouse.
When you say it hasn't showed up, do you mean under apps code or under apps.
The code gets copied to the Apps Code area.
You then go to the apps section and pick install user apps.
Once installed you should see it and can use it.
Hi Thomas,
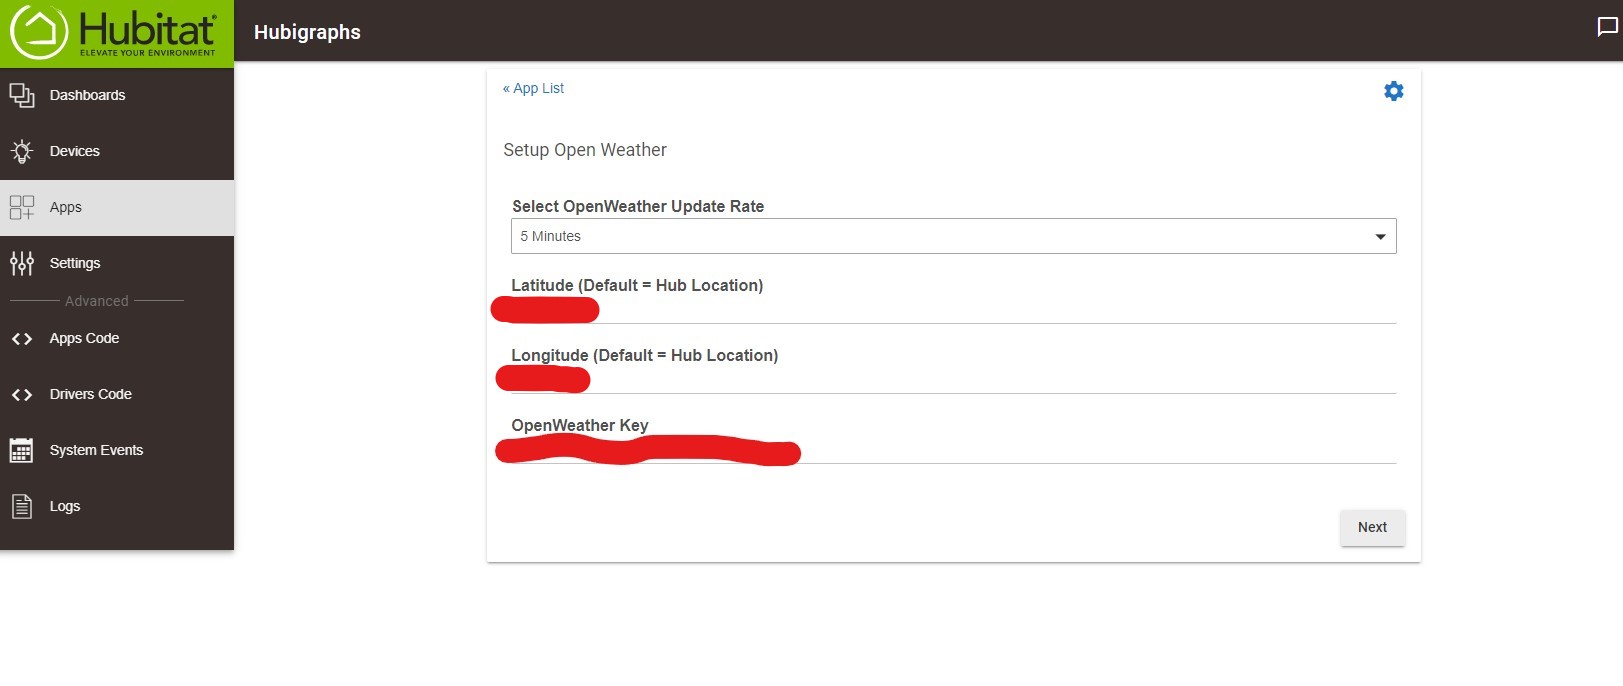
Awesome graphing addition, thanks for your work. The time series graphs are functioning on a dashboard, I'm struggling with a weather graph. I signed up for a free openweather api key and plugged it in but get the following error:
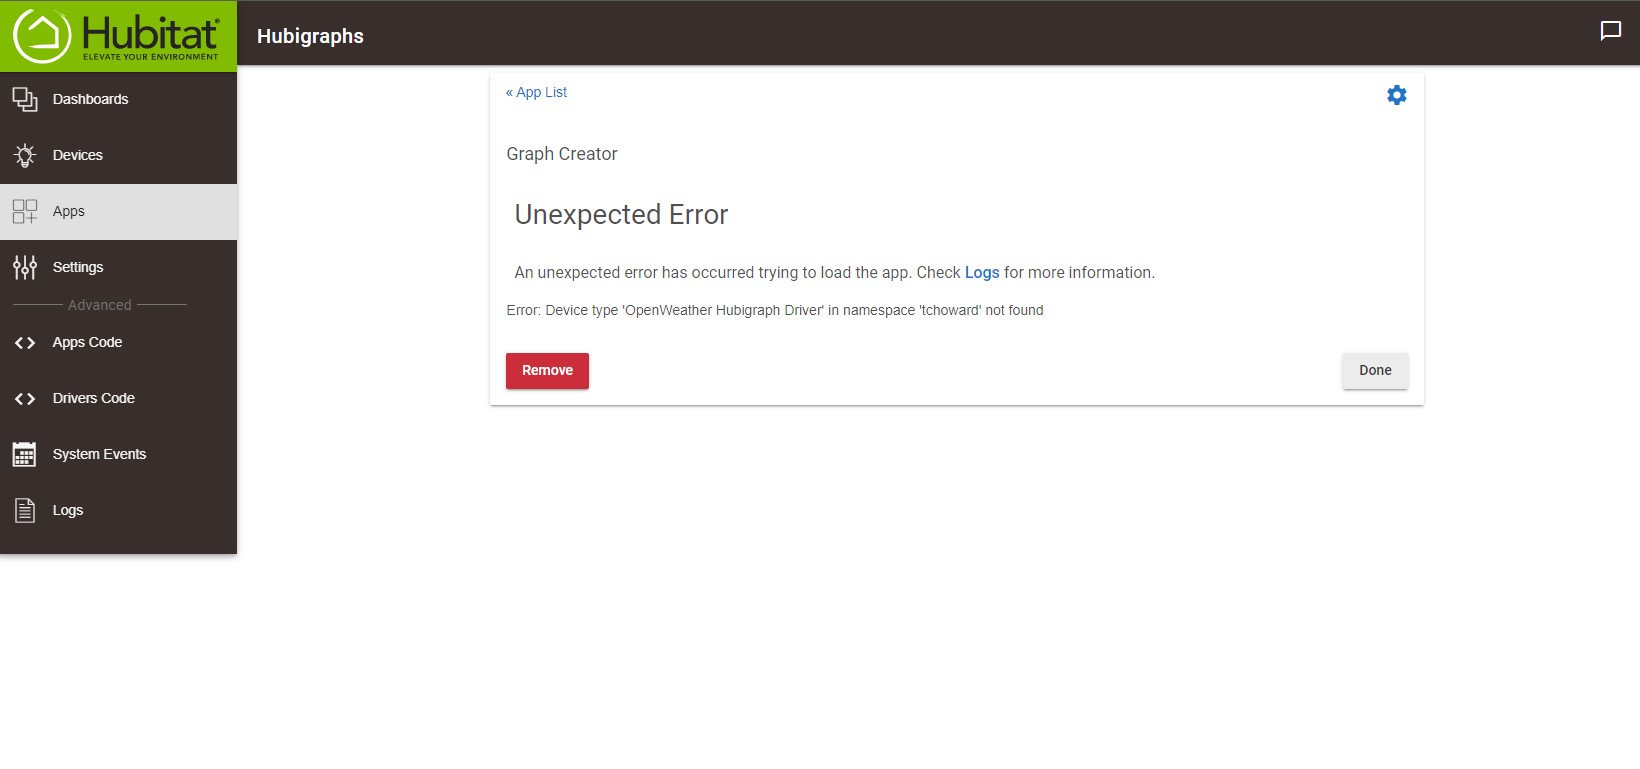
Graph Creator
Unexpected Error
An unexpected error has occurred trying to load the app. Check Logs for more information.
Error: Device type 'OpenWeather Hubigraph Driver' in namespace 'tchoward' not found
Also get these errors in the logs:
app:602020-12-16 13:44:46.018 debugthere are 0 child smartapps
app:602020-12-16 13:44:46.009 debugInstalled with settings: [:]
app:592020-12-16 13:41:23.141 errorcom.hubitat.app.exception.UnknownDeviceTypeException: Device type 'OpenWeather Hubigraph Driver' in namespace 'tchoward' not found on line 34 (mainPage)
app:592020-12-16 13:41:23.131 debugCreating Device Open Weather Child Device
app:592020-12-16 13:41:23.126 debug
app:592020-12-16 13:41:10.147 errorcom.hubitat.app.exception.UnknownDeviceTypeException: Device type 'OpenWeather Hubigraph Driver' in namespace 'tchoward' not found on line 34 (mainPage)
app:592020-12-16 13:41:10.136 debugCreating Device Open Weather Child Device
app:592020-12-16 13:41:10.131 debug
app:592020-12-16 13:40:19.843 debugthere are 0 child smartapps
app:592020-12-16 13:40:19.838 debugUpdated with settings: [apikey:XXXXX, open_weather_refresh_rate:5 Minutes, latitude:XXXXX, longitude:XXXXX]
app:592020-12-16 13:40:17.775 errorcom.hubitat.app.exception.UnknownDeviceTypeException: Device type 'OpenWeather Hubigraph Driver' in namespace 'tchoward' not found on line 34 (mainPage)
app:592020-12-16 13:40:17.762 debugCreating Device Open Weather Child Device
Yup, that answered my question. Thanks.
Hmmm... what do the logs show when you try this?
See my first post above.
Apologies @waynew ; I didn’t look that hard; you did post everything.
It appears the “OpenWeather HubiGraph Driver” was not installed. Did you use HPM to install everything? If not I highly recommend it, as the HubiGraph package requires quite a few App, Driver and JavaScript files.
I didn't realize that there were other files. I followed the Install Guide from the main post above. Sorry I'm new to Hubitat. Can you point me to the procedure, what is HPM? Should I remove everything and start again?
Many thanks.
INSTALL GUIDE
I. If this is your first time doing something like this, read through the following:
II. Install the following device drivers:
III. Install the following Apps
IV. Enable OAuth on the following Apps
- TimeLine Child App
- LineGraph Child App
1 Like
I would remove and use Hubitat Package Manager. The install guide is woefully out of date. I can help you if you prefer to do a file install. Just send me a PM
1 Like
So I set up a test tile with a temperature sensor. The graph only records 4 hours of data even though it is set up for a 12 hour day. I started at noon and it recorded that data but when I looked at 6pm, my first 2 hours of data was gone. Now at 9pm, the data starts at 5pm and nothing shows from noon to 5pm. Any ideas?
That was a good learning curve, I think we are good to go. Thanks again for your efforts with this project. I’m using this on an iPad Pro.
Yep; there are two approaches:
- Increase the number of events and states for your temperature sensor. This was an option added to the firmware a few releases ago. They also reduced the default number of events to 100 per device.
- I have added a "long-term storage" option to the setup screen. This allows you to store more events without it affecting the processing.
Make sense?
@waynew; Glad to see you got it working. I see you still have the default set up. I'd love to see what you configure it with...
1 Like
So if I keep it at 100 and add long term storage, that should suffice or is it better to increase the event number and add long term storage? What is a good number for events anyway?
Also is there a way to make the graph size bigger? I can make it wider but not taller.
Yes; using LTS seems to be a good option. It is time based, so it depends on the graph.
Not able to make it taller? Are you using Firefox? There is a known issue... if so, do a search on Firefox in this thread; I forget what the solution was....

