Hubigraphs 4.8 (The Final Chapter)

Try this in your custom CSS:

.attribute .tile-primary {
  height: 100%;
}

.attribute .tile-contents {
  display: flex;
}

.attribute .tile-primary {
  flex-grow:1;
}

I had problems, especially in Firefox, until I added that.

Also, you can limit it to a specific tile with something like:

#tile-1 .tile-primary {
  flex-grow:1;
}

which would just be in the tile ID #1 instead of all attribute tiles.

3 Likes

Thanks @BrianP, I should make an FAQ (or add the CSS to the tile builder)

Yes, Firefox so I'll try this.

EDIT: Worked perfectly, Thanks @BrianP

My Hubigraph Weather Tile has some issues

  1. I cannot edit it (there is no access within the app or on the dashboard for modifying the components) - I thought i saw a post above stating this was available?
  2. The size of the tile

    I am unable to remove the space at the bottom, and this transfers to the dashboard tile.

Thanks in advance.

So that is a Weather Tile v1. There is a Weather Tile 2.0 that allows editing... 2.0 is like v1 but with EVERYTHING

One of my “holiday” activities is to remove Weather Tile v1 support as well as Line Graphs. Too much confusion.

Figured that out just after i sent this message...
Editing works great!
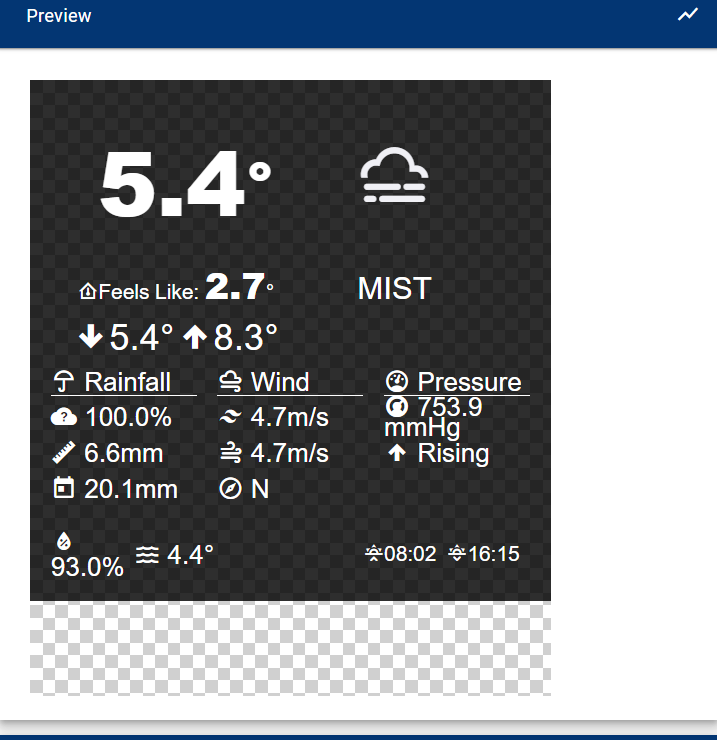
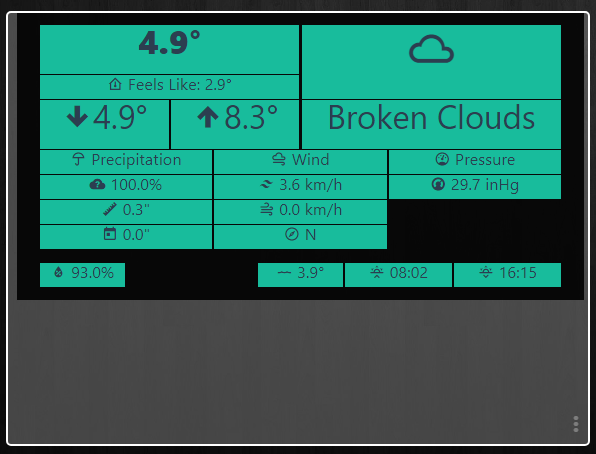
However, on my dashboard, I still have plenty of space at the bottom of the tile
image
Any way to fix that?

Are you using Firefox?

Nope. Chrome.

Hmmmm... how are you adding it to the tile? Using the attribute? Do you have any other CSS settings?

Am using smartly inject.
Will try again on a native dashboard

Yep. That did it. Smartly inject messed with the CSS of the tile.

Apologies for the question, I did try and search but couldn't find the answer? My graph only appears to show a days worth of readings even though I have set it for 3 days? Is there some kind of setting I am missing? Any help or direction would be appreciated.

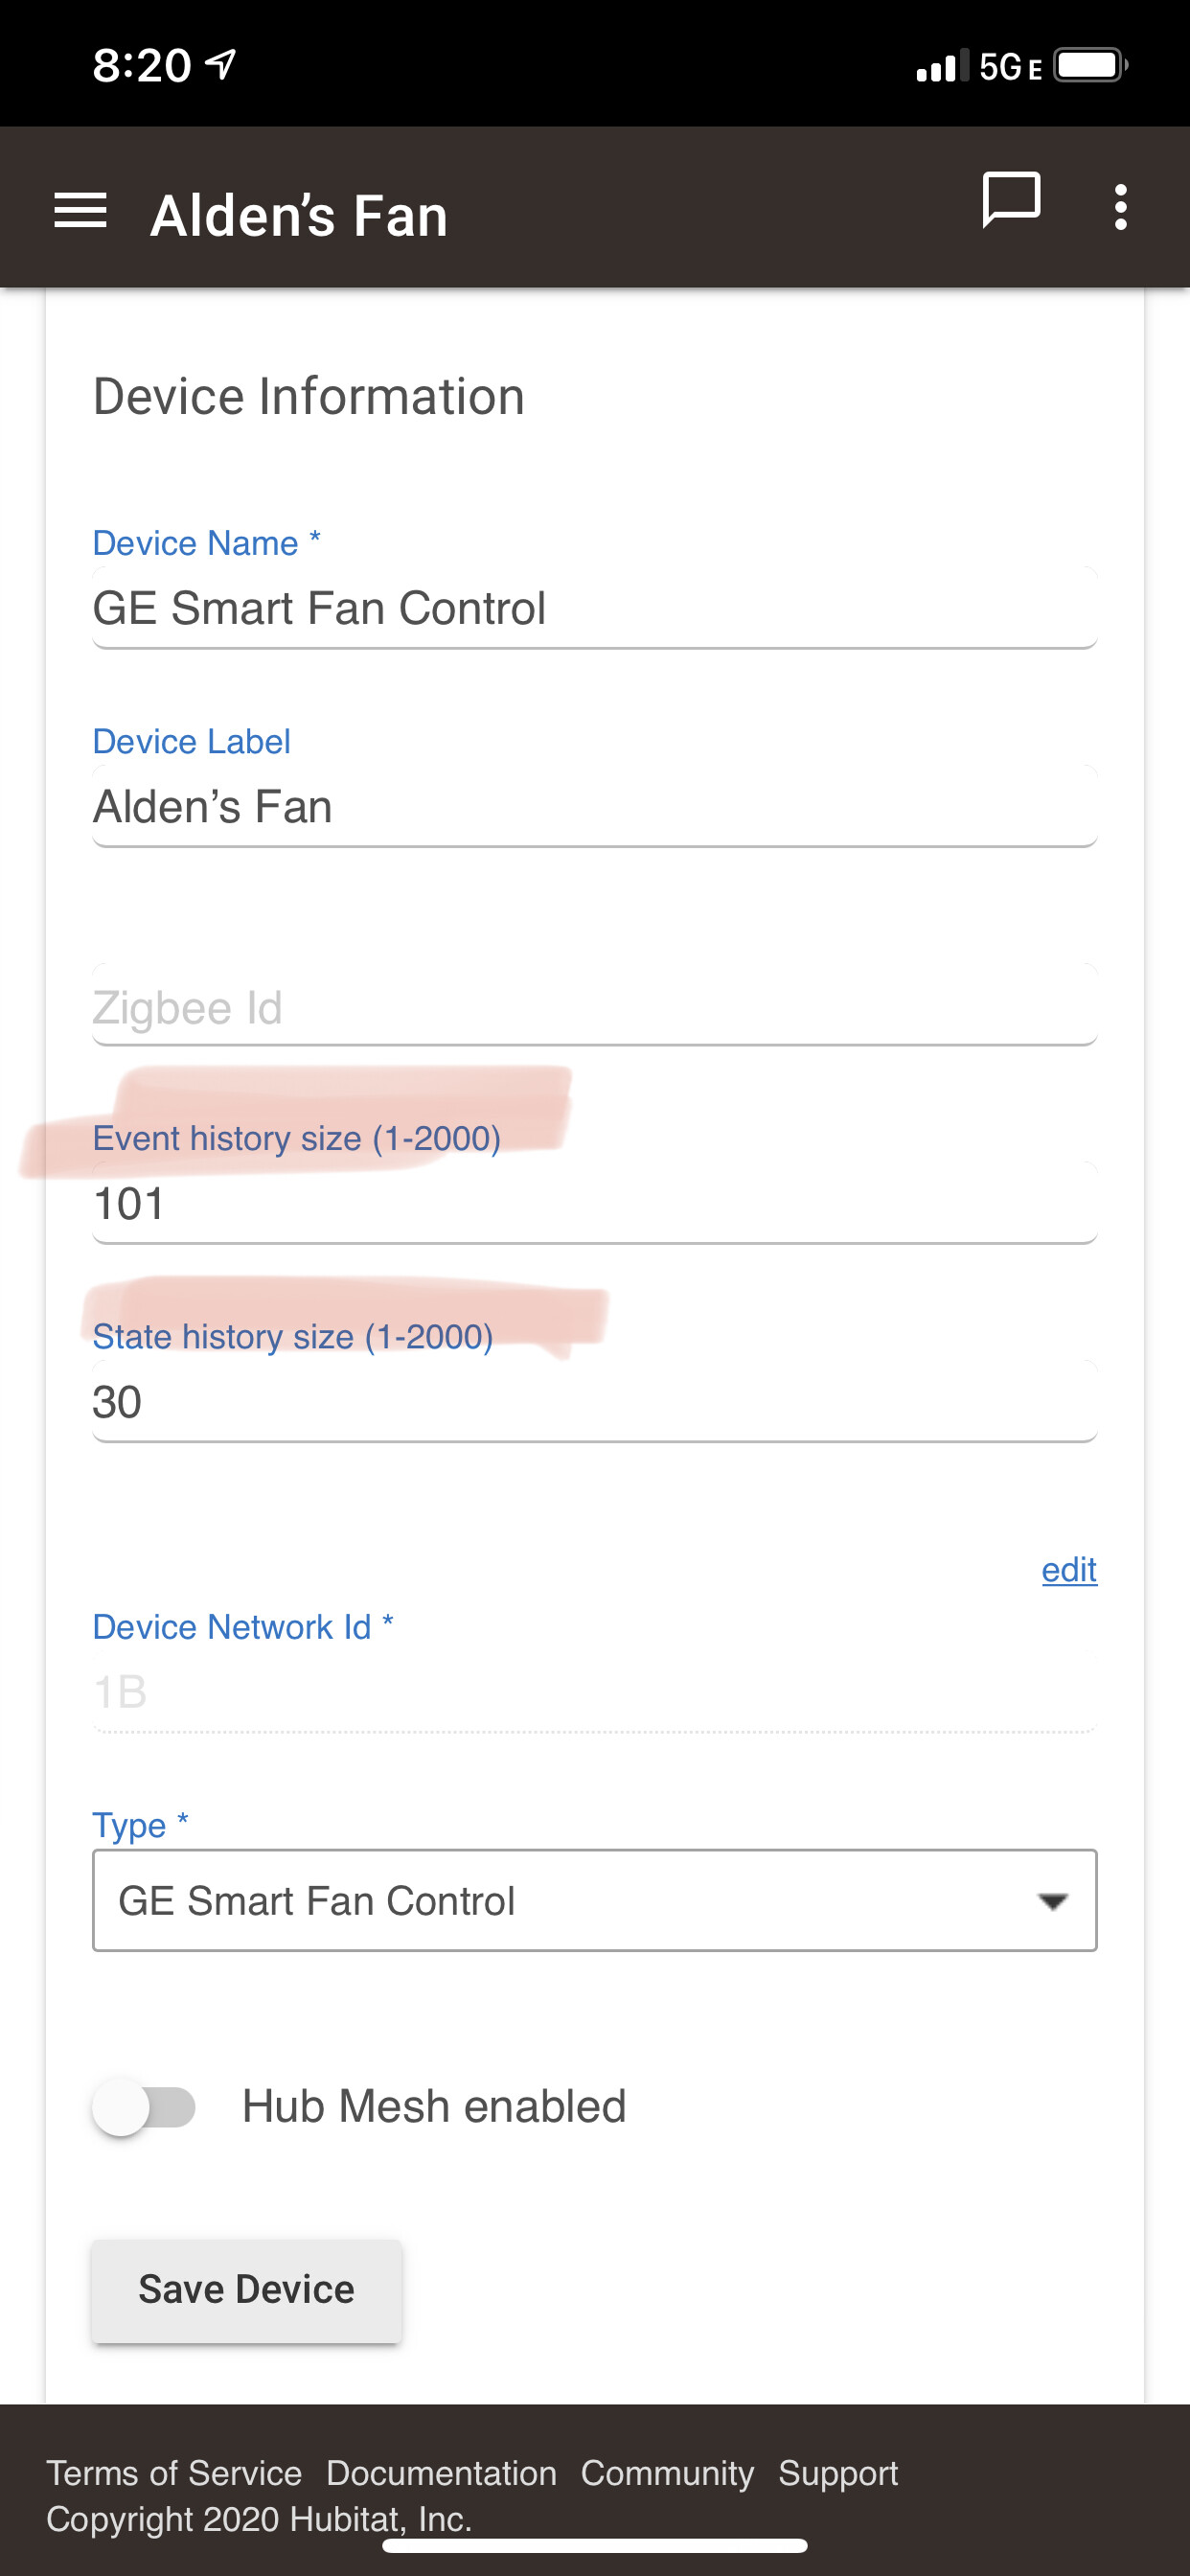
No issues; just take a look about 10 posts up :slight_smile: what you are seeing is an effect of Hubitat not “storing” 1000 events anymore. Making that change had good reasons as far as performance and stability go. It really helped the hub but “broke” HubiGraphs.

There are two “work around”

  1. Each device now has a “Event History" and "State" that is set to 101 and 30 respectively. If you change those numbers, then HubiGraphs can pull in more data without "losing it". See below.

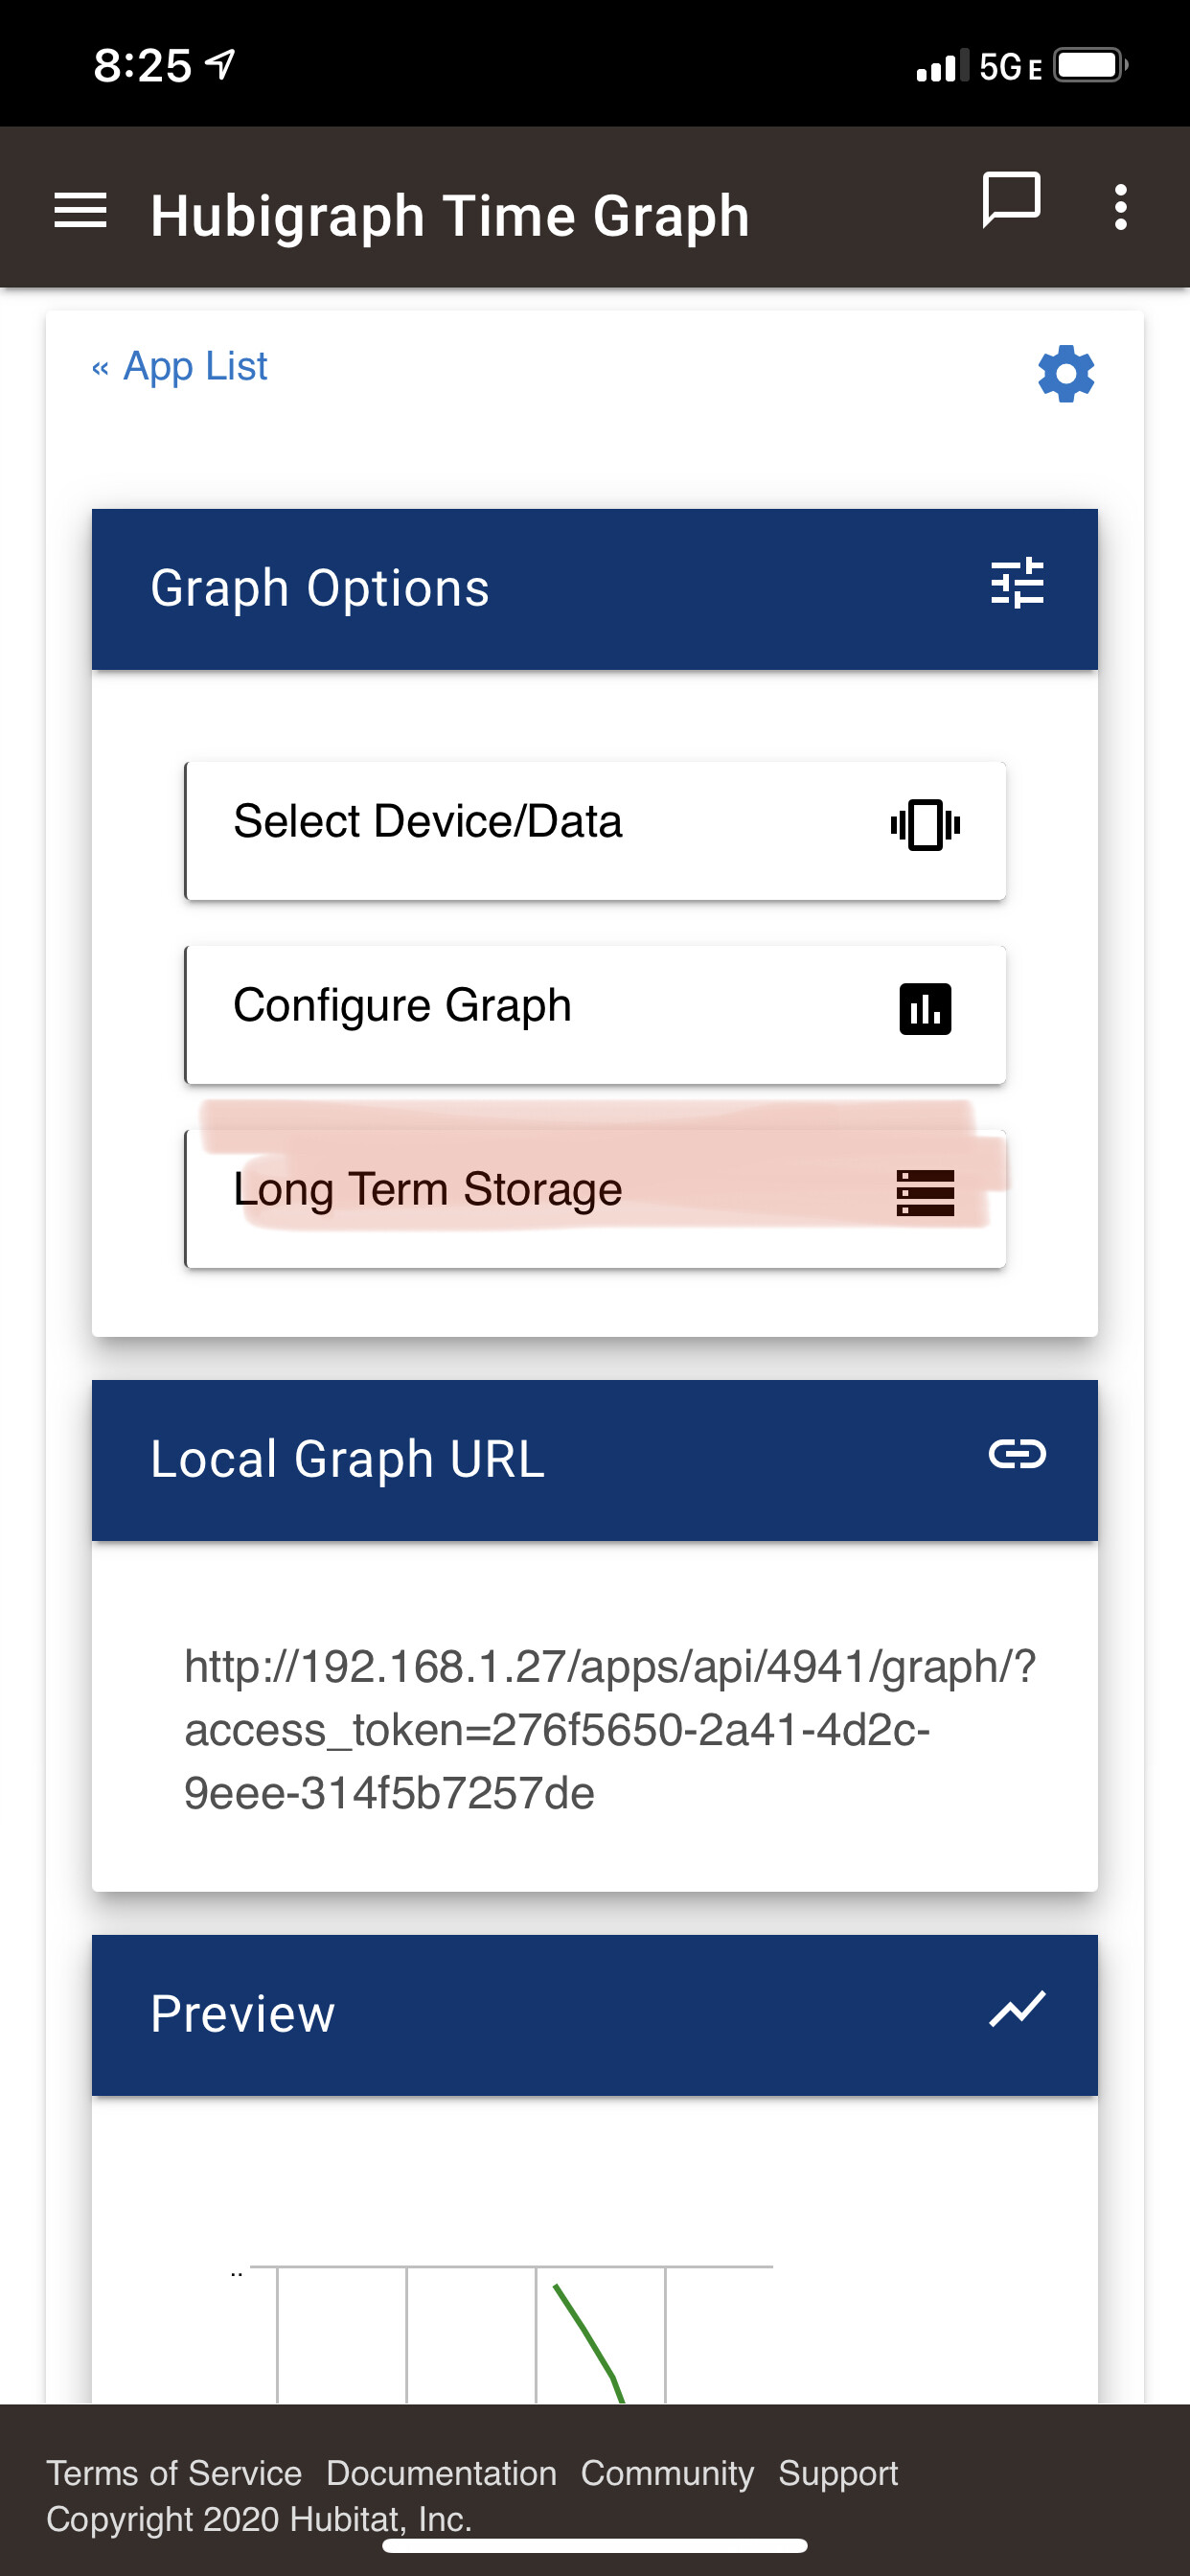
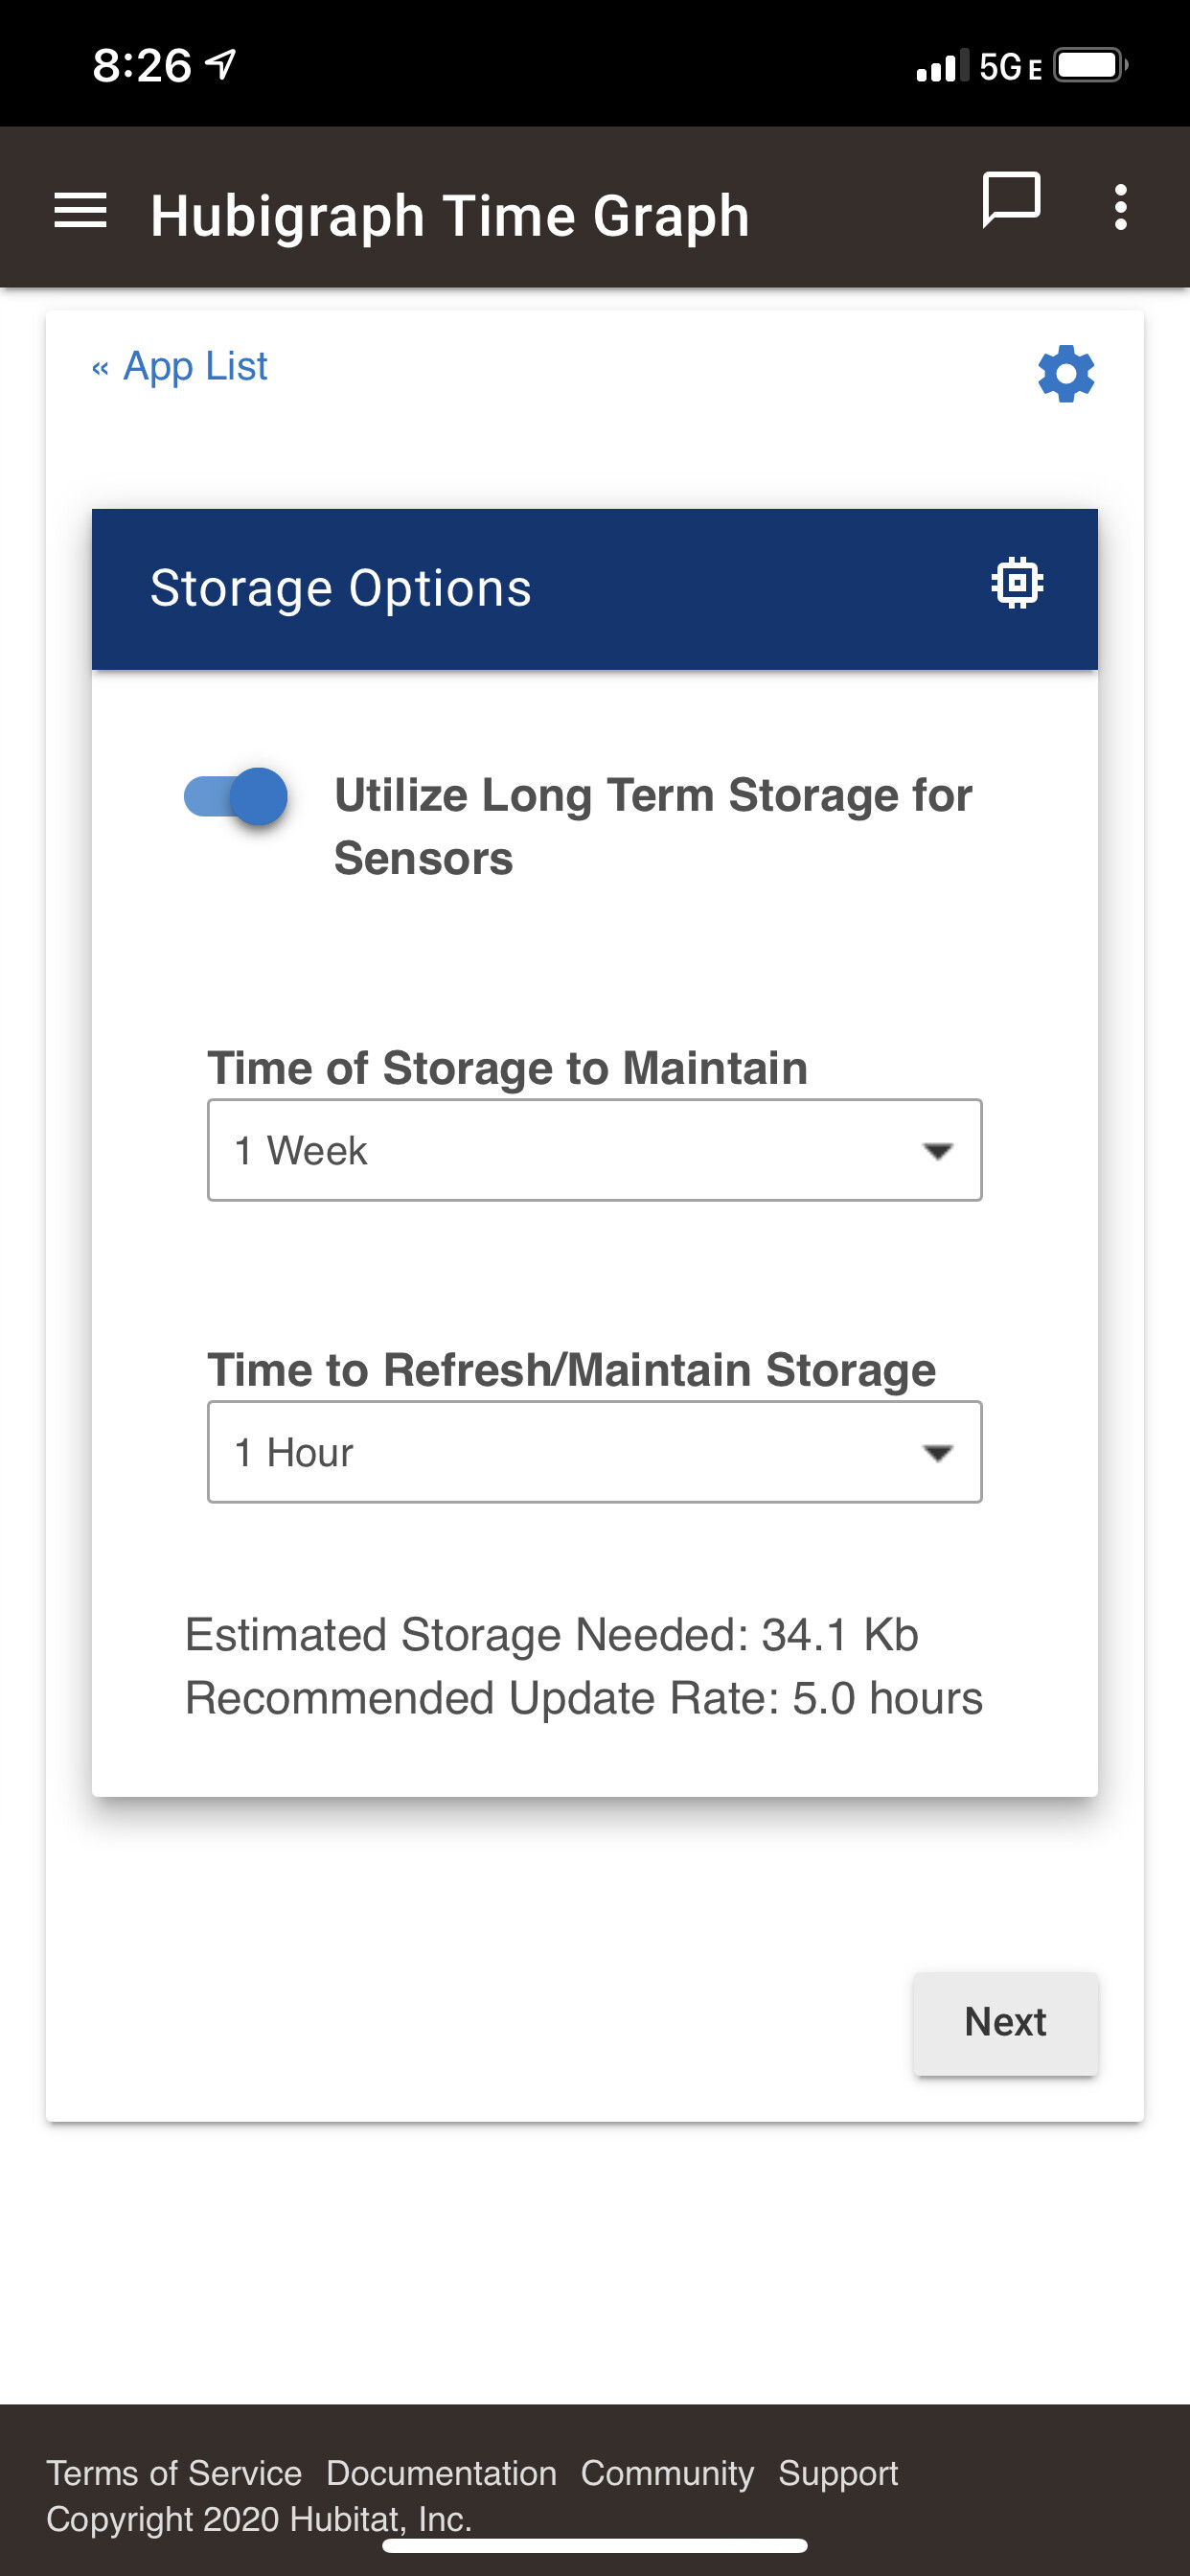
  1. I have implemented Long-term Storage (available from the Setup screen). This is, in my mind a better solution since it doesn't hit the hub performance.

1 Like

Thank you very much, will work on my searching skills!
I don't seem to have the 'Long Term Storage' button?

Are you using LineGraph? LTS is implemented for TimeGraph. LineGraphs will be removed in the next release since TimeGraphs do EVERYTHING and MORE that Line Graphs support.

1 Like

Ah, amazing. Had a few 404 errors but sorted those out. Now working, thank you @thomas.c.howard for your time and patience.

Hi, just installed 4.2 from package manager. Configured a line chart with temp data from a samsung MPS. AFAIK I configured everything in the line grpah setup page. When I try to load the URL http://192.168.1.236/apps/api/148/graph/?access_token=f8592ed7-bb70-4e9d-a7ed-59006f35c1d3

it's stuck at Getting Options 1/4.
What am I missing?

At stage 1, you should have something in the logs... anything there?

I ran into something similar, somehow managed to miss the entire "Configure Graph" step... :roll_eyes:

Configure

Odd, today it's working... I went through all Hubigraph apps and clicked OAuth -> Update. Not sure if that was it.

Now I want to have my charts in a dashboard inline. I have added a tile to a dashboard with Link. Link: http://192.168.1.236/apps/api/154/graph/?access_token=bf6c9367-xxxxxxxx-xxxxx-48c4bbe0a4f3

Now the Dashboard shows a tile with the Title and I have to click on it to see the graph.
How do I get the graph to show inline directly on the dashboard?