Hi @christian.busch
You may want to blank out your access token.
I’ll take a look. There is a typo on line 944. Set your Longterm storage to something other than 5 minutes. That will fix it until I upload a fix.
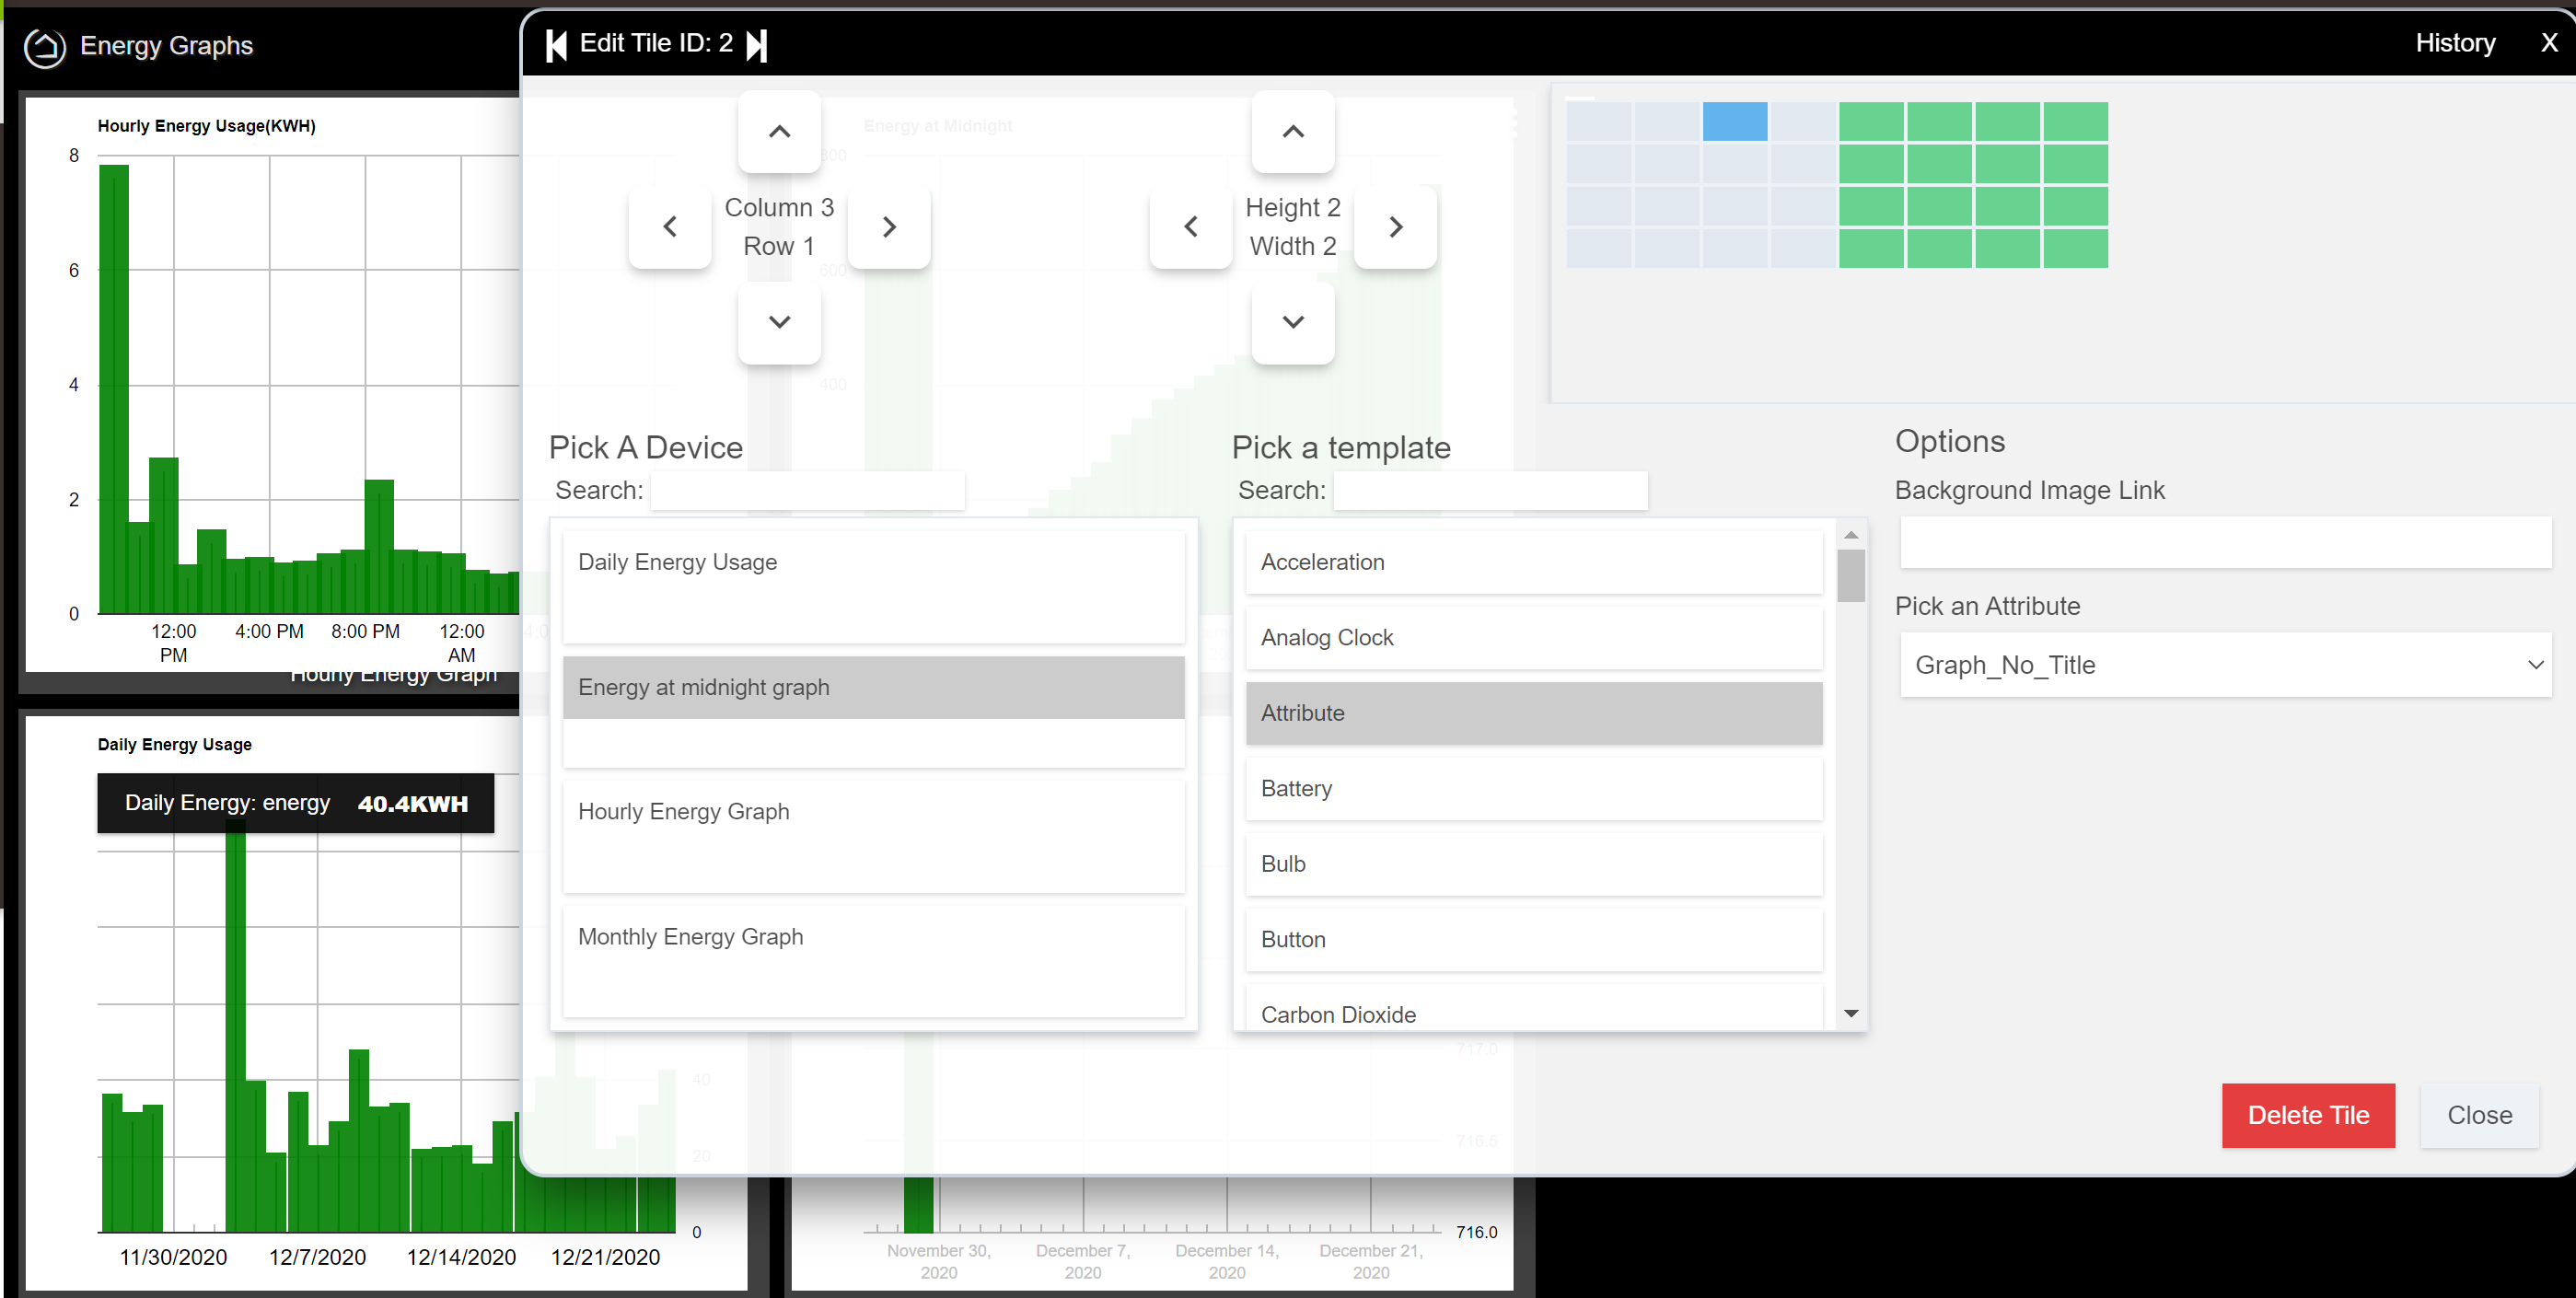
How do I add a graph to the dashboard to show the graph directly in the dashboard?
There is a slider labeled Hubigraph tile installation, turn that on. Then a device is created that can be placed on the dashboard. Monthly Energy Graph in this case
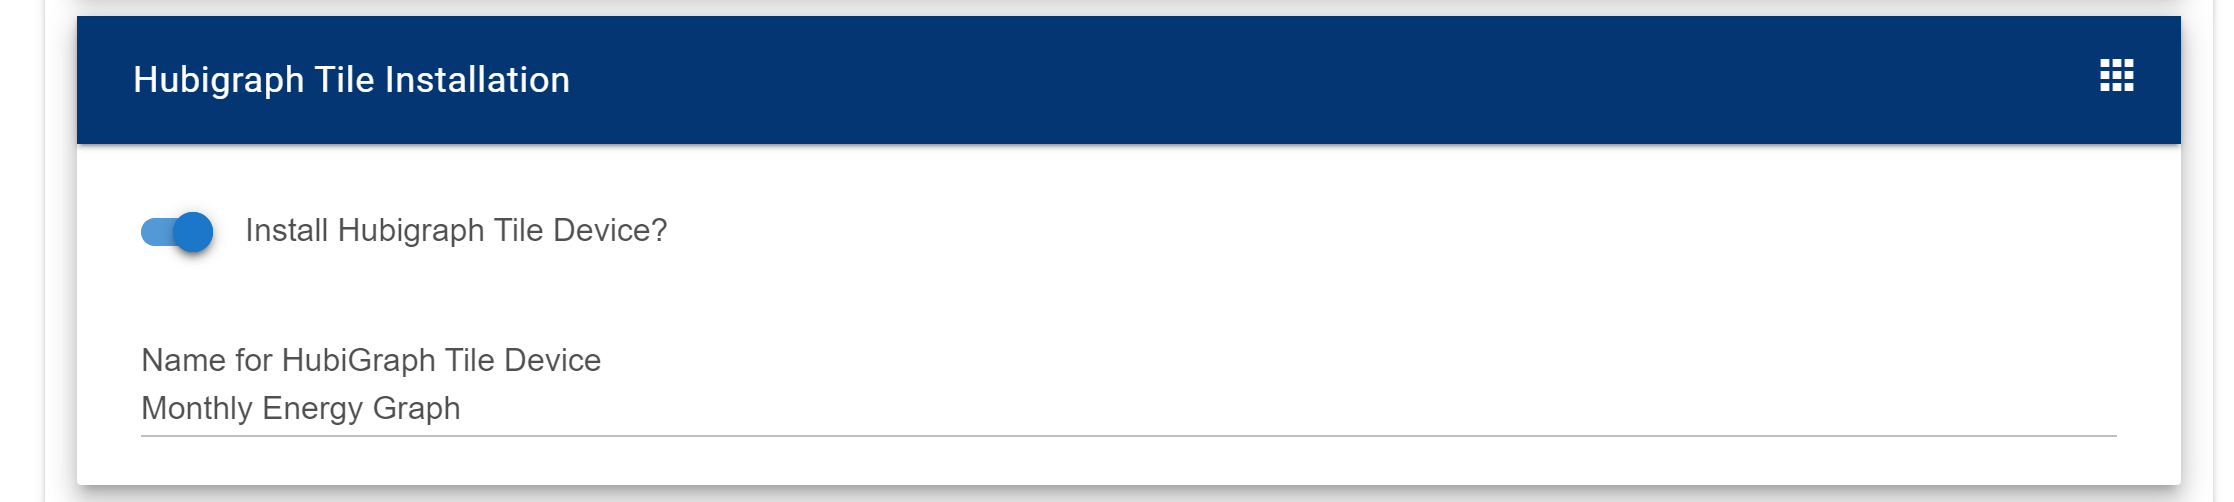
Then add that device to you dashboard using attribute as the template. Then pick an attribute over to the right.
2 Likes
Tried to install your app from HPM. Got error installing (see logs below).
Any ideas?
app:412020-12-24 08:51:48.704 am infoFatal error occurred, rolling back
app:412020-12-24 08:51:48.698 am errorError installing file: groovyx.net.http.HttpResponseException: Server Error
app:412020-12-24 08:51:48.609 am infoInstalling https://raw.githubusercontent.com/tchoward/Hubitat/master/HubiGraph.js
app:412020-12-24 08:51:48.406 am infoInstalling Hubigraph OpenWeather Device
app:412020-12-24 08:51:48.254 am infoInstalling Hubigraph Tile Device
app:412020-12-24 08:51:45.715 am infoInstalling Hubigraph Weather Tile 2
app:412020-12-24 08:51:44.882 am infoInstalling Hubigraph Radar Tile
app:412020-12-24 08:51:43.314 am infoInstalling Hubigraph Forecast Tile
app:412020-12-24 08:51:41.733 am infoInstalling Hubigraph Weather Tile
app:412020-12-24 08:51:40.111 am infoInstalling Hubigraph Heat Map
app:412020-12-24 08:51:37.286 am infoInstalling Hubigraph Time Graph
app:412020-12-24 08:51:35.783 am infoInstalling Hubigraph Bar Graph
app:412020-12-24 08:51:34.033 am infoInstalling Hubigraph Range Bar
app:412020-12-24 08:51:31.896 am infoInstalling Hubigraph Time Line
app:412020-12-24 08:51:29.774 am infoInstalling Hubigraph Gauge
app:412020-12-24 08:51:25.025 am infoInstalling Hubigraph Line Graph
app:412020-12-24 08:51:21.282 am infoInstalling Hubigraphs
app:412020-12-24 08:51:20.966 am infoDownloading Hubigraph OpenWeather Device
app:412020-12-24 08:51:20.698 am infoDownloading Hubigraph Tile Device
app:412020-12-24 08:51:20.325 am infoDownloading Hubigraph Weather Tile 2
app:412020-12-24 08:51:20.036 am infoDownloading Hubigraph Radar Tile
app:412020-12-24 08:51:19.747 am infoDownloading Hubigraph Forecast Tile
app:412020-12-24 08:51:19.390 am infoDownloading Hubigraph Weather Tile
app:412020-12-24 08:51:18.983 am infoDownloading Hubigraph Heat Map
app:412020-12-24 08:51:18.582 am infoDownloading Hubigraph Time Graph
app:412020-12-24 08:51:18.219 am infoDownloading Hubigraph Bar Graph
app:412020-12-24 08:51:17.855 am infoDownloading Hubigraph Range Bar
app:412020-12-24 08:51:17.508 am infoDownloading Hubigraph Time Line
app:412020-12-24 08:51:17.149 am infoDownloading Hubigraph Gauge
app:412020-12-24 08:51:16.793 am infoDownloading Hubigraph Line Graph
app:412020-12-24 08:51:16.345 am infoDownloading Hubigraphs
app:412020-12-24 08:51:15.969 am infoDownloading https://raw.githubusercontent.com/tchoward/Hubitat/master/WeatherTile2.css
app:412020-12-24 08:51:15.646 am infoDownloading https://raw.githubusercontent.com/tchoward/Hubitat/master/WeatherTile2.js
app:412020-12-24 08:51:15.336 am infoDownloading https://raw.githubusercontent.com/tchoward/Hubitat/master/WeatherTile.js
app:412020-12-24 08:51:15.032 am infoDownloading https://raw.githubusercontent.com/tchoward/Hubitat/master/HubiGraph.js
app:412020-12-24 08:51:14.764 am debugInstall beginning
Mike:
Did you ever get this resolved?
I am having the same issue.
This is an HPM issue; do me a favor, post this question over there? The specific issue is that when it goes to load the “local storage files”, it fails.
Sorry but I removed HPM and reinstalled for the 3rd time and it worked just fine. SOOOO it was something I was doing in the HPM install.
Thanks for the response
Your App is amazing!!!! It completely solved the problem of trying to set up InfluxDB and Grafana in the cloud. I wish you had a link where I could tip you or "Buy you a coffee".
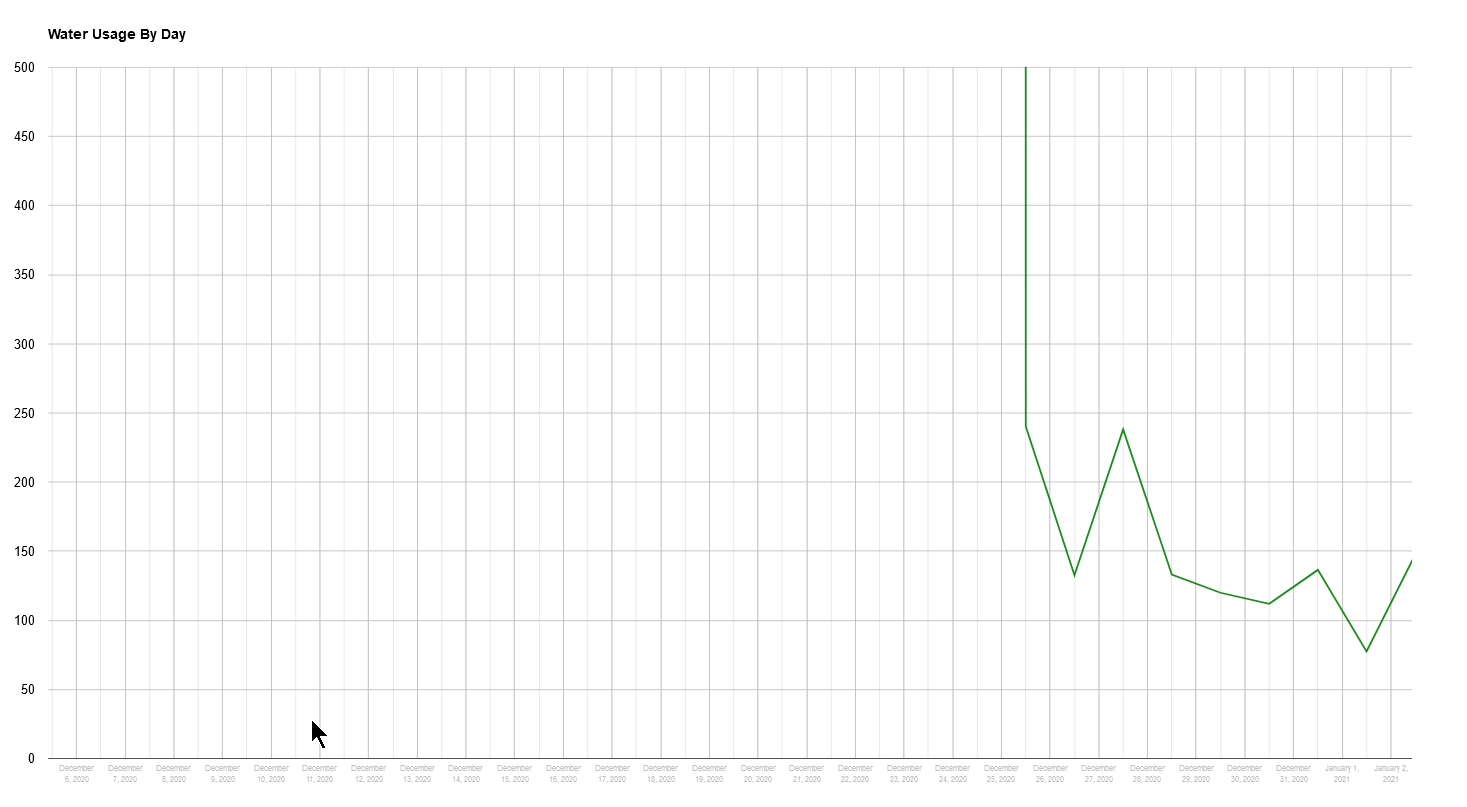
is there any way to edit the data...I somehow got an entry that said I used 250000 gallons of water in a day....so the graph blows up.
I did change the x axis to 500 max which helped but just curious if i can fix that point
also I only have data for a week and this has been running for a long time
@tim.ocallag - Please update to release 4.41. Time Graphs now has an option for each device to "Restrict Displayed Values". This will allow the user to set a Min and Max threshold. All values received not in that range will be "tossed". Enjoy, and please let me know it it fixes the issues.
1 Like
Thanks that did resolve the large value...regarding only 1 week.....did the 1 bad value cause older samples to get discarded ? I'm setup to display a months worth of data
No; I added the change to only affect the raw data collection. The single "bad" point is removed...
New Hubitat user, (been using ST for years). Your app looks interesting but have been unable to get it to install. Tried HPM and it failed with error below. Tried manual install and it did not work. Removed HPM, local files, rebooted, installed HPM, and tried from there and failed as well. I have scanned through this blog and have not seen something that works for me. Ok, I did not read all 1134 postings, but tried to scan them best I could.
Any suggestions? I lost the link to the manual install info, if someone could post that here that would be much appreciated.
An error occurred while installing the package: Failed to install file https://raw.githubusercontent.com/tchoward/Hubitat/master/HubiGraph.js. Please notify the package developer..
1 Like
Hi @thomas.c.howard ,
First THANK YOU for the work you and your son have put into this. I read from top to bottom yesterday and have really enjoyed the journey and humor along the way. Both my son and husband are (not) fans how you have taken such good care of your wife's requests/desires, and are making them look bad 
As of this morning, I am past installation and playing with Forecast Weather Tile2 first.
My question is... what do you think would be the best way to work with multiple locations?
I have a summer home, so like to keep an eye on things in both places (tornado-possible) no matter which place I am actually "living" at that moment.
Would it be best to install "all this" also on the other hub in the other location and set its location to that other place, and its Forecast for that location... or would it be better to beg the developers to allow the option to set a 2nd additional optional location for each installation and set a variable in the Weather Tile2 to pick which location each tile should represent?
Second concern if option 1 above, would I be able to see them both from "the other place"?
Disclaimer - Being very new to Hubitat - early stages of transition from mostly Wink and being "COVID locked down", I have only set up one Hub over the last few weeks so far, another is still in the box ready for the next road trip, and not quite sure how these things will play together, so keep that in mind. I managed it with Wink so feel confident I can get there
Thanks in advance for input/advice, and really looking forward to playing with your other developments. I am sooo a chart/graph/spreadsheet nerd.
Carla -
Carla -
Interesting questions. It would be relatively easy to add in multiple locations. One concern there is how OpenWeather operates. Each call to their API counts towards the 1,000 calls/day. That is the reason Weather Tile 2.0 had an "overall OW instance". This way you could have many tiles (like I do) with only calls to OW every 5 minutes. Now, that being said, I see an easy way to make this work:
- Set up an additional instance of HubiGraphs. Hubitat lets you do this (just "Add a User App" and select Hubigraphs, again) and the second instance could have OpenWeather set to your other location.
- I have not set up renaming (yet) so you'll have to be careful about which instance goes to which location.
- Keep in mind that each instance of HubiGraph will call OpenWeather so just keep it to less than 1000/day
Seeing them from both location depends on wether you have your devices on a VPN. That is a whole different conversation and if I can expose HubiGraphs to the outside world. I'll ask my son to take a look...
Make sense?
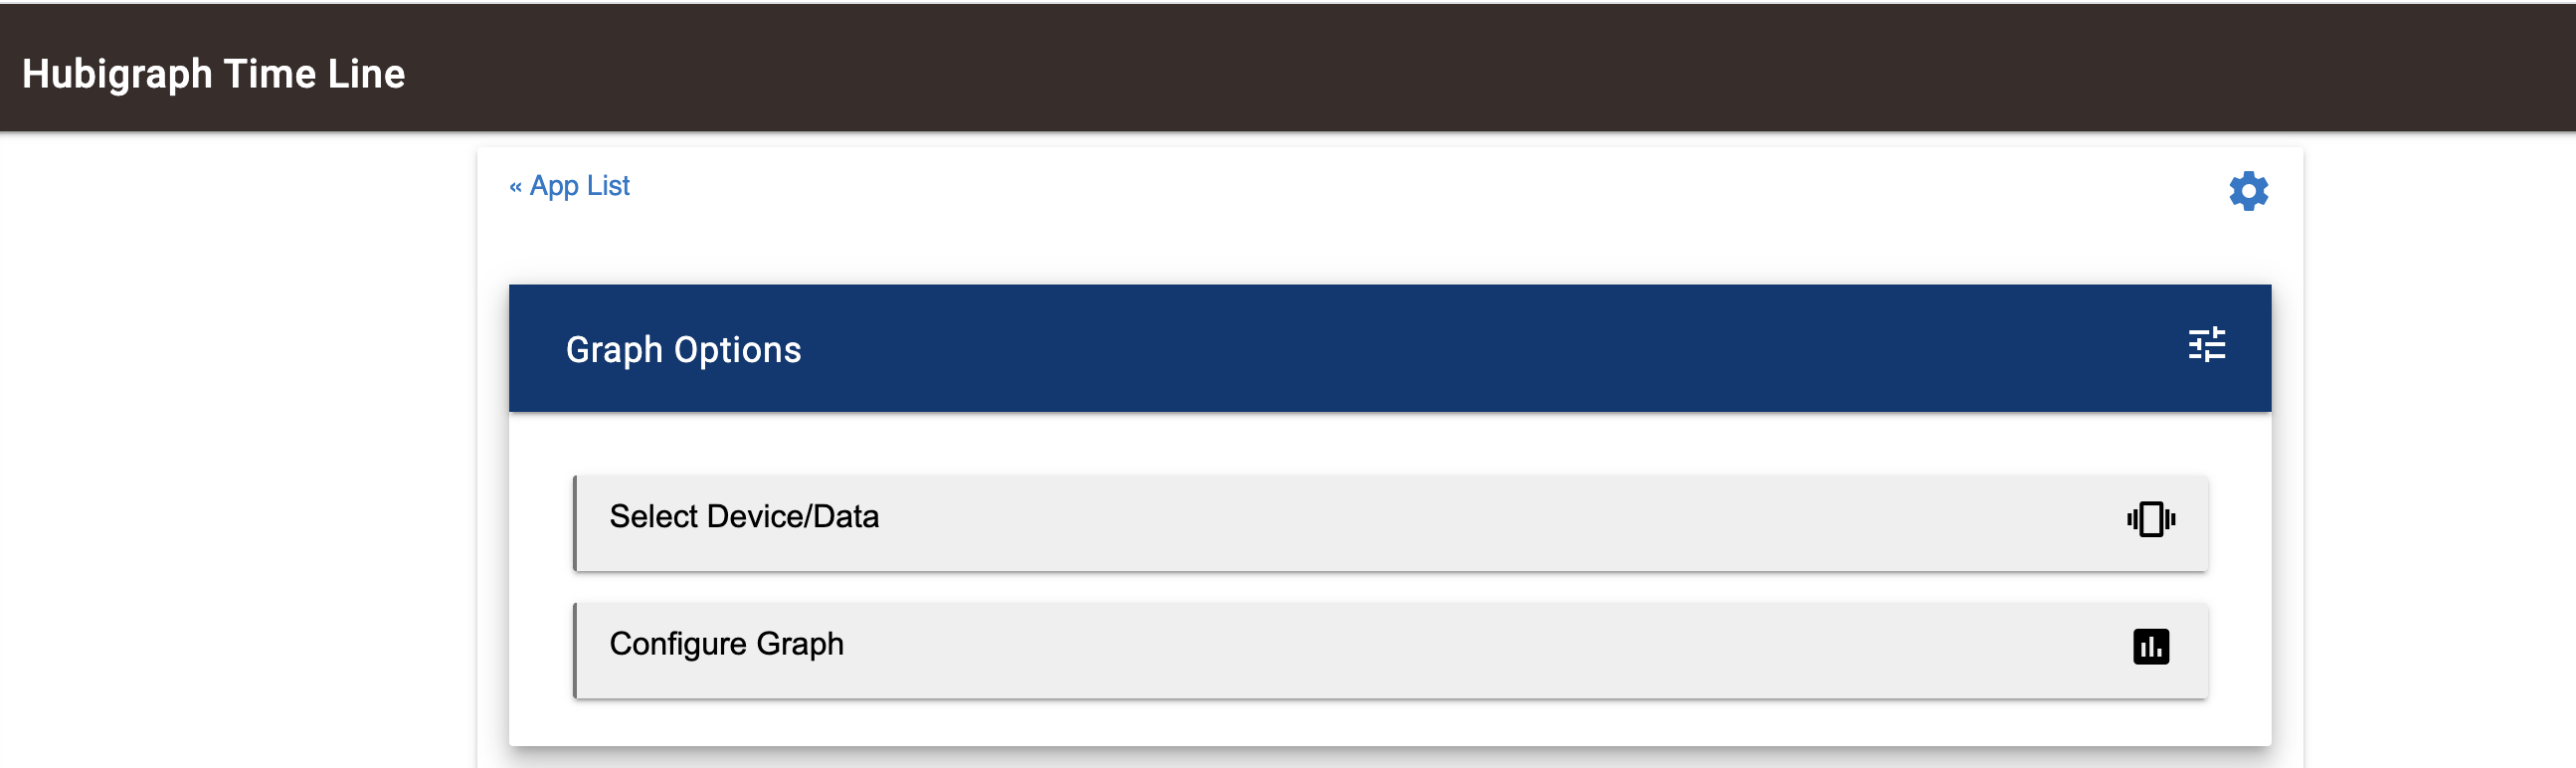
I noticed my Hubigraph "Time Line" graph is now missing data, per the event/state history reasons discussed above.
I'm using the Time Line graph (not deprecated LineGraph), because it allows me to make a bar chart of my motion sensor states like this:
I understand LineGraphs do not have Long Term Storage, and I see the option for Long Term Storage with a Time Graph. But I didn't see the Long Term Storage option for a "Time Line". See screenshot Should it be there?
Alternately, is there a different graph that offers Long Term Storage that provides state history plot like above?
@tzoom, There is no LTS implemented for Time Lines... Let me see what that will take to bring in.
Right now my dev hub is rebooting. I did something bad implementing a Denon AVR driver....
Thomas,
Yep that makes perfect sense. Thanks for the detailed response.
I blindly sort of went down the route you have suggested, I just didn't think about installing a whole new "all of HubiGraphs".
When I first started playing I accidently set up it up in the Weather Tile 1.0 (its closer to the top) ...but having read your novel, I remembered you repeatedly saying the "fix" to most concerns is "Don't use 1.0" (see I was listening ) so I quickly hit delete, delete, delete and ran away screaming and covering my head.
I currently have 2 Weather Tile 2.0's, showing exactly the same info, which of course is when the Weather Tile 2.0 & consolidation chapter of the journey came flooding back and I said "well duh - he said that was coming" and TOTALLY makes sense why.

The end result for me would be basically the same...kinda, except for having two separate piles of Hubigraph stuff as opposed to one with 2 potential locations.
Have you or your wife ever considered thinking about a time share somewhere??
I could be wrong but I think calls to OW can include multiple locations to reduce the number of calls depending on how you need it back.
*EDIT -*On the sentence above, my OCD research says, while combining is potentially possible, wouldn't reduce the count of the calls. Multiple locations still are counted as individual calls.
Regardless, of method ... if I only ever have 1 hub, 2 locations, then 2xs the calls. If I have 2 hub, 2 locations, 4x the calls, all going toward that 1000/day limit.
I built me a "Magic Mirror" using a rpi a few years back for my morning warpaint routine that also uses OW, and basically within the same block of the screen, it alternates the two locations - I am spoilt, but do remember initially bumping the limit during that build so I can work out that math.
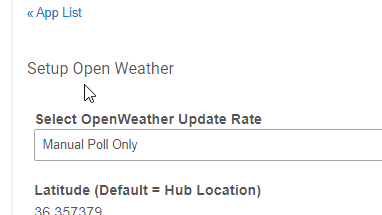
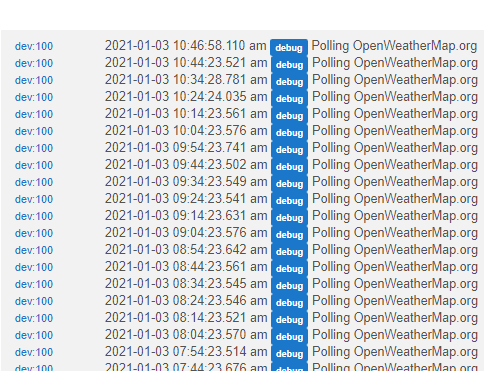
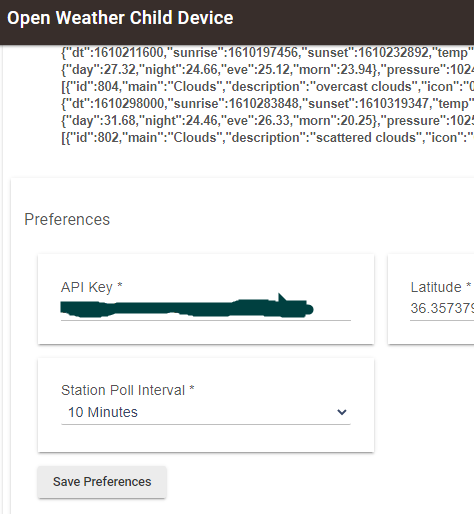
I set my Open Weather (1 instance of HubiGraphs) polling to "Manual Polling Only", just because I was playing so much and I noticed it is still polling every 10 min. Is there more than one place that this could be being triggered? I checked all of my Weather Tile 2.0 and all are set to update every half hour.
Looks like I can change it in the "Open Weather Child Device", but wanted to share with you in case I did something wrong in set up.