No, 1.1.1 is the latest. It's recommended to use the Hubitat Package Manager to automatically receive updates when available.
I've just installed with HPM and I'm getting an error logged and the report is null. I rebooted the hub and it didn't help.

EDIT: Found my mistake [RELEASE] Hub Watchdog - Simple way to monitor if your hub is slowing down or not
@losinit Assign a device you want to test with or a virtual device to test hub responsiveness.
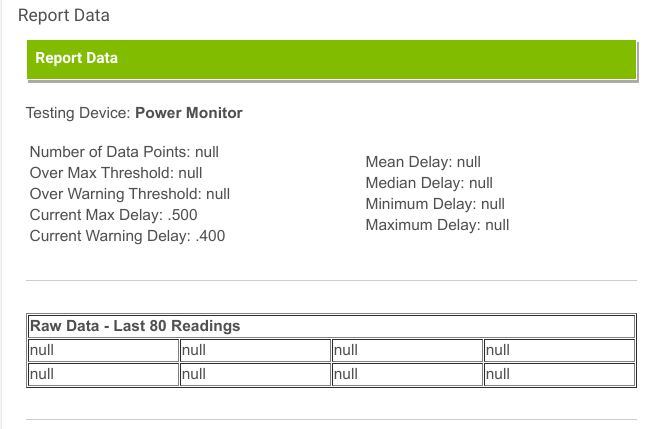
I did, it's the Power Monitor (which is a ST plug-in switch) in the top pic. It's here in the room with me and it is being cycled as was described. Have I missed something obvious AGAIN?!
Thanks for helping, @lewis.heidrick
1 Like
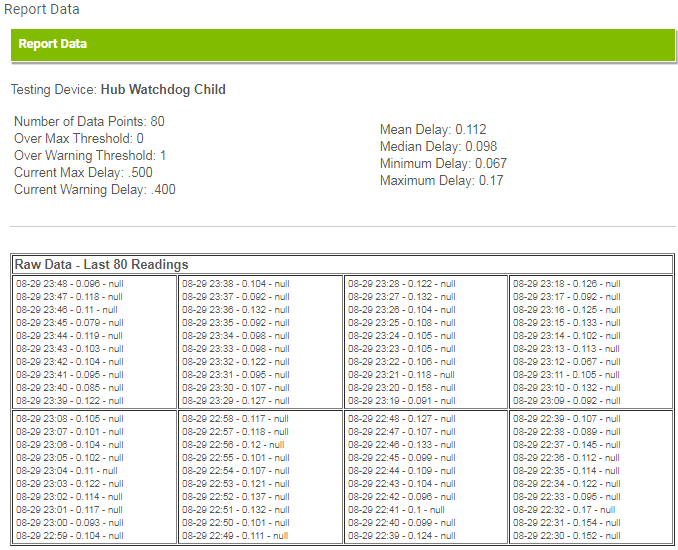
My glossing over the Data Device creation was the problem. All good now.
My thanks to @lewis.heidrick for his time and assistance.
2 Likes
I just installed this as I'm curious to see what my hub is up to. Behaving I hope.
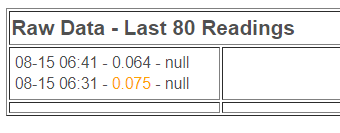
Ok, I got one virtual switch configured... quick question. What's the null in the value below?
You need to name your types in the data device.
1 Like
I'm late to the party on this app, but wanted to say thank you to @bptworld. This app rocks! I'm on a C4, and while I don't have any performance issues now, I wanted to do some benchmarking before I upgrade to 2.2.3. I really like your approach here.
3 Likes
Is there any way to disregard outliers when it comes to looking at the Examiner Child, or maybe a way to manually change the scale on the graphs?
Nope. It's been fine the way it is for over a year. ![]()
![]()
Yeah that is fair, just wanted to see the trendline, but a single 30 second value blows out all of the resolution sub 1 second, where it usually lays for me.
I'd try to figure out what is causing the 30 second problem. My highest since the upgrade is .241
It's not a common thing, like sometimes there are just outliers, then the next test is back to normal, but it screws up the graph regardless. Also is that highest latency for you Z-Wave, Zigbee, or Virtual?
Zwave, virtual highest is .074. for some context I have about 150 devices. About 10 of those are zigbee, another 38 are from my envisalink, about 10 virtual and 6 wifi. My mesh has been changing a lot though with me testing for other users the count is approximate.
Yeah my virtual switches usually hang around the sub 0.1 second mark except for the outlier and my Zigbee usually hangs around the 0.3 second mark.
All my zwave are 500 series plus except 2 which are 700.
I haven't checked my zigbee. So no clue on those but they seem as fast as everything else. When not testing I usually only have app event logging on everything else is turned off logging wise. I only have a 5 minute presence refresh on life360 and a 1 minute refresh on sleep number bed presence. Every other rule is event driven. After I make a big change I use this app to make sure I didn't do something stupid.
I just installed this today and am missing something seemingly basic.
Here's my setup:
Virtual Device

App

The Hub Watchdog Child has a lot of data points on the virtual device. I'm not sure what to do with the Examiner Child. I set it to the virtual device and also a real switch, but it is not getting any data points.
My questions are:
- How do I view the graphs?
- What template do I use when making a tile to see some data?
Thanks all

