I set some general stuff for 5 mins, but other things like ip address' , z-wave version, zigbee channel, and what not for 12 hours.
4 Likes
Quick question:
In the hub information Details from the Device > Current status
I get an entry that is * cloud : invalid endpoint
I get this on both of my hubs. What does that mean? I don't see any issues, but is this something I should be concerned about?
It’s saying that the cloud endpoint provided isn’t a valid cloud dashboard or MakerAPI link. After you turned the option on did you go back and give it an endpoint to check?
2 Likes
I haven't looked into this yet, mostly since I haven't had any more problems, knock on wood.
However, would this also test if the modem/router is connected to the internet?
I can see an application where the hub could power cycle the modem/router if it needed to.
(My situation is complicated by the 12/5 vdc battery backup, that's for another thread.)
Doesn’t directly test the gateway (usually the router), but the cloud check can’t be successful if the internet can’t be reached. Theoretically the DNS test could come back good if you have a local DNS server even if the internet was down.
1 Like
I'm sorry about that. I never even saw that setting in the device settings before. In fact I passed that setting like six times and still didn't see it. Thank you for getting back to me and now it says connected. Thanks again.
1 Like
I need to work on the UI there a little, I hide the field if it isn’t needed but it blends in too well when it is exposed - might see if I can add some color to it until filled in. Glad it’s working now.
Hello.
Is this anything that I should be worried about?
(Device 4548 is the Hub Information Driver device)
Nothing to worry about unless you see it continuoisly, just saying that the hub was busy and didn't answer the request that time through.
1 Like
Hi @thebearmay,
I have a Raspberry PI I would like to monitor the same way as I am doing with your hubinfo driver. Mainly for Temp and CPU usage.
I have node red installed on this RPI an using 'node-red-contrib-cpu' palette I am able to poll these attributes.
I am currently using a flow in NR to setTemp in a virtual temp sensor device (using Maker API) but it seems like your driver can hold all attributes I am interested in it makes sense to use it but it seems that when creating a new device using your driver it automatically connects to the hub it is on.
So I guess my question is - can I use your driver to create a virtual device to collect data from other sources than the hub itself.
Hope it makes sense or can you suggest a better way?
Thanks
Should be able to create a virtual Pi Information device without too much effort. What attributes do you want to track from the Pi? Couple of ways to get the data in, one thought is to send over a JSON string with the attributes to be updated and use a single command, another would be a command for each attribute.
1 Like
CPU usage and Temp (in C)
At least for now 
Many many thanks
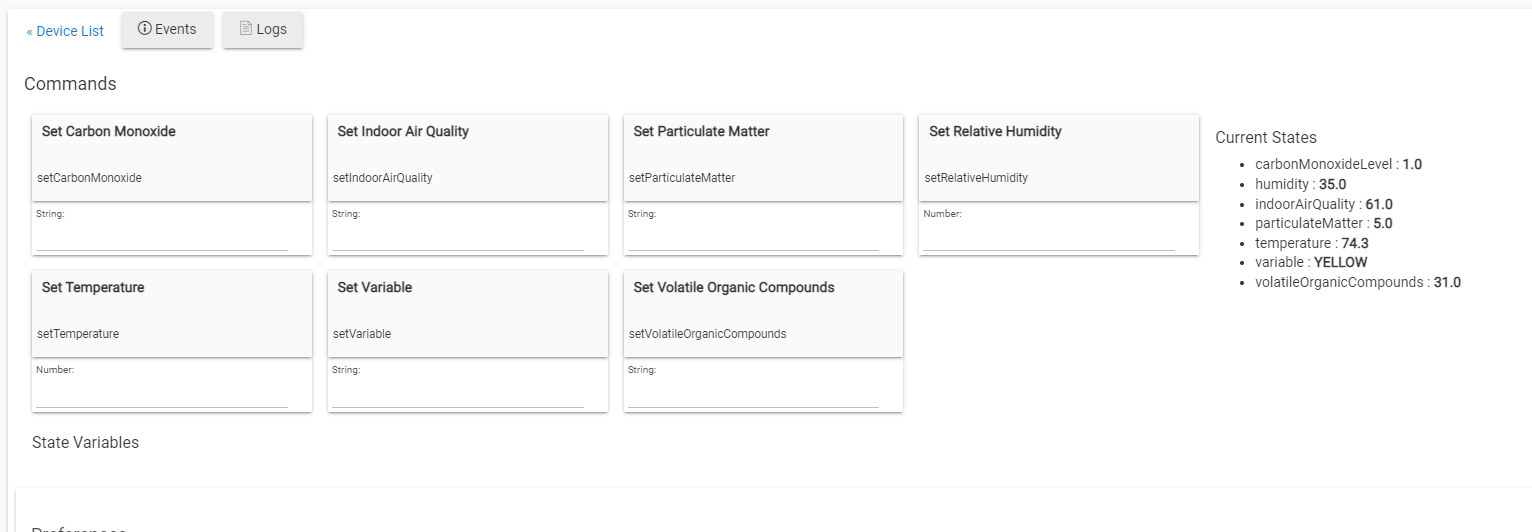
If you create a virtual Omni Sensor in HE, you can easily transfer the temperature of the RPi to the Omni Sensor's Temperature field using Node Red. What are the units of CPU usage? A percentage? If so, you could save it in the Humidity field.
If you are feeling adventurous, the code for the Omni Sensor is available and you can tweak to exactly match the characteristics you are pulling from RPi in Node Red. I do similar and created a Virtual Alexa Air Quality Monitor that pulls data from the actual monitor using Home Assistant.
1 Like
Have you looked at: node-red-contrib-device-stats
Not that I remember. Will have a look tonight. Thanks
@amithalp when you do, might also want to look at [RELEASE]Node Red Server Information Driver
1 Like
Also found this one - node-red-contrib-os.
Will test the new driver and let you know.
Every team needs a Go To Guy. You are my GTG.
Thanks a lot
1 Like
If your running influxdb I can share my bash script that posts cpu use, memory, load average, temp, etc to influx. Then it just runs as a cron job.
Just change the curl lines to match for your influx server
#!/bin/bash

regex='^[0-9]+([.][0-9]+)?$'


LOADAVG=`cat /proc/loadavg | cut -f1 -d' '`
PROCESSES=`cat /proc/loadavg | cut -d ' ' -f4 | cut -d '/' -f 2`
RXBYTES=`ifconfig wlan0 | grep "RX bytes:" | sed -e 's,.*RX bytes:,,' -e 's, .*,,'`
TXBYTES=`ifconfig wlan0 | grep "TX bytes:" | sed -e 's,.*TX bytes:,,' -e 's, .*,,'`
SWAPFREE=`cat /proc/meminfo | grep "SwapFree:" | sed 's/ * / /g' | cut -d ' ' -f2`
SWAPTOTAL=`cat /proc/meminfo | grep "SwapTotal:" | sed 's/ * / /g' | cut -d ' ' -f2`
MEMAVAIL=`cat /proc/meminfo | grep "MemAvailable:" | sed 's/ * / /g' | cut -d ' ' -f2`
SWAPUSED=$((SWAPTOTAL-SWAPFREE))
DISKUSED=`df / --output=pcent | grep -v "Use" | tr -d ' ','%'`
#USB1USED=`df /mnt/usbstorage --output=pcent | grep -v "Use" | tr -d ' ','%'`
CPUTEMP=`vcgencmd measure_temp | cut -d "=" -s -f2 | cut -d "'" -s -f1`


curl -i -XPOST 'http://192.168.0.95:8086/write?db=serverstats' --data-binary "loadavg,host=octoprint value=$LOADAVG" &>/dev/null
curl -i -XPOST 'http://192.168.0.95:8086/write?db=serverstats' --data-binary "processes,host=octoprint value=$PROCESSES" &>/dev/null
curl -i -XPOST 'http://192.168.0.95:8086/write?db=serverstats' --data-binary "rxbytes,host=octoprint value=$RXBYTES" &>/dev/null
curl -i -XPOST 'http://192.168.0.95:8086/write?db=serverstats' --data-binary "txbytes,host=octoprint value=$TXBYTES" &>/dev/null
curl -i -XPOST 'http://192.168.0.95:8086/write?db=serverstats' --data-binary "memavail,host=octoprint value=$MEMAVAIL" &>/dev/null
curl -i -XPOST 'http://192.168.0.95:8086/write?db=serverstats' --data-binary "swapused,host=octoprint value=$SWAPUSED" &>/dev/null
curl -i -XPOST 'http://192.168.0.95:8086/write?db=serverstats' --data-binary "diskused,host=octoprint value=$DISKUSED" &>/dev/null
#curl -i -XPOST 'http://192.168.0.95:8086/write?db=serverstats' --data-binary "usb1used,host=octoprint value=$USB1USED" &>/dev/null
curl -i -XPOST 'http://192.168.0.95:8086/write?db=serverstats' --data-binary "cputemp,host=octoprint value=$CPUTEMP" &>/dev/null
Thanks but I am using Quick Chart app on Hubitat.
1 Like
Just a curios side question for anyone logging on a C8. Does your C8 run a bit hotter than your C7 did? About 20 degrees hotter?
1 Like

