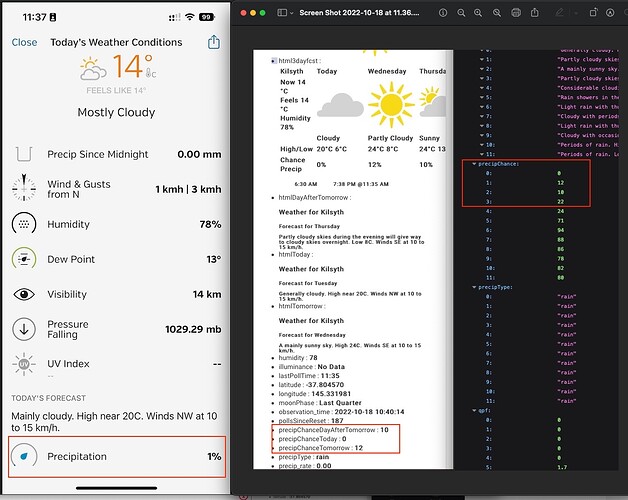
Ok 6.3.1 is out with fixes from @swade - we are running into the 1024 char dashboard tile limit tho. At least I am atm - however, it's not breaking anything as far as I can tell.
Exceeding the 1024 limit means that the dashboard won’t display it; work around could be to write it to the file system and change the attribute to be something like:
<iframe src= ‘http://hubIP/local/fileName.ext’></iframe>
It’s still working, it’s just the dashboard showing the log errors.
Is it possible to pull Air Quality from WU with this integration?
Sorry, no. To use this now (IIUC) you need a key from WU that they give you free only if you have a Personal Weather Station hooked up. As far as I can see, the data returned by the this driver is just the info reported by my station. If there's a parameter for it, you can get at its value - I use mine for wind gust speeds, for example. But I don't see any parameters with the words "air" or "quality".
I just checked the API doc and do not see Air Quality. I use Air Now to import the info into HE using AirNow.gov Driver
@sesummers, you do not need to have a PWS to get a key from WU. I don't know if this is newer or not since I signed up a couple of months ago, and do not have a PWS. Just sign up for a free account and go to the API Keys tab from your Profile and generate a key.
Within the WU webpage you can search and select a weather station you would like to get current conditions from and, the forecast data is pulled using gps, zipcode locations, etc..
I wonder when they changed it back? Google "weather underground api pricing" and you're greeted with "The Weather Underground API previously offered a free tier but has since replaced it with only paid offerings. " But then it adds that they ("VisualCrossing") offer an up to 1000 hits/day free tier - that wasn't there when I started playing with this a couple years ago. Is that what you have?
For me, having my own weather station and using that is perfect. I use things like current wind gust speed, solar radiation level, rain so far today (to stop evening sprinklers) and rain yesterday (to stop morning sprinklers), etc. with automations and alerts.
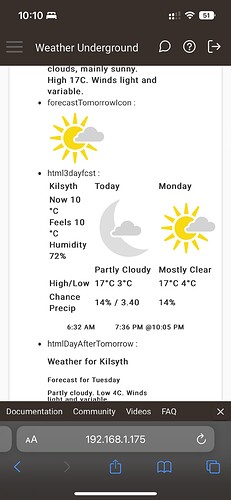
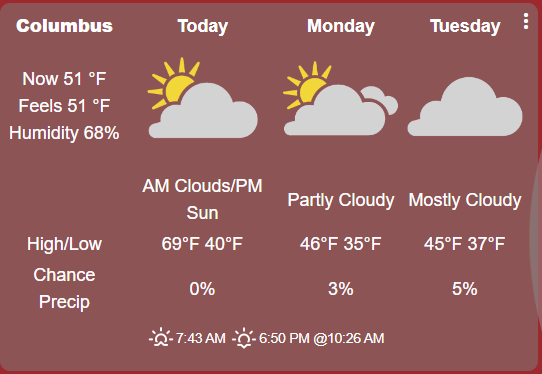
Back to the html3dayforecast discussion, I'm not seeing the icons. I just see a little square for the first two days, and "null" for the third day. Also, the probability of precipitation is way off from what I see on the Wunderground app, although the temps match. Any ideas? I'm checking it on an iPad and iPhone, and have tried expanding the size of the dashboard tile but it didn't help.
That’s odd, can you try repairing or reinstalling the driver?
After that, open the device page and force it to poll. That is usually done in under a minute. Then under current states you should see the various HTML options. Eg
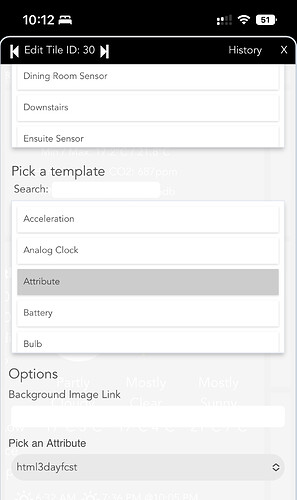
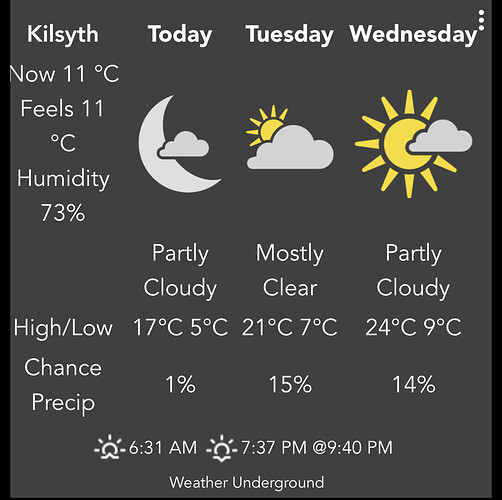
Once you see these they will be available as an “attribute” to select. The tile only needs to be 2x2 in size to fit the info in.
PS I’m off to bed now, but feel free to message me directly with screen shots of your config and I’ll see what we can work out.
I fixed the icon issue by turning on the setting to use WU icons (Duh). Totally my bad on that one. But as for the chance of precip, I think it's the WU data feed that's wrong. I did a repair/reinstall and forced a polling, but it didn't help. I have location set to my station on both the WU app and the data settings for the driver, and all looks fine on both EXCEPT the chance of precip in the driver, which is wrong. No idea, except that WU may have a blunder.
Hopefully the driver is right... If it says no rain...
I am not sure what the app using to get forecast data, but the WU driver is using the Latitude and Longitude from the Hub setting for the one running the driver.
Also, I think the 2x3 tile displays better 
That is certainly possible, but if you setup your longitude and latitude in your Hubitat settings, it should be correct.
It depends on how your tiles are configured - mine is 190x190 which fits in 2x2 quite well.
I have my lat/long setup correctly, but WU seems to report the chance of precip rather crudely compared to the app, and that's likely the problem.
For example, according to the WU app (usually very accurate) the rain is supposed to start at 8 PM today (Monday), and continue all day Tuesday before ending before dawn on Wednesday, when it will be rather nice. I'd look at that as low probability of rain today, almost definite tonight, tomorrow, and tomorrow night, then clear Wednesday. But the html 3 day forecast says 20%/98%/90%. If you needed things to be dry through all of Monday (until midnight) it's wrong, and if you were planning for Wednesday it's technically correct but not very helpful as the rain will be gone by the time the sun is up.
So... The driver is likely fine and the work on that is appreciated. It's likely just a situation wherein WU takes a rather crude, non-granular approach to those probabilities of precipitation when they report those fields.
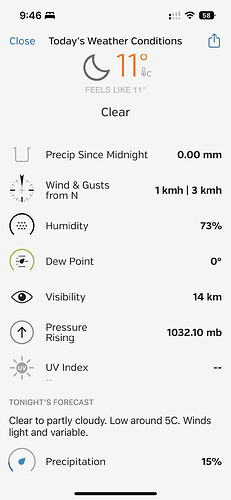
That is odd, its matched up for my location for tomorrow (it’s end of day here):
The driver is pulling the data direct from the WU API and not manipulating it at all.
I think it's just WU. Not a big deal. The driver is great, and for what I really need it to do, has been flawless. THANKS for your work on it!
Ok, I think I found the problem - and I know how to fix it. My day/night switching logic hasnt been applied to the rain forecast.
@Madcodger I've sent you some code to test mate - interestingly, I can confirm that the API data doesn't always agree with the app. 

