I'm using this driver and can't get it to show up in google home. Anyone else having this issue?
@syepes I'm using your driver but having an issue with power reporting. I have a ticket opened with Aeotec as well. I'm in the US. I'm using the HDSS with an electric dryer (240V). The switch is paired unauthenticated with HE. Everything works fine except energy/power reporting. Every time I start the dryer, I get ~5 power/energy reports and then it drops to 0 for both. I can still get voltage and temp updates though. Powering off the dryer and turning it back on repeats the same cycle (a few reports, then nothing). Any ideas?
try changing the reporting settings and threshold's and click the button configure.
This decice is old and something it just needs to reforce the config.
I have tried. Once it stopped reporting, I tried hitting configure and forcing polling. No change in the energy/power reporting but voltage and temp continue reporting, no problem.
That's another oddity that I noticed. Even setting the reporting threshold to 100% change and 500W change, I was still getting updates based on the default parameters (at face value anyhow).
So, it's definitely the switch being lazy with reporting. Aeotec support had me turn on reporting for all attributes and set reporting to run every 30 seconds. It's just randomly flipping between sending the power usage and sending a value of 0.
Just to make sure I'm reading this right though...a meter report of "scale: 2" is the power reading, right? Any tip on converting the values over to decimal?
|2022-08-18 22:28:50.454|skip: MeterReport(scale: 2, rateType: 1, scale2: 0, deltaTime: 0, previousMeterValue: [0, 0, 0, 0], meterType: 1, precision: 3, size: 4, meterValue: [0, 0, 0, 0])|
|---|---|
|2022-08-18 22:28:20.449|skip: MeterReport(scale: 2, rateType: 1, scale2: 0, deltaTime: 0, previousMeterValue: [0, 0, 0, 0], meterType: 1, precision: 3, size: 4, meterValue: [0, 0, 0, 0])|
|2022-08-18 22:27:50.456|skip: MeterReport(scale: 2, rateType: 1, scale2: 0, deltaTime: 0, previousMeterValue: [0, 0, 0, 0], meterType: 1, precision: 3, size: 4, meterValue: [0, 0, 0, 0])|
|2022-08-18 22:27:20.451|skip: MeterReport(scale: 2, rateType: 1, scale2: 0, deltaTime: 0, previousMeterValue: [0, 0, 0, 0], meterType: 1, precision: 3, size: 4, meterValue: [0, 0, 0, 0])|
|2022-08-18 22:26:50.450|skip: MeterReport(scale: 2, rateType: 1, scale2: 0, deltaTime: 0, previousMeterValue: [0, 0, 0, 0], meterType: 1, precision: 3, size: 4, meterValue: [0, 77, 212, 27])|
|2022-08-18 22:26:20.451|skip: MeterReport(scale: 2, rateType: 1, scale2: 0, deltaTime: 0, previousMeterValue: [0, 0, 0, 0], meterType: 1, precision: 3, size: 4, meterValue: [0, 77, 208, 13])|
|2022-08-18 22:25:50.451|skip: MeterReport(scale: 2, rateType: 1, scale2: 0, deltaTime: 0, previousMeterValue: [0, 0, 0, 0], meterType: 1, precision: 3, size: 4, meterValue: [0, 78, 31, 173])|
|2022-08-18 22:25:20.450|skip: MeterReport(scale: 2, rateType: 1, scale2: 0, deltaTime: 0, previousMeterValue: [0, 0, 0, 0], meterType: 1, precision: 3, size: 4, meterValue: [0, 0, 0, 0])|
|2022-08-18 22:24:50.551|skip: MeterReport(scale: 2, rateType: 1, scale2: 0, deltaTime: 0, previousMeterValue: [0, 0, 0, 0], meterType: 1, precision: 3, size: 4, meterValue: [0, 0, 0, 0])|
Oh geez...I just realized it's cyclic. I get three reports and then it goes into a 6 minute "cooldown" of reporting 0 and then three more legit report, back to the cooldown.
I finally got this fixed. The "fix" was to swap the hot legs around on the appliance side of the switch. Once I did that, I started getting consistent power reports. I had previously swapped the legs around on the input side with no change.
Now that it's fixed, I think I see a trail to what the problem is.
###Pretty much everything below here is an assumption###
With 240V, there's two hot legs. Dryers are cyclic where they will toggle the heating element on and off. It would appear that the plug is checking one of the legs for power. If power is there, then it checks the other leg. If there is no power on the first leg, then it doesn't check the other one at all.
The reason I assume this is that, now that I'm getting the power reports, I can see that when I was getting a report of 0W before, I should have been getting ~470W. The dryer bounces between that and ~5100W when the heating element kicks back on. I assume the dryer only pulls power on one leg when the heating element is off. If that leg isn't the one the switch is set to check first, then you get a report of 0W.
I had the same problem with this. I posted about it here. Linking it for visibility in case anyone else has this problem.
I did sooooo much searching trying to find if anyone had the same issue and never saw your thread. Cool to see that we independently came to the same conclusion. I had a case open with Aeotec and sent back those findings and the person stopped responding to me.
When you say "appliance side," are you meaning "load" side as indicated on the switch? I was under the impression that it needed to be "AC Power" side as indicated in the other linked discussion. Just checking, as I think I have this issue also. I just work around by adding in a longer wait. But, if this fixes that issue, I can reduce the time it takes to get the notification when my dryer is done with its cycle.
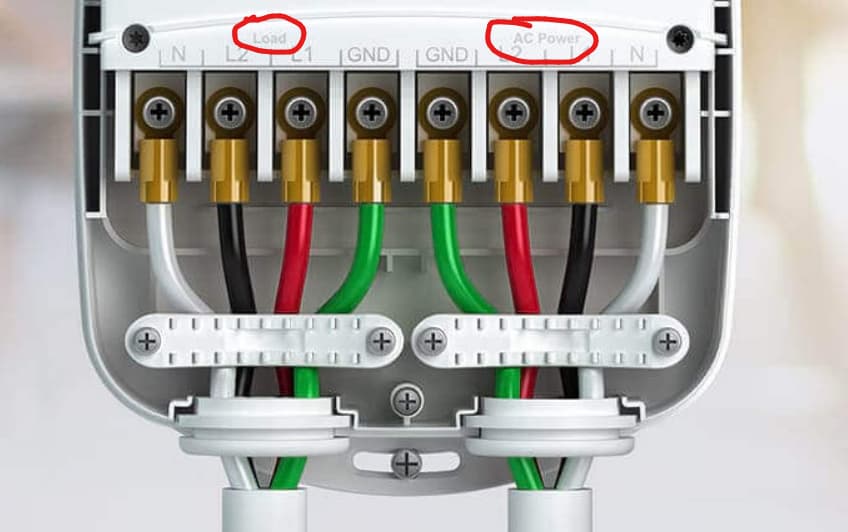
I think your answer is yes, swap load 1 and load 2 on the load side.
1 Like
Yes.
1 Like
Hey @syepes I notice there is an update available for this in HPM. I looking at GitHub and in the groovy file it says version 1.1.5 and the version I have currently is 1.1.3. I don't see a changelog anywhere so I was wondering what changed between versions.
Below is exactly what changed, but mainly removed the update notification feature as most of us are now using HPM and fixed some unnecessary logging
1 Like
I've been going through some logs today and saw this for the HDSS
Maybe or maybe not related... I opened the device and I see this
But I did update through HPM and if I go to the drivers code and look at your driver it shows 1.1.5 as the version.
This driver is great, thanks for hooking/releasing it.
Is the only difference between State Check and Report Interval that State Check is a scheduled question from Hubitat to the switch and that Report Interval is an unsolicited message from the switch to Hubitat? Is the same information being provided? If so, I'm wondering what your thoughts were on having both on by default.
The main difference is that the Report setting is for the voltage, consumption and temperature values and not the actual state (on or off). Its also a passive check meaning that the device sends the updates by it self without any hub interaction.
So yes the State check setting is an active check on the device, so the hub actively requests the state.
1 Like
I have a constant 750watt draw on my unit with:
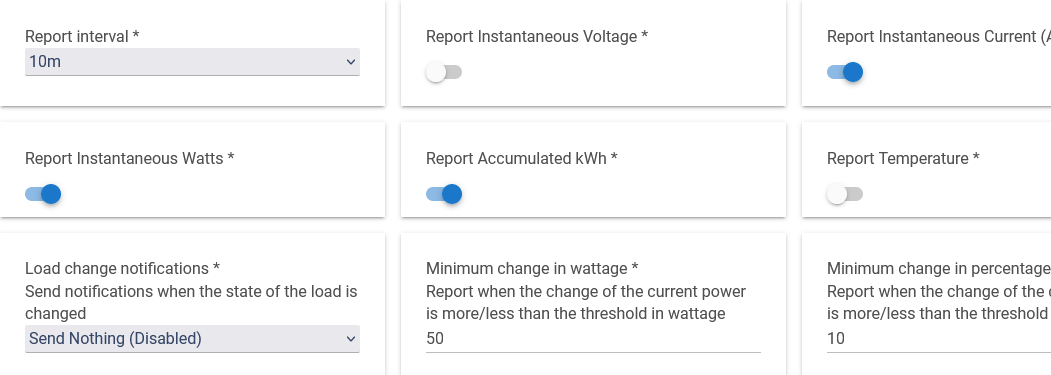
I did push Configure after saving preferences.
I have debug enabled, and in the logs I see the switch sending updates every 120 seconds:
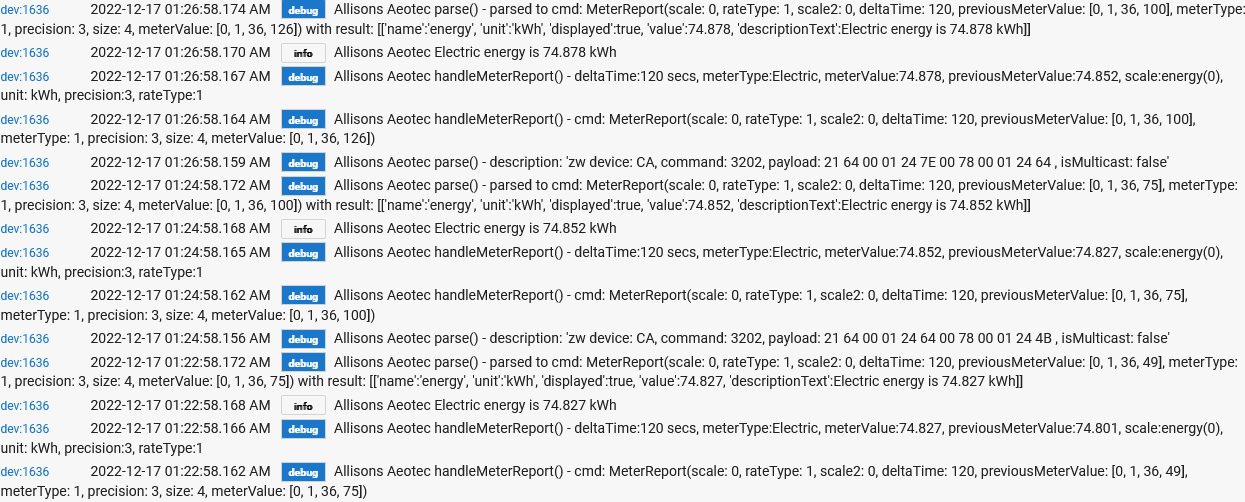
I expected to get regular/unsolicited updates every 10 minutes given the Report interval. Am I not thinking about it correctly ?
Hi. Thanks for doing this.
edit: Well, it calmed down. I have no idea what I did. I pushed all the options, lol.
I just installed it. I find that the debug log shows a unceasing activity. I'm afraid it's going to choke my z-wave net. I tried to turn everything off that I could, like all the instantaneous reading, but it didn't do any good. It never stops.
Also, I associated a button controller to it, and it said it was successful, but it doesn't work.
Here's a sample of the activity. It never stops:
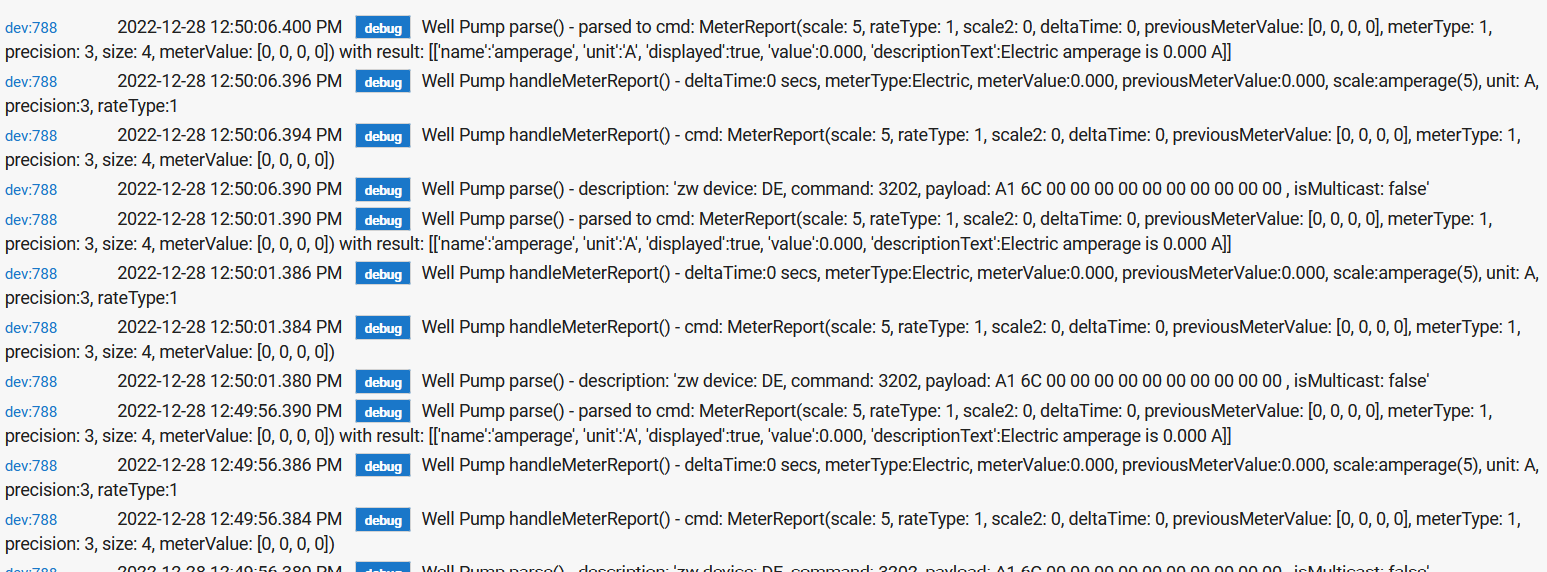
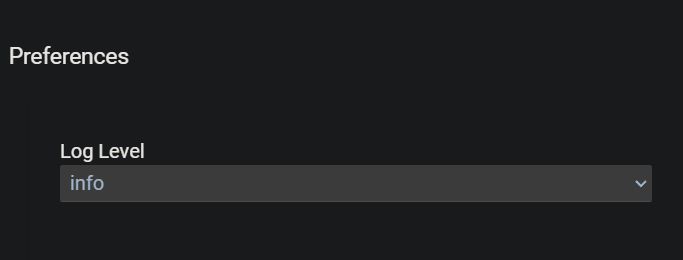
You just need to adjust the log level option under preferences: