That made me wonder if they already had a setup and were just adding to it....
Not from experience, let me see what I can find out...
Looks like you need to go into the WSView app and find the listing of sensors and click de-register. I think I remember seeing it in there. It may take a little while for it to disappear. I'm not sure how it will play out in HE, I have a feeling you can't delete the child devices, but let's see how you go de-registering them first.
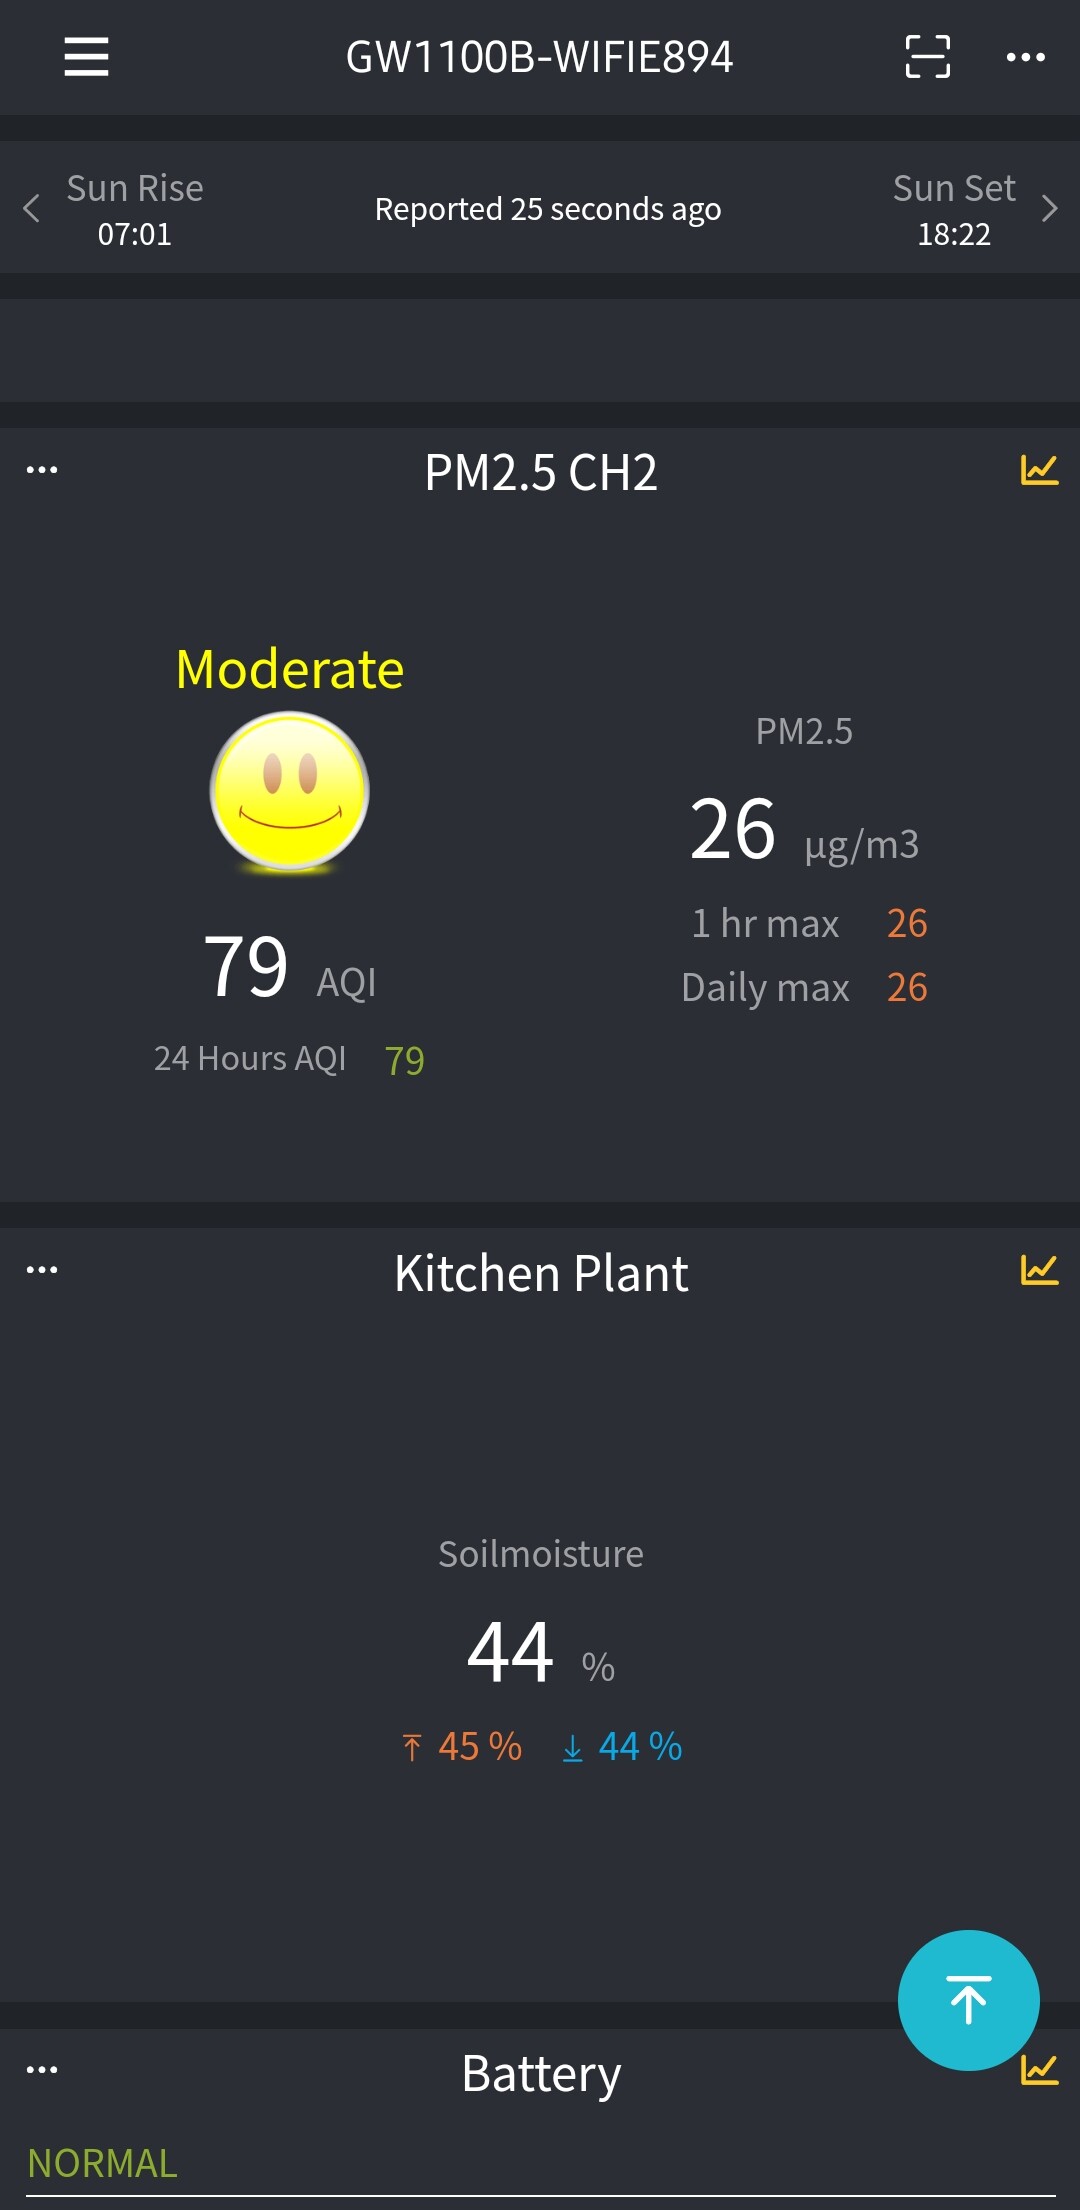
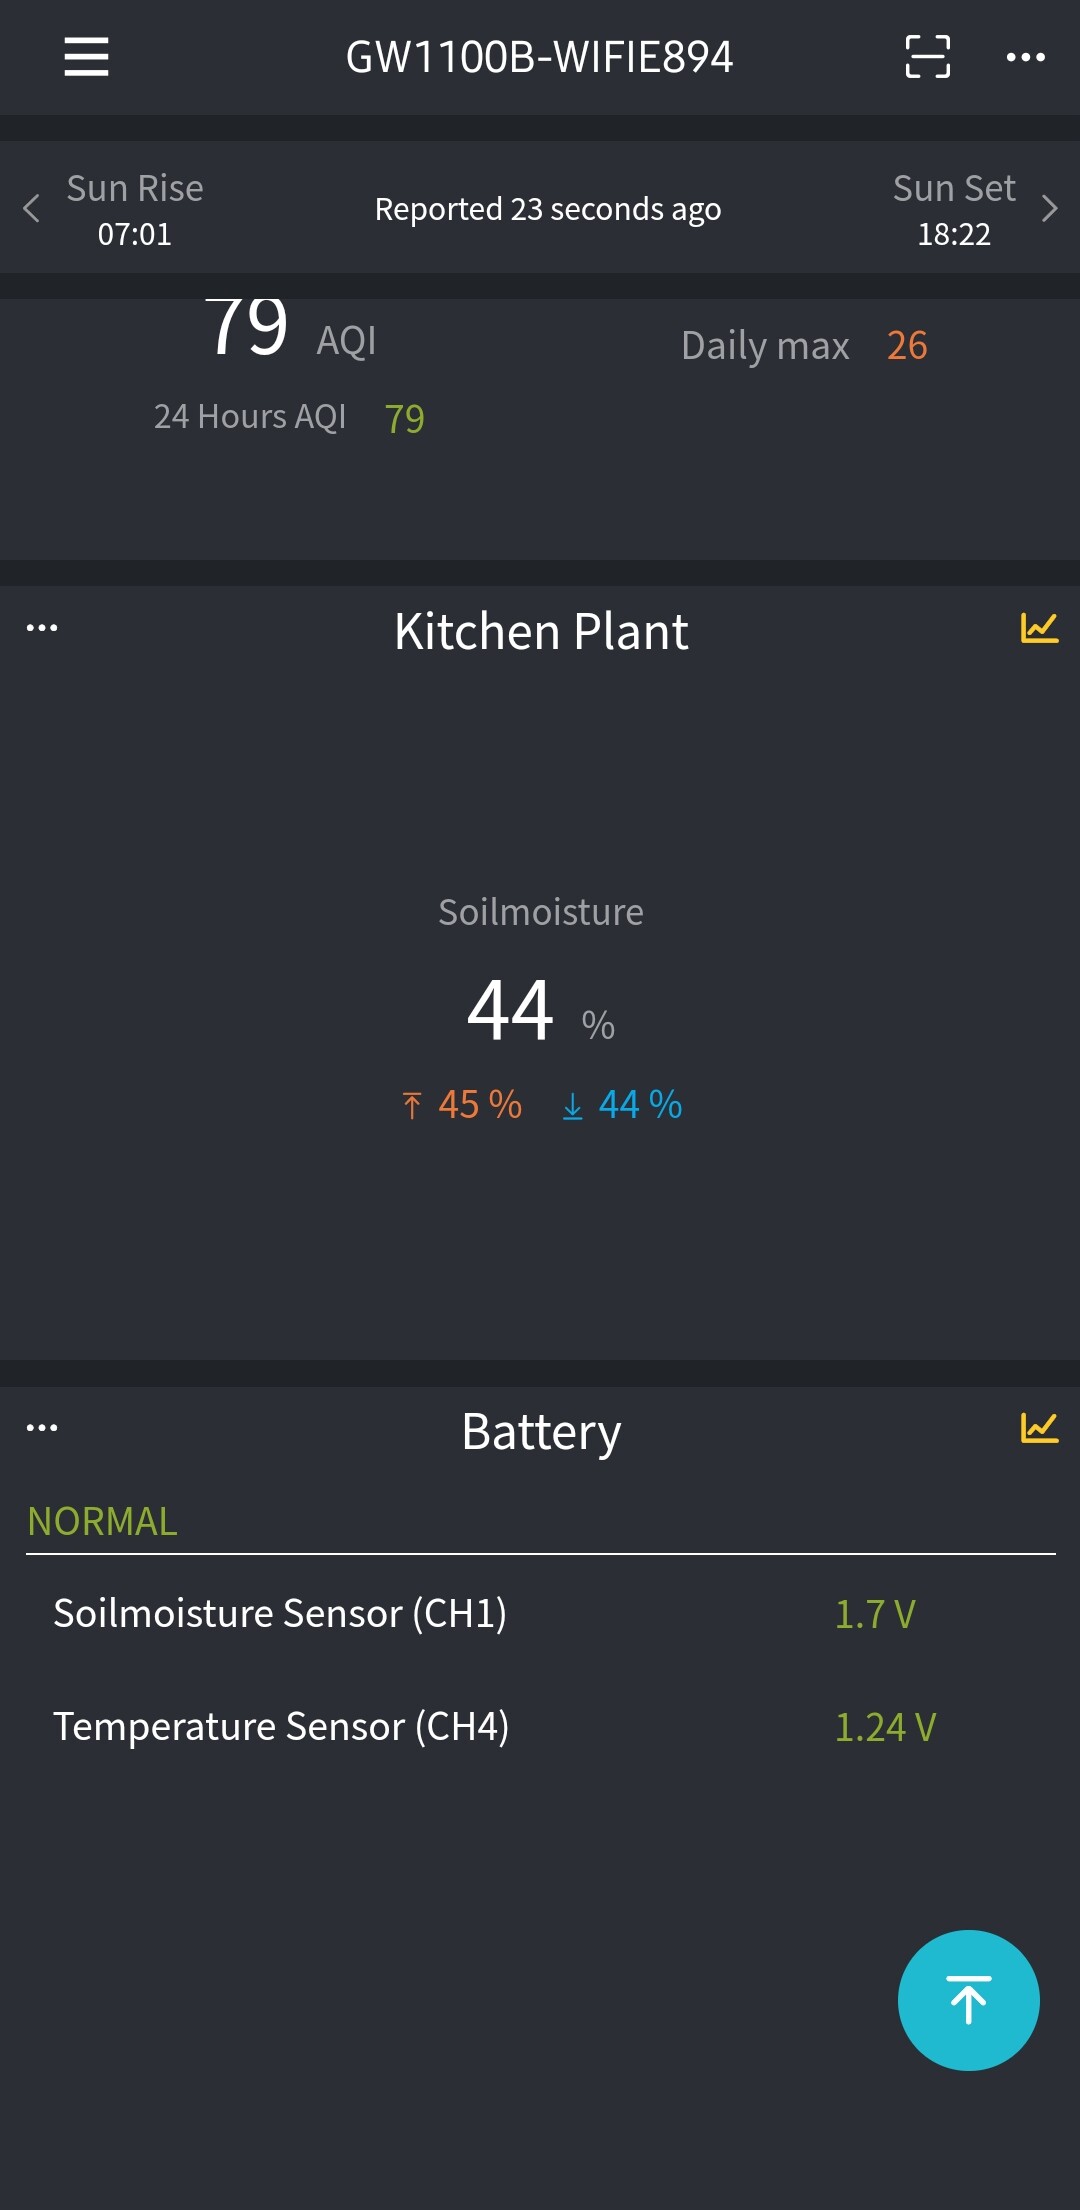
No, it's only showing moisture there on the dashboard, 44% for the Kitchen Plant. The PM 2.5 CH2 will be the Air Quality Sensor. If you want to remove them you need to go into the WS View app on your phone / tablet.
It should work if you adjust the min and max settings on the sensor device page. Mine have stayed at 100% for now. I may have cut off the max a little early at 1.2 on one of them. So if you find out the range for the batteries you are using you can adjust the settings in HE to match. It doesn't look like they are written batch to the gateway at all, which I can understand, it is just pushing the readings out rather than accepting commands coming in.
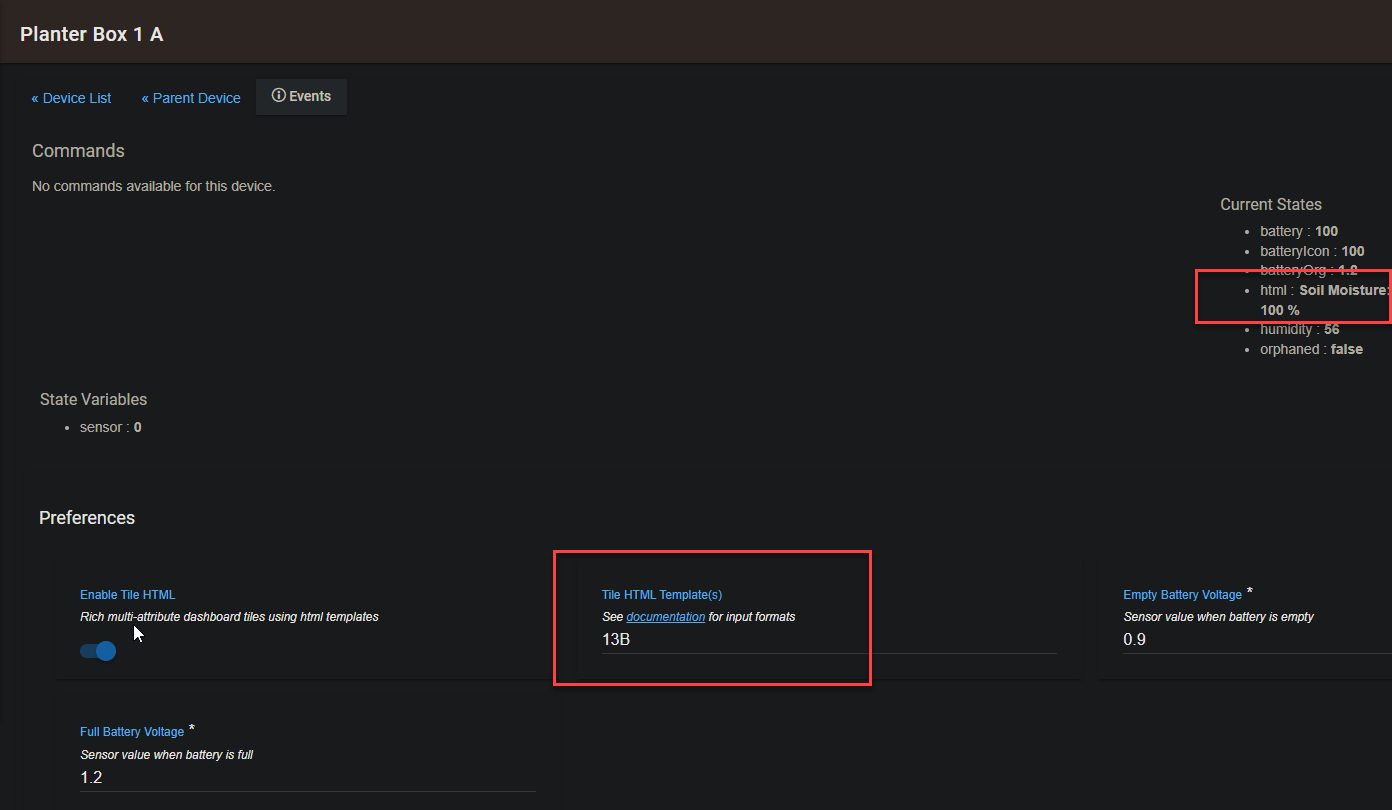
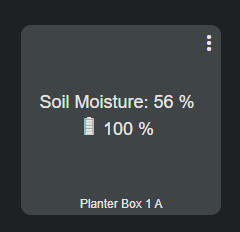
I don't specifically see it, do you recommend a particular dashboard tile template for the WH51 soil moisture sensor?
EDIT
Is it possible to have a template for the lightening sensor? I will eventually be going to the whole weather station, but for the time being am just planning to add a lightening sensor to the gate way. it would be nice to have that on my dashboard as well .
I've been meaning to update the Templates documentation, it only appears to include a subset of the available templates. There is a link at the very end of the Readme in GitHub which refers to the more complete list, admittedly in a code-like form.
From this, I think you will be looking for 13 or 13B for the Soil Moisture sensor and 4 or 4B for the Lightning sensor. You can type these into the Tile HTML Template Preference Setting to have the HTML tile generated, for example:
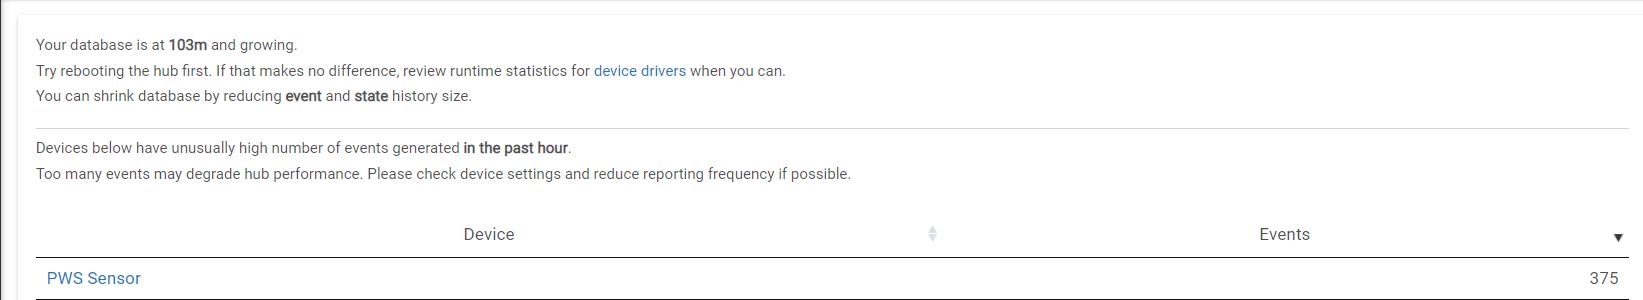
Anything I can do to reduce the PWS chattiness? I originally had it set to combine sensors in a virtual array (been that way for ages). Turned that off, didn't have any effect as far as I can tell.
It might be ok. I'd need to look at it in more detail to be sure. If you have added some sensors recently that might be all it it. From memory I think every attribute update is included in that figure, so if you are getting more readings coming through that would increase the perceived load.
No "new" sensors added, but the moisture sensors in the yard had been sitting w/dead batteries for a while, so they were "woken up" when I put them back to use three weeks ago. I wasn't getting any warnings on the hub until recently, and the sensors have been in place for three weeks.
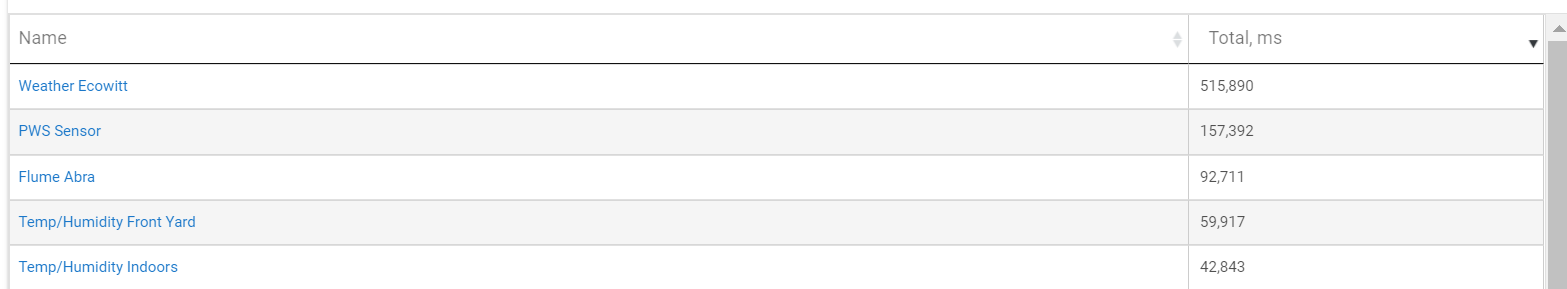
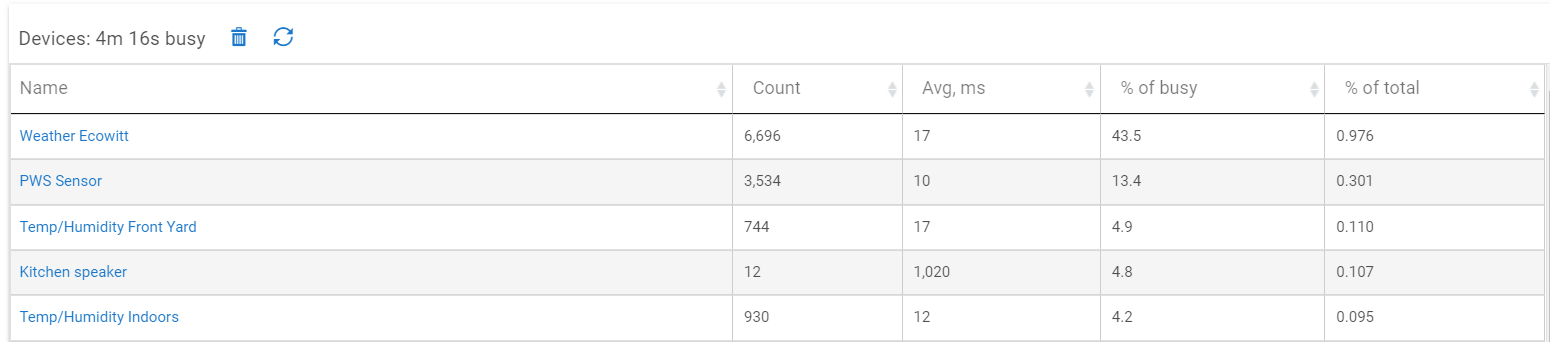
Hmmm.... Hard to say. You would have to compare similar timeframes for some of those metrics, they are totals across the uptime or since the stats were last reset. In the "count" column I have ~84K in just under 4 days for the Gateway, as a comparison. But I'm not sure what is the best gauge.
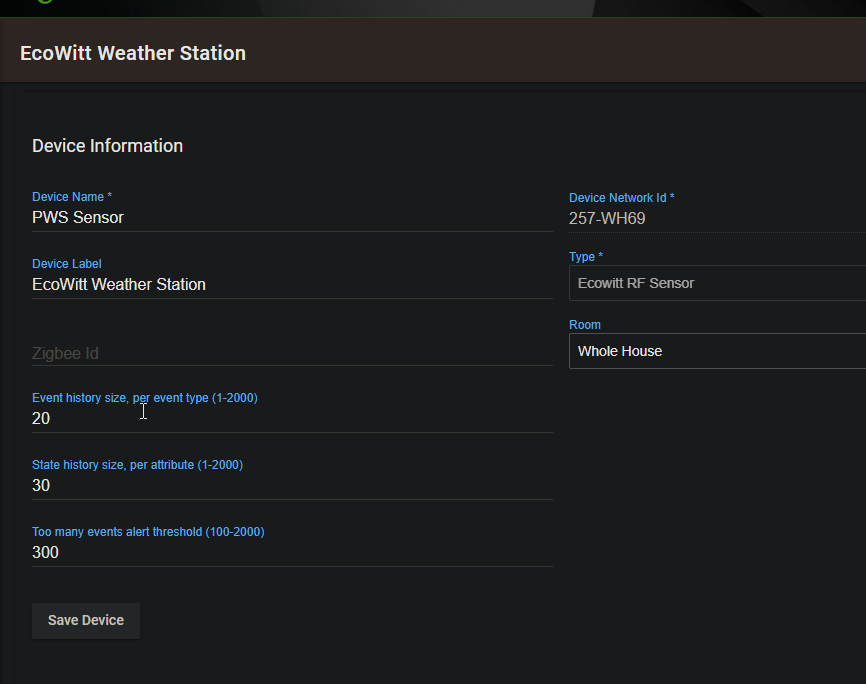
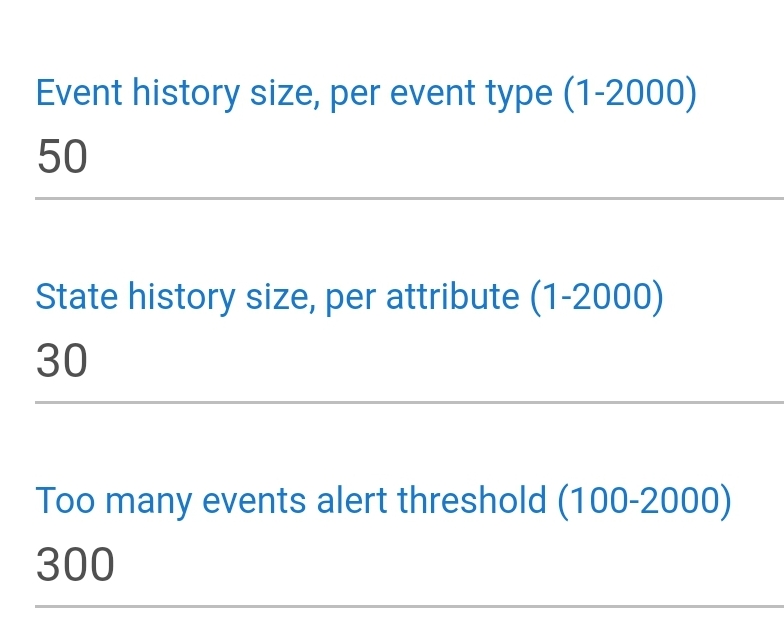
In terms of the warning, though, I expect that comes from the threshold set on the Device Edit page. My gateway and PWS are both currently set to 300 events.
In the stats table my PWS is showing 771 events, but I have not received any warnings, so I can only assume that is over a period of time? Or maybe the setting to restrict the number of events has something to do with it?
This sort of stuff is not my strong suit, sorry.
You may want to check how often you are sending the data from the Gateway to your HE hub. I send mine every 60 seconds.
I can only the threshold is within a period of time.... I'm sure there'll be some detail somewhere around here....
Perhaps try resetting the stats, or restart the hub and see when it comes up....
@thebearmay - I'm wondering whether you or someone else has set something up to export these to be able to chart them per day? i.e. the device stats. Might be a nice little side project, alongside the other side-projects
I know the threshold is time based, but don’t recall seeing what the interval is, could also be x number of intervals over the threshold - @gopher.ny could probably tell us. As to your other question, MakerAPI can give you access to any event that causes an attribute change, but it would be a simple exercise to subscribe to a single event type or all events for a device and drop them out to Node Red or the hub file system.
Thanks @thebearmay, hopefully between input from HE (gopher) and @danabw 's stats we can understand better what results in the elevated results. I can then update the documentation so people know what to expect. (Rather than offloading the responsibility to others )
I did feel guilty for asking, so retracted my tongue-in-cheek hint.... So don't feel any obligation, unless @danabw wants to apply any pressure I'll accept no responsibility And thanks for chiming in with your thoughts on where to look next.
The other thing that could be looked at is a quick utility that simply counted the number of events (specific or global) for a device or set of devices over a period of time and made an entry somewhere - would allow you to graph the chatty times for a device…