Hello,
Based on forum recommendations I ended up getting a Innr Smart plug with power monitoring. I paired it with my hubitat elevation and in "Events" I see a few events for power reporting but this doesn't seem to be consistent.
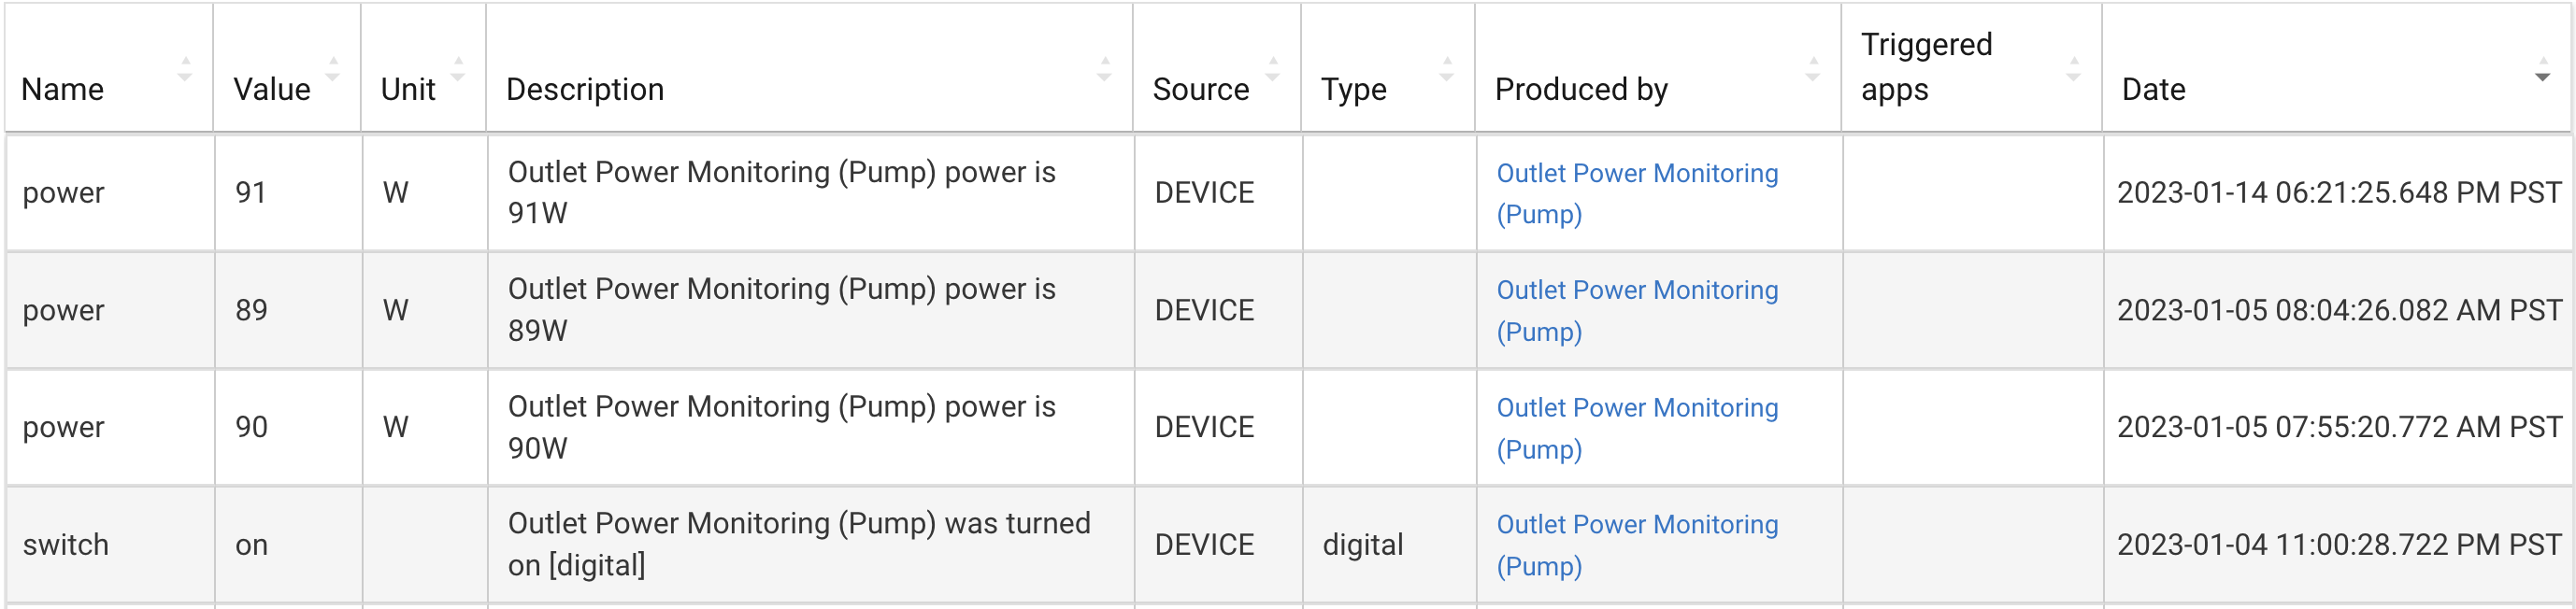
Where would I see the power monitoring graphs? I see a couple reports in Events, but it doesn't seem consistent. Please see screenshots for events, and my device preferences.
A 2nd question I have is around repeating. Does this smart plug act as a repeater? I have a Leviton switch less than 15 ft from this power monitor and it fails to pair to my hubitat elevation. Is there a way to see all the repeaters that are active?
My leviton switch is a Zigbee switch (Leviton DG15S-1BW Decora Smart Switch). The switch is about 25 feet from the hubitat hub and maybe 15 feet from the INNR power monitor plug.
For the last 9 days I do not see any events (except for the one from today when I hit refresh). Where are the power monitoring reports stored? Do they always show up as "Events"?
My preferences do specify a 10 watt reporting threshold, but I'm not sure if that's doing anything. The device I have connected uses 90 watts and runs continuously from 6am - 11pm.
This is usually a reporting change threshold. Meaning a change of +/-10W would result in an event. Anything less would not (which explain you not having any events). If a power reporting doesn't show in the events list, then it will not be stored anywhere in Hubitat.
If the wattage draw does not change there is nothing useful for the device to report. With the threshold set at 10W it will only report if it changes by 10W or more since the last report. Also even if it does report and the reading is identical to the previous reading it may not get logged in events (this is up to the driver).
From what you say, when the device turns off it should report less watts (near 0 possibly), and when it turns back on you should get another report of the 90w.
Make sure you have the correct driver (type) selected and then run Configure on the device page, see if that kicks it into gear.
No that is correct but you also need his "Normal Stuff" library file first which I think is in another bundle.
The power reporting from stuff in hubitat is very limited to several recent events. Not useful for if you are looking for any sort of historic view.
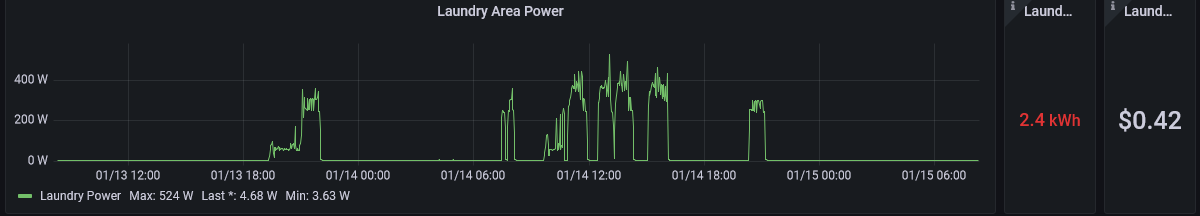
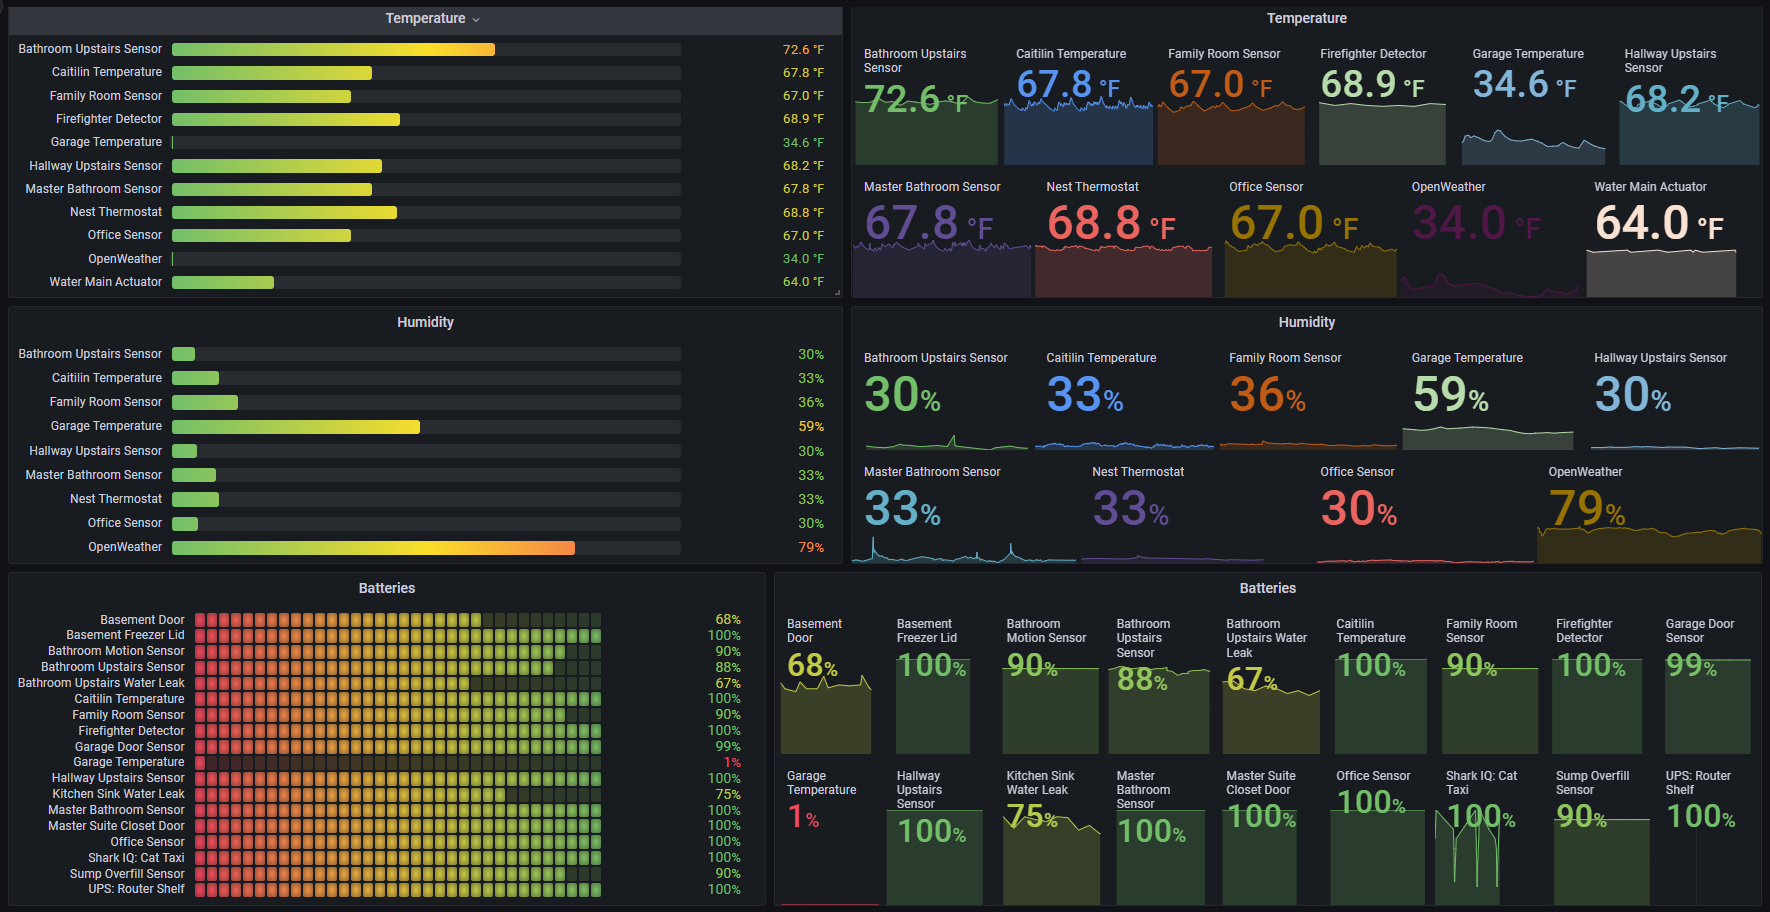
For that I use influxdb and grafana in a virtual machine, and use the influxdb logger app to push all various power, temperature, humidity, etc values to it for graphing later.
This is an example of what you can do with that. It's a bit of work to setup, but if you are a data geek like me, it's worth it.
Thank you Jeff. I was able to import the bundles and create two child apps (one for data collection, and one for the graph). Now I'm stuck at trying to view the graph - When I hit the + button in a dashboard there's a weird looking "Add Tile" modal, but nothing to add the Quick Chart I created. In the modal, when I select "Devices" it says "No Devices authorized". Would appreciate any pointers to documentation.
@scoob8000, that's a really neat graph/setup. I do not have an additional computer in my machine room that's always running, so a VM is not an option for me. I want all my automation stuff (including monitoring) to run on hubitat.
@ FriedCheese2006: That makes a lot more sense. Thank you for the explanation. Maybe when I clicked "update" it actually did update the firmware as I finally see events at 11pm and then 6am this morning. Will watch for another 24 hours to see if it stays connected.
I don't actually use that Quick Charts app I just figured it would be an easy place for you to start with a chart. You would probably have to post on that thread with any questions. I actually use the Influx/Grafana setup like @scoob8000
Can pretty much make anything you can image with that.
Most definitely! I actually ran mine on a raspberry pi for years before getting a newer nas that has the processing power to run virtual machines.
Once you start logging and graphing stuff, you'll get addicted. I even track my water and gas usage with a SDR (software defined radio) dongle that is set to listen to the broadcasts from my water and gas meter. That ran on the same raspberry pi.
Yes, if you have one already. Would not recommend buying one right now due to pricing. You are better off getting one of the alternates or even a micro x86 PC. I have two mini PCs I got left overs from a business and they work great, one for HA stuff and one for Plex.
An entry level Raspi 4 is $45. Adding a case and a couple other accessories brings that to about $80. Are there cheaper options available? Any concrete recommendations? All micro x86 PCs seem way more expensive. I did have an older raspi but unfortunately I gave that away.

 Get Help / Devices - Hubitat