Low priority (for me) enhancement idea - would it be feasible to have the hub send its log events to another system via syslog?
There's also some discussion about exporting logs here with an example node app right after:
+1 for this one, definitely pushing them via syslog would be the best...
+1 for my interest in this capability.
minus 1 from me.
There's several apps that already squirt events out, which makes syslog unnecessary, IMHO.
Homebridge, Activity Viewer, Hub Link
InfluxDB fell off the rails apparently, but still, it's another that's doing the same basic action.. send events somewhere.
csteele - I feel like I am missing something . . .
How would Homebridge, Activity Viewer or Hub Link allow me to collect log events on an external system?
Agreed... I am not understanding it either.
I would like the Live Logging feed to have the option to send to a syslog server as well. It would be a 'nice to have' feature, definitely not a 'must have'.
Since Hubitat now supports sending UDP packaets, and since that is all Syslog is, we should be able to write an App if there is a Hubitat API call to subscribe to and receive the live logging data stream.
Not sure about those apps but its possible with node.js, some details here:
I found it after posting my +1 here, still would be nice to have syslog but at least there are alternatives...
let me rewind and explain a bit deeper...
InfluxDB was looked upon as a means to get that Live Logging BUT there's something wrong with the actual driver, I presume, and it's causing a load on the Hub. Similar products: Homebridge, Activity Viewer or Hub Link, all do a similar function: subscribe to everything selected and send it off hub. without a load problem apparently.
this will be a really nice feature.
not just for debugging
but also if Hubitat is not accessible you can look at what happened independently even if hubitat is locked, burned or offline.
If you have a box to run Node Red on, the feature already exists. Works very well to export events and logs via websocket.
+1 for syslog integration.
UPDATE: this solution is outdated. See next post for a simpler solution.
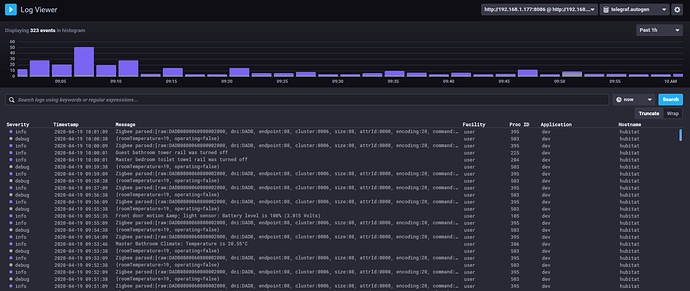
I successfully got Hubitat logs from websocket written to InfluxDB using Node-RED and terelgraf. Now I have long term storage for logs which help me diagnose problems with custom drivers/apps.
The syslog plugin did not work for me as it did not produce a valid RFC5424 syslog format (which telegraf required). So I ended up writing a custom function.
So the message flow goes line this:
HE -> Node-RED -> telegraf -> InfluxDB -> Chronograf
Node-RED
The syslog message produced the the function is sent to telegraf on UDP port 6514, which then gets stored in InfluxDB.
The function:
var severity = 7;
switch (msg.payload.level) {
    case "error":
        severity = 3;
        break;
    case "warn":
        severity = 4;
        break;
    case "info":
        severity = 6;
        break;
    case "debug":
    case "trace":
        severity = 7;
        break;
}

let time = new Date(msg.payload.time);
var resultingMessage = "<"+calculatePriority(1, severity)+">1 "+time.toISOString();

resultingMessage += " hubitat"; // host
resultingMessage += " " + msg.payload.type; // appName
resultingMessage += " " + msg.payload.id; // pid
resultingMessage += " " + msg._msgid; // msgID
resultingMessage += " -"; // structured data
resultingMessage += " " +msg.payload.msg; // message

return {
    payload: resultingMessage
};

function calculatePriority(facility, severity) {
    return facility * 8 + severity;
}
Telegraf
The telegraf config to accept syslog:
[[inputs.syslog]]
   server = "udp://:6514"
Chronograf
The logs are then visible via Chronograf's Log Viewer:
Update to the above solution:
I have managed to channel Hubitat logs from Node-RED directly to InfluxDB without using Telegraf:
The updated message flow goes line this:
HE -> Node-RED -> InfluxDB -> Chronograf
Node-RED
The function:
let time = new Date(msg.payload.time);
return {
payload: [{
measurement: "syslog",
fields: {
facility_code: 1,
message: unescapeHtml(msg.payload.msg),
procid: msg.payload.id,
severity_code: levelToSeverityCode(msg.payload.level),
timestamp: time.getTime()*1000000, //convert to nanoseconds
version: 1
},
tags:{
appname: msg.payload.name,
facility: msg.payload.type,
host: "hubitat",
hostname: "hubitat",
severity: levelToSeverity(msg.payload.level)
},
timestamp: time
}]
};
// For info on the message format: https://www.influxdata.com/blog/writing-logs-directly-to-influxdb/
function unescapeHtml(unsafe) {
return unsafe
.replace(/&/g, "&")
.replace(/</g, "<")
.replace(/>/g, ">")
.replace(/"/g, "\"")
.replace(//g, "'")
.replace(/'/g, "'")
.replace(/'/g, "'");
}
/*
0 Emergency emerg System is unusable This level should not be used by applications.
1 Alert alert Should be corrected immediately Loss of the primary ISP connection.
2 Critical crit Critical conditions A failure in the system's primary application.
3 Error err Error conditions An application has exceeded its file storage limit and attempts to write are failing.
4 Warning warning May indicate that an error will occur if action is not taken. A non-root file system has only 2GB remaining.
5 Notice notice Events that are unusual, but not error conditions.
6 Informational info Normal operational messages that require no action. An application has started, paused or ended successfully.
7 Debug debug Information useful to developers for debugging the application.
*/
function levelToSeverityCode(level) {
switch (msg.payload.level) {
case "error":
return 3;
case "warn":
return 4;
case "info":
return 6;
default:
return 7;
}
}
function levelToSeverity(level) {
switch (level) {
case "error":
return "err";
case "warn":
return "warning";
case "info":
return "info";
default:
return "debug"
}
}
Chronograf
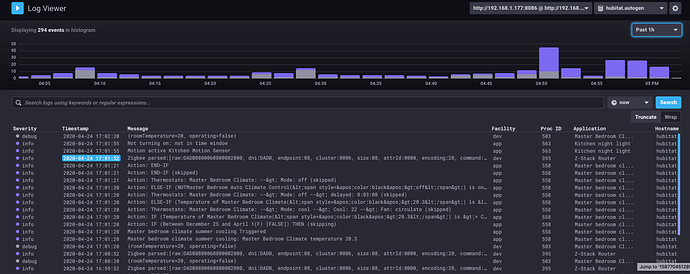
The logs are then visible via Chronograf's Log Viewer:
Note that device/app name is now showing in the "Application" column.
Would really like to see native syslog support. I have a Raspi that already acts like a syslog forwarder to loggly. Would be nice to get all that data in there so we can easily track stuff down.
I had a +1 on this, but knowing how complex getting an exact RFC format for syslog can be, I decided to go a different way using the maker API. Syslog for every possible zwave and zigbee device seems unreasonable to ask. It's a huge lift, given all the different types of devices. I'm working with just HEM gen5 devices and even internally the fields switch in presentation.
I would like at least the HE device itself to speak out with syslog; that's a reasonable thing for all of my other network devices. Reboots, updates, etc.
I tried to come up with a solution that works without external programs (like node-red). It still needs some polish, but I think it works.
@User12Hubitat, wonderful little driver!! I just installed it and am testing it out.. I thought about one thing that might be cool to add. a port field next to the ip field, as well as UDP/TCP option and even where a SSL cert could be uploaded. These are just some thoughts that came to me when i was setting mine up. Some people may change their port number that their syslog server is running on. other than that it appears to be off to a wonderful start!! Thanks for your"groovy" creation!!
I added that port field, thought about the TCP thing but went no further. @User12Hubitat, thank you!
I created a pull request to the original author's base, but if you'd like to change ports or use RFC 5424, I've got those changes in my fork. A working RFC 5424 syslog implementation by staylorx · Pull Request #1 · hubitatuser12/hubitatCode · GitHub


