I can honestly say we've never seen a need to search 33,000 events. How'd you get yourself into that position of need? I can't remember needing more that the first page or maybe two ever.
5 Likes
Something like this is why i have node-red dump the logs to a influxdb server. Then Grafana can allow me to filter out the data as needed. I would bet it wouldn't be to bad on something like that.
2 Likes
or Splunk.
1 Like
I'd love the ability to search through that many events. My usual situation is:
- I have logs enabled for everything
- I have an issue - "post the logs" shouts the community - but I can't as it has been overwritten/logs aren't big enough to hold everything
- So I switch off logging in everything that's working to make room for a future failure
- Something fails that was working - "post the logs" shouts the community - but I can't the logs were switched off in step 3
- Nightmare - that can't happen again so I I'd better switch on logs for everything....
- Repeat ad infinitum
I'd love a means to send every device event and every rule event to some beautifully laid out external database where I could always find everything by filtering to device, date etc. It would be large enough to hold 3 weeks plus from everything (covers a failure during vacation/holiday) and have some method to purge events older than x days old.
1 Like
Is there any information on this anywhere? Is it restricted to device events or are events from rules also logged?
This is the thread I posted what I found to accomplish it.
Log Hub Events to remote server (syslog)? -  Feedback / Feature Requests - Hubitat
The jist of what is needed is Node-Red, InfluxDB, and Grafana. Node-red will capture the logs from hubitat and then format it and put it in InfluxDB. Then Grafana can pull the syslogs and display them. It will provide you the ability to look at anything that shows up in Logging. As part of the setup though you will need to create a sepreate db in Influxdb and probably just set the retention to the length of time you want to keep.
2 Likes
Just so you can see it here is my Syslog Dashboard in Grafana. It pulling 30 days of records if needed. If you look at the far right of the top widget it looks like it was 162k records so can easily handle the 33k you are concerned about.
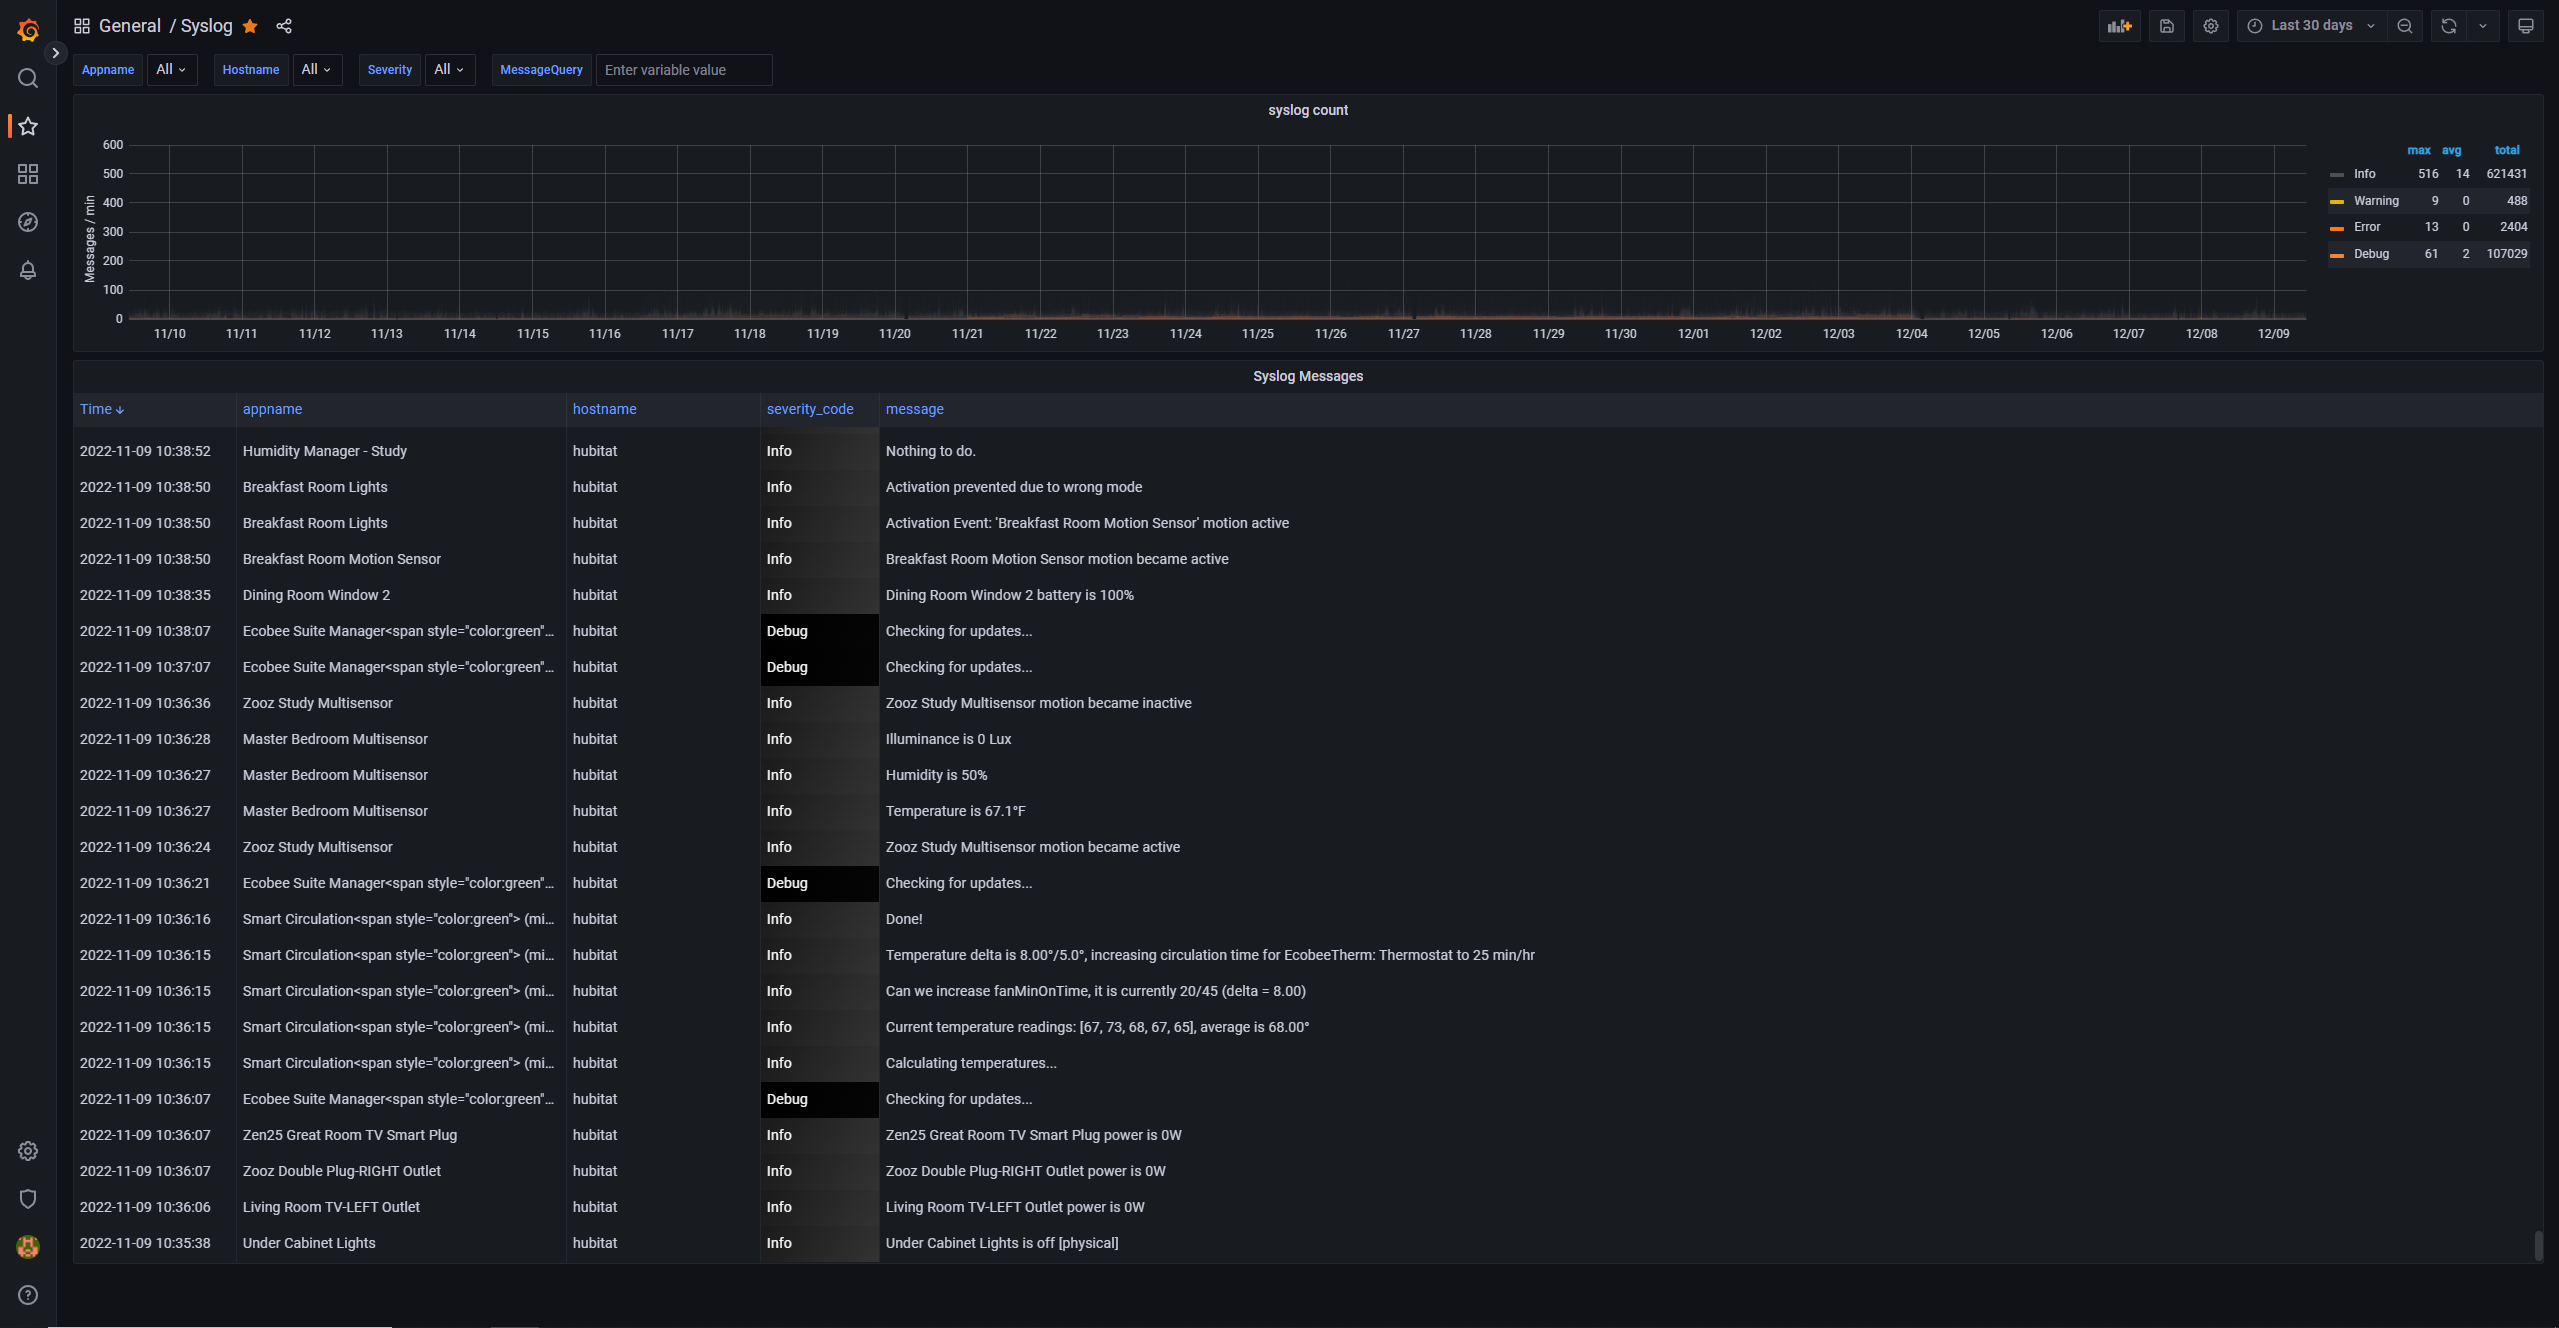
Here is my dashboard in Grafana
{
"annotations": {
"list": [
{
"builtIn": 1,
"datasource": {
"type": "datasource",
"uid": "grafana"
},
"enable": true,
"hide": true,
"iconColor": "rgba(0, 211, 255, 1)",
"name": "Annotations & Alerts",
"target": {
"limit": 100,
"matchAny": false,
"tags": [],
"type": "dashboard"
},
"type": "dashboard"
}
]
},
"description": "Telegraf / InfluxDB / Grafana as syslog receiver",
"editable": true,
"fiscalYearStartMonth": 0,
"gnetId": 12433,
"graphTooltip": 0,
"id": 21,
"links": [],
"liveNow": false,
"panels": [
{
"aliasColors": {},
"bars": true,
"dashLength": 10,
"dashes": false,
"datasource": {
"type": "influxdb",
"uid": "5yfSbJ67k"
},
"decimals": 0,
"fill": 1,
"fillGradient": 0,
"gridPos": {
"h": 7,
"w": 24,
"x": 0,
"y": 0
},
"hiddenSeries": false,
"id": 10,
"interval": "",
"legend": {
"alignAsTable": true,
"avg": true,
"current": false,
"max": true,
"min": false,
"rightSide": true,
"show": true,
"total": true,
"values": true
},
"lines": false,
"linewidth": 1,
"links": [],
"nullPointMode": "connected",
"options": {
"alertThreshold": true
},
"percentage": false,
"pluginVersion": "9.3.1",
"pointradius": 2,
"points": false,
"renderer": "flot",
"seriesOverrides": [
{
"alias": "Info",
"color": "rgb(80, 80, 80)",
"stack": "A"
},
{
"alias": "Notice",
"color": "rgb(182, 182, 182)",
"stack": "A"
},
{
"alias": "Warning",
"color": "#E0B400",
"stack": "A"
},
{
"alias": "Error",
"color": "#FF780A",
"stack": "A"
},
{
"alias": "Critical",
"color": "#E02F44",
"stack": "A"
},
{
"alias": "Alert",
"color": "#8F3BB8",
"stack": "A"
},
{
"alias": "Emergency",
"color": "#8F3BB8",
"stack": "A"
}
],
"spaceLength": 10,
"stack": false,
"steppedLine": false,
"targets": [
{
"alias": "Info",
"datasource": {
"type": "influxdb",
"uid": "5yfSbJ67k"
},
"groupBy": [
{
"params": [
"1m"
],
"type": "time"
},
{
"params": [
"null"
],
"type": "fill"
}
],
"measurement": "syslog",
"orderByTime": "ASC",
"policy": "default",
"refId": "A",
"resultFormat": "time_series",
"select": [
[
{
"params": [
"severity_code"
],
"type": "field"
},
{
"params": [],
"type": "count"
}
]
],
"tags": [
{
"key": "severity",
"operator": "=",
"value": "info"
},
{
"condition": "AND",
"key": "hostname",
"operator": "=~",
"value": "/^$hostname$/"
},
{
"condition": "AND",
"key": "severity",
"operator": "=~",
"value": "/^$severity$/"
},
{
"condition": "AND",
"key": "appname",
"operator": "=~",
"value": "/^$appname$/"
},
{
"condition": "AND",
"key": "message",
"operator": "=~",
"value": "/$Query/"
}
]
},
{
"alias": "Notice",
"datasource": {
"type": "influxdb",
"uid": "5yfSbJ67k"
},
"groupBy": [
{
"params": [
"1m"
],
"type": "time"
},
{
"params": [
"null"
],
"type": "fill"
}
],
"measurement": "syslog",
"orderByTime": "ASC",
"policy": "default",
"refId": "B",
"resultFormat": "time_series",
"select": [
[
{
"params": [
"severity_code"
],
"type": "field"
},
{
"params": [],
"type": "count"
}
]
],
"tags": [
{
"key": "severity",
"operator": "=",
"value": "notice"
},
{
"condition": "AND",
"key": "hostname",
"operator": "=~",
"value": "/^$hostname$/"
},
{
"condition": "AND",
"key": "severity",
"operator": "=~",
"value": "/^$severity$/"
},
{
"condition": "AND",
"key": "appname",
"operator": "=~",
"value": "/^$appname$/"
},
{
"condition": "AND",
"key": "message",
"operator": "=~",
"value": "/$Query/"
}
]
},
{
"alias": "Warning",
"datasource": {
"type": "influxdb",
"uid": "5yfSbJ67k"
},
"groupBy": [
{
"params": [
"1m"
],
"type": "time"
},
{
"params": [
"null"
],
"type": "fill"
}
],
"measurement": "syslog",
"orderByTime": "ASC",
"policy": "default",
"refId": "D",
"resultFormat": "time_series",
"select": [
[
{
"params": [
"severity_code"
],
"type": "field"
},
{
"params": [],
"type": "count"
}
]
],
"tags": [
{
"key": "severity",
"operator": "=",
"value": "warning"
},
{
"condition": "AND",
"key": "hostname",
"operator": "=~",
"value": "/^$hostname$/"
},
{
"condition": "AND",
"key": "severity",
"operator": "=~",
"value": "/^$severity$/"
},
{
"condition": "AND",
"key": "appname",
"operator": "=~",
"value": "/^$appname$/"
},
{
"condition": "AND",
"key": "message",
"operator": "=~",
"value": "/$Query/"
}
]
},
{
"alias": "Error",
"datasource": {
"type": "influxdb",
"uid": "5yfSbJ67k"
},
"groupBy": [
{
"params": [
"1m"
],
"type": "time"
},
{
"params": [
"null"
],
"type": "fill"
}
],
"measurement": "syslog",
"orderByTime": "ASC",
"policy": "default",
"refId": "C",
"resultFormat": "time_series",
"select": [
[
{
"params": [
"severity_code"
],
"type": "field"
},
{
"params": [],
"type": "count"
}
]
],
"tags": [
{
"key": "severity",
"operator": "=",
"value": "err"
},
{
"condition": "AND",
"key": "hostname",
"operator": "=~",
"value": "/^$hostname$/"
},
{
"condition": "AND",
"key": "severity",
"operator": "=~",
"value": "/^$severity$/"
},
{
"condition": "AND",
"key": "appname",
"operator": "=~",
"value": "/^$appname$/"
},
{
"condition": "AND",
"key": "message",
"operator": "=~",
"value": "/$Query/"
}
]
},
{
"alias": "Critical",
"datasource": {
"type": "influxdb",
"uid": "5yfSbJ67k"
},
"groupBy": [
{
"params": [
"1m"
],
"type": "time"
},
{
"params": [
"null"
],
"type": "fill"
}
],
"measurement": "syslog",
"orderByTime": "ASC",
"policy": "default",
"refId": "E",
"resultFormat": "time_series",
"select": [
[
{
"params": [
"severity_code"
],
"type": "field"
},
{
"params": [],
"type": "count"
}
]
],
"tags": [
{
"key": "severity",
"operator": "=",
"value": "crit"
},
{
"condition": "AND",
"key": "hostname",
"operator": "=~",
"value": "/^$hostname$/"
},
{
"condition": "AND",
"key": "severity",
"operator": "=~",
"value": "/^$severity$/"
},
{
"condition": "AND",
"key": "appname",
"operator": "=~",
"value": "/^$appname$/"
},
{
"condition": "AND",
"key": "message",
"operator": "=~",
"value": "/$Query/"
}
]
},
{
"alias": "Alert",
"datasource": {
"type": "influxdb",
"uid": "5yfSbJ67k"
},
"groupBy": [
{
"params": [
"1m"
],
"type": "time"
},
{
"params": [
"null"
],
"type": "fill"
}
],
"measurement": "syslog",
"orderByTime": "ASC",
"policy": "default",
"refId": "F",
"resultFormat": "time_series",
"select": [
[
{
"params": [
"severity_code"
],
"type": "field"
},
{
"params": [],
"type": "count"
}
]
],
"tags": [
{
"key": "severity",
"operator": "=",
"value": "alert"
},
{
"condition": "AND",
"key": "hostname",
"operator": "=~",
"value": "/^$hostname$/"
},
{
"condition": "AND",
"key": "severity",
"operator": "=~",
"value": "/^$severity$/"
},
{
"condition": "AND",
"key": "appname",
"operator": "=~",
"value": "/^$appname$/"
},
{
"condition": "AND",
"key": "message",
"operator": "=~",
"value": "/$Query/"
}
]
},
{
"alias": "Debug",
"datasource": {
"type": "influxdb",
"uid": "5yfSbJ67k"
},
"groupBy": [
{
"params": [
"1m"
],
"type": "time"
},
{
"params": [
"null"
],
"type": "fill"
}
],
"measurement": "syslog",
"orderByTime": "ASC",
"policy": "default",
"refId": "G",
"resultFormat": "time_series",
"select": [
[
{
"params": [
"severity_code"
],
"type": "field"
},
{
"params": [],
"type": "count"
}
]
],
"tags": [
{
"key": "severity",
"operator": "=",
"value": "debug"
},
{
"condition": "AND",
"key": "hostname",
"operator": "=~",
"value": "/^$hostname$/"
},
{
"condition": "AND",
"key": "severity",
"operator": "=~",
"value": "/^$severity$/"
},
{
"condition": "AND",
"key": "appname",
"operator": "=~",
"value": "/^$appname$/"
},
{
"condition": "AND",
"key": "message",
"operator": "=~",
"value": "/$Query/"
}
]
}
],
"thresholds": [],
"timeRegions": [],
"title": "syslog count",
"tooltip": {
"shared": true,
"sort": 0,
"value_type": "individual"
},
"type": "graph",
"xaxis": {
"mode": "time",
"show": true,
"values": []
},
"yaxes": [
{
"decimals": 0,
"format": "none",
"label": "Messages / min",
"logBase": 1,
"show": true
},
{
"format": "short",
"logBase": 1,
"show": false
}
],
"yaxis": {
"align": false
}
},
{
"datasource": {
"type": "influxdb",
"uid": "5yfSbJ67k"
},
"description": "",
"fieldConfig": {
"defaults": {
"color": {
"mode": "thresholds"
},
"custom": {
"align": "left",
"displayMode": "auto",
"filterable": false,
"inspect": true
},
"mappings": [],
"thresholds": {
"mode": "absolute",
"steps": [
{
"color": "dark-purple",
"value": null
},
{
"color": "dark-red",
"value": 2
},
{
"color": "dark-orange",
"value": 3
},
{
"color": "dark-yellow",
"value": 4
},
{
"color": "rgb(150, 150, 150)",
"value": 5
},
{
"color": "rgb(51, 51, 51)",
"value": 6
},
{
"color": "rgb(5, 5, 5)",
"value": 7
}
]
}
},
"overrides": [
{
"matcher": {
"id": "byName",
"options": "severity_code"
},
"properties": [
{
"id": "mappings",
"value": [
{
"options": {
"0": {
"text": "Emergency"
},
"1": {
"text": "Alert"
},
"2": {
"text": "Critical"
},
"3": {
"text": "Error"
},
"4": {
"text": "Warning"
},
"5": {
"text": "Notice"
},
"6": {
"text": "Info"
},
"7": {
"text": "Debug"
}
},
"type": "value"
}
]
},
{
"id": "custom.displayMode",
"value": "color-background"
},
{
"id": "custom.width",
"value": 119
}
]
},
{
"matcher": {
"id": "byName",
"options": "Time"
},
"properties": [
{
"id": "custom.width",
"value": 163
}
]
},
{
"matcher": {
"id": "byName",
"options": "hostname"
},
"properties": [
{
"id": "custom.width",
"value": 194
}
]
},
{
"matcher": {
"id": "byName",
"options": "appname"
},
"properties": [
{
"id": "custom.width",
"value": 330
}
]
}
]
},
"gridPos": {
"h": 24,
"w": 24,
"x": 0,
"y": 7
},
"id": 12,
"options": {
"footer": {
"fields": "",
"reducer": [
"sum"
],
"show": false
},
"showHeader": true,
"sortBy": [
{
"desc": true,
"displayName": "Time"
}
]
},
"pluginVersion": "9.3.1",
"targets": [
{
"datasource": {
"type": "influxdb",
"uid": "5yfSbJ67k"
},
"groupBy": [
{
"params": [
"hostname"
],
"type": "tag"
},
{
"params": [
"appname"
],
"type": "tag"
}
],
"measurement": "syslog",
"orderByTime": "ASC",
"policy": "default",
"refId": "A",
"resultFormat": "table",
"select": [
[
{
"params": [
"severity_code"
],
"type": "field"
}
],
[
{
"params": [
"message"
],
"type": "field"
}
]
],
"tags": [
{
"key": "hostname",
"operator": "=~",
"value": "/^$hostname$/"
},
{
"condition": "AND",
"key": "appname",
"operator": "=~",
"value": "/^$appname$/"
},
{
"condition": "AND",
"key": "severity",
"operator": "=~",
"value": "/^$severity$/"
},
{
"condition": "AND",
"key": "message",
"operator": "=~",
"value": "/$Query/"
}
]
}
],
"title": "Syslog Messages",
"type": "table"
}
],
"refresh": "",
"schemaVersion": 37,
"style": "dark",
"tags": [],
"templating": {
"list": [
{
"allValue": "",
"current": {
"selected": false,
"text": "All",
"value": "$__all"
},
"datasource": {
"type": "influxdb",
"uid": "5yfSbJ67k"
},
"definition": "SHOW TAG VALUES FROM syslog WITH KEY=appname",
"hide": 0,
"includeAll": true,
"label": "Appname",
"multi": true,
"name": "appname",
"options": [],
"query": "SHOW TAG VALUES FROM syslog WITH KEY=appname",
"refresh": 2,
"regex": "",
"skipUrlSync": false,
"sort": 1,
"tagValuesQuery": "",
"tagsQuery": "",
"type": "query",
"useTags": false
},
{
"allValue": "",
"current": {
"selected": false,
"text": "All",
"value": "$__all"
},
"datasource": {
"type": "influxdb",
"uid": "5yfSbJ67k"
},
"definition": "SHOW TAG VALUES FROM syslog WITH KEY=hostname",
"hide": 0,
"includeAll": true,
"label": "Hostname",
"multi": true,
"name": "hostname",
"options": [],
"query": "SHOW TAG VALUES FROM syslog WITH KEY=hostname",
"refresh": 2,
"regex": "",
"skipUrlSync": false,
"sort": 1,
"tagValuesQuery": "",
"tagsQuery": "",
"type": "query",
"useTags": false
},
{
"allValue": "",
"current": {
"selected": false,
"text": "All",
"value": "$__all"
},
"datasource": {
"type": "influxdb",
"uid": "5yfSbJ67k"
},
"definition": "SHOW TAG VALUES FROM syslog WITH KEY=severity",
"hide": 0,
"includeAll": true,
"label": "Severity",
"multi": true,
"name": "severity",
"options": [],
"query": "SHOW TAG VALUES FROM syslog WITH KEY=severity",
"refresh": 2,
"regex": "",
"skipUrlSync": false,
"sort": 0,
"tagValuesQuery": "",
"tagsQuery": "",
"type": "query",
"useTags": false
},
{
"current": {
"selected": false,
"text": "",
"value": ""
},
"description": "Querystring",
"hide": 0,
"label": "MessageQuery",
"name": "Query",
"options": [
{
"selected": true,
"text": "",
"value": ""
}
],
"query": "",
"skipUrlSync": false,
"type": "textbox"
}
]
},
"time": {
"from": "now-1h",
"to": "now"
},
"timepicker": {
"refresh_intervals": [
"5s",
" 10s",
" 30s",
" 1m",
" 5m"
],
"time_options": [
"5m",
"15m",
"1h",
"6h",
"12h",
"24h",
"2d",
"7d",
"30d"
]
},
"timezone": "",
"title": "Syslog",
"uid": "TIYeHqRgZ",
"version": 6,
"weekStart": ""
}
Node-Red Flow to pull the data out of Hubitat and load it into a influxDB database. You would need to configure a few of the nodes to: specify your Influxdb instance and your Hub ip for the web socket connection to the logs. I think that is all the setup you would need to do though. This flow has two instances as well as I was testing with InfluxDB2.0. My main database is still Influxdb 1.8
[{"id":"3d1f1994.a4d226","type":"tab","label":"Hubitat Logs","disabled":false,"info":""},{"id":"7afc51e5.c6996","type":"websocket in","z":"3d1f1994.a4d226","name":"Hubitat Prod Logsocket","server":"","client":"1613bf567b05cec3","x":180,"y":200,"wires":[["e703cf77.a29a7"]]},{"id":"e703cf77.a29a7","type":"json","z":"3d1f1994.a4d226","name":"","property":"payload","action":"obj","pretty":false,"x":430,"y":200,"wires":[["9aa13982.b8b418"]]},{"id":"bb0988e7.032bf8","type":"influxdb batch","z":"3d1f1994.a4d226","influxdb":"f6a6c83f5c860ed2","precision":"","retentionPolicy":"","name":"","database":"","retentionPolicyV18Flux":"","org":"","bucket":"","x":930,"y":200,"wires":[]},{"id":"9aa13982.b8b418","type":"function","z":"3d1f1994.a4d226","name":"Syslog Message","func":"let time = new Date(msg.payload.time);\n\nreturn {\n payload: [{\n measurement: \"syslog\",\n fields: {\n facility_code: 1,\n message: unescapeHtml(msg.payload.msg),\n procid: msg.payload.id,\n severity_code: levelToSeverityCode(msg.payload.level),\n timestamp: time.getTime()*1000000, //convert to nanoseconds\n version: 1,\n appname: msg.payload.name,\n facility: msg.payload.type, // \"user\",\n host: \"hubitat\",\n hostname: \"hubitat\",\n severity: levelToSeverity(msg.payload.level)\n },\n tags:{\n appname: msg.payload.name,\n facility: msg.payload.type, // \"user\",\n host: \"hubitat\",\n hostname: \"hubitat\",\n severity: levelToSeverity(msg.payload.level)\n },\n timestamp: time\n }]\n};\n\n// For info on the message format: https://www.influxdata.com/blog/writing-logs-directly-to-influxdb/\n\n\nfunction unescapeHtml(unsafe) {\n if (!unsafe)\n return unsafe;\n return unsafe\n .replace(/&/g, \"&\")\n .replace(/</g, \"<\")\n .replace(/>/g, \">\")\n .replace(/"/g, \"\\\"\")\n .replace(//g, \"'\")\n .replace(/'/g, \"'\")\n .replace(/'/g, \"'\");\n}\n\n/*\n0\tEmergency\temerg\tSystem is unusable\tThis level should not be used by applications.\n1\tAlert\talert\tShould be corrected immediately\tLoss of the primary ISP connection.\n2\tCritical\tcrit\tCritical conditions\tA failure in the system's primary application.\n3\tError\terr\tError conditions\tAn application has exceeded its file storage limit and attempts to write are failing.\n4\tWarning\twarning\tMay indicate that an error will occur if action is not taken.\tA non-root file system has only 2GB remaining.\n5\tNotice\tnotice\tEvents that are unusual, but not error conditions.\t \n6\tInformational\tinfo\tNormal operational messages that require no action.\tAn application has started, paused or ended successfully.\n7\tDebug\tdebug\tInformation useful to developers for debugging the application.\t \n*/\n\nfunction levelToSeverityCode(level) {\n switch (msg.payload.level) {\n case \"error\":\n return 3;\n case \"warn\":\n return 4;\n case \"info\":\n return 6;\n default:\n return 7;\n }\n}\n\nfunction levelToSeverity(level) {\n switch (level) {\n case \"error\":\n return \"err\";\n case \"warn\":\n return \"warning\";\n case \"info\":\n return \"info\";\n default:\n return \"debug\"\n }\n}","outputs":1,"noerr":0,"initialize":"","finalize":"","libs":[],"x":600,"y":200,"wires":[["d2eee62c.f29988"]]},{"id":"d2eee62c.f29988","type":"batch","z":"3d1f1994.a4d226","name":"","mode":"interval","count":10,"overlap":0,"interval":10,"allowEmptySequence":false,"topics":[],"x":770,"y":200,"wires":[["bb0988e7.032bf8","f7063a6e8394b1e5"]]},{"id":"f7063a6e8394b1e5","type":"debug","z":"3d1f1994.a4d226","name":"","active":true,"tosidebar":true,"console":false,"tostatus":false,"complete":"false","statusVal":"","statusType":"auto","x":1150,"y":160,"wires":[]},{"id":"fad7642a815cf7c5","type":"websocket in","z":"3d1f1994.a4d226","name":"","server":"","client":"1613bf567b05cec3","x":230,"y":500,"wires":[["6e775f809cd8a12e"]]},{"id":"6e775f809cd8a12e","type":"json","z":"3d1f1994.a4d226","name":"","property":"payload","action":"obj","pretty":false,"x":450,"y":500,"wires":[["76d0862f4cec7643","027aa270775a3f91"]]},{"id":"8b57e6ee2cf72fb4","type":"influxdb batch","z":"3d1f1994.a4d226","influxdb":"28c23ac040b5d5c7","precision":"","retentionPolicy":"","name":"","database":"","precisionV18FluxV20":"ms","retentionPolicyV18Flux":"","org":"3b0079911a1f637f","bucket":"34d1b0922b5240a2","x":950,"y":500,"wires":[]},{"id":"76d0862f4cec7643","type":"function","z":"3d1f1994.a4d226","name":"Syslog Message","func":"let time = new Date(msg.payload.time);\n\nreturn {\n payload: [{\n measurement: \"syslog\",\n fields: {\n facility_code: 1,\n message: unescapeHtml(msg.payload.msg),\n procid: msg.payload.id,\n severity_code: levelToSeverityCode(msg.payload.level),\n timestamp: time.getTime()*1000000, //convert to nanoseconds\n version: 1,\n appname: msg.payload.name,\n facility: msg.payload.type, // \"user\",\n host: \"hubitat\",\n hostname: \"hubitat\",\n severity: levelToSeverity(msg.payload.level)\n },\n tags:{\n appname: msg.payload.name,\n facility: msg.payload.type, // \"user\",\n host: \"hubitat\",\n hostname: \"hubitat\",\n severity: levelToSeverity(msg.payload.level)\n },\n timestamp: time\n }]\n};\n\n// For info on the message format: https://www.influxdata.com/blog/writing-logs-directly-to-influxdb/\n\n\nfunction unescapeHtml(unsafe) {\n if (!unsafe)\n return unsafe;\n return unsafe\n .replace(/&/g, \"&\")\n .replace(/</g, \"<\")\n .replace(/>/g, \">\")\n .replace(/"/g, \"\\\"\")\n .replace(//g, \"'\")\n .replace(/'/g, \"'\")\n .replace(/'/g, \"'\");\n}\n\n/*\n0\tEmergency\temerg\tSystem is unusable\tThis level should not be used by applications.\n1\tAlert\talert\tShould be corrected immediately\tLoss of the primary ISP connection.\n2\tCritical\tcrit\tCritical conditions\tA failure in the system's primary application.\n3\tError\terr\tError conditions\tAn application has exceeded its file storage limit and attempts to write are failing.\n4\tWarning\twarning\tMay indicate that an error will occur if action is not taken.\tA non-root file system has only 2GB remaining.\n5\tNotice\tnotice\tEvents that are unusual, but not error conditions.\t \n6\tInformational\tinfo\tNormal operational messages that require no action.\tAn application has started, paused or ended successfully.\n7\tDebug\tdebug\tInformation useful to developers for debugging the application.\t \n*/\n\nfunction levelToSeverityCode(level) {\n switch (msg.payload.level) {\n case \"error\":\n return 3;\n case \"warn\":\n return 4;\n case \"info\":\n return 6;\n default:\n return 7;\n }\n}\n\nfunction levelToSeverity(level) {\n switch (level) {\n case \"error\":\n return \"err\";\n case \"warn\":\n return \"warning\";\n case \"info\":\n return \"info\";\n default:\n return \"debug\"\n }\n}","outputs":1,"noerr":0,"initialize":"","finalize":"","libs":[],"x":620,"y":500,"wires":[["5f4c7dfaabf8c70b","048bbca127034706"]]},{"id":"5f4c7dfaabf8c70b","type":"batch","z":"3d1f1994.a4d226","name":"","mode":"interval","count":10,"overlap":0,"interval":10,"allowEmptySequence":false,"topics":[],"x":790,"y":500,"wires":[["8b57e6ee2cf72fb4","02a9a5f2c43a9474"]]},{"id":"027aa270775a3f91","type":"debug","z":"3d1f1994.a4d226","name":"","active":true,"tosidebar":true,"console":false,"tostatus":false,"complete":"false","statusVal":"","statusType":"auto","x":610,"y":440,"wires":[]},{"id":"048bbca127034706","type":"debug","z":"3d1f1994.a4d226","name":"","active":true,"tosidebar":true,"console":false,"tostatus":false,"complete":"false","statusVal":"","statusType":"auto","x":990,"y":440,"wires":[]},{"id":"02a9a5f2c43a9474","type":"debug","z":"3d1f1994.a4d226","name":"","active":true,"tosidebar":true,"console":false,"tostatus":false,"complete":"false","statusVal":"","statusType":"auto","x":1110,"y":620,"wires":[]},{"id":"5f36cb3b255b39ca","type":"function","z":"3d1f1994.a4d226","name":"","func":"[{\"id\":\"3d1f1994.a4d226\",\"type\":\"tab\",\"label\":\"Hubitat Logs\",\"disabled\":false,\"info\":\"\"},{\"id\":\"7afc51e5.c6996\",\"type\":\"websocket in\",\"z\":\"3d1f1994.a4d226\",\"name\":\"\",\"server\":\"\",\"client\":\"9367365.4710bc8\",\"x\":210,\"y\":200,\"wires\":[[\"e703cf77.a29a7\"]]},{\"id\":\"e703cf77.a29a7\",\"type\":\"json\",\"z\":\"3d1f1994.a4d226\",\"name\":\"\",\"property\":\"payload\",\"action\":\"obj\",\"pretty\":false,\"x\":430,\"y\":200,\"wires\":[[\"9aa13982.b8b418\"]]},{\"id\":\"bb0988e7.032bf8\",\"type\":\"influxdb batch\",\"z\":\"3d1f1994.a4d226\",\"influxdb\":\"991c0352.4c569\",\"precision\":\"\",\"retentionPolicy\":\"\",\"name\":\"\",\"x\":980,\"y\":200,\"wires\":[]},{\"id\":\"9aa13982.b8b418\",\"type\":\"function\",\"z\":\"3d1f1994.a4d226\",\"name\":\"Syslog Message\",\"func\":\"let time = new Date(msg.payload.time);\\n\\nreturn {\\n payload: [{\\n measurement: \\\"syslog\\\",\\n fields: {\\n facility_code: 1,\\n message: unescapeHtml(msg.payload.msg),\\n procid: msg.payload.id,\\n severity_code: levelToSeverityCode(msg.payload.level),\\n timestamp: time.getTime()*1000000, //convert to nanoseconds\\n version: 1\\n },\\n tags:{\\n appname: msg.payload.name,\\n facility: msg.payload.type, // \\\"user\\\",\\n host: \\\"hubitat\\\",\\n hostname: \\\"hubitat\\\",\\n severity: levelToSeverity(msg.payload.level)\\n },\\n timestamp: time\\n }]\\n};\\n\\n// For info on the message format: https://www.influxdata.com/blog/writing-logs-directly-to-influxdb/\\n\\n\\nfunction unescapeHtml(unsafe) {\\n if (!unsafe)\\n return unsafe;\\n return unsafe\\n .replace(/&/g, \\\"&\\\")\\n .replace(/</g, \\\"<\\\")\\n .replace(/>/g, \\\">\\\")\\n .replace(/"/g, \\\"\\\\\\\"\\\")\\n .replace(//g, \\\"'\\\")\\n .replace(/'/g, \\\"'\\\")\\n .replace(/'/g, \\\"'\\\");\\n}\\n\\n/*\\n0\\tEmergency\\temerg\\tSystem is unusable\\tThis level should not be used by applications.\\n1\\tAlert\\talert\\tShould be corrected immediately\\tLoss of the primary ISP connection.\\n2\\tCritical\\tcrit\\tCritical conditions\\tA failure in the system's primary application.\\n3\\tError\\terr\\tError conditions\\tAn application has exceeded its file storage limit and attempts to write are failing.\\n4\\tWarning\\twarning\\tMay indicate that an error will occur if action is not taken.\\tA non-root file system has only 2GB remaining.\\n5\\tNotice\\tnotice\\tEvents that are unusual, but not error conditions.\\t \\n6\\tInformational\\tinfo\\tNormal operational messages that require no action.\\tAn application has started, paused or ended successfully.\\n7\\tDebug\\tdebug\\tInformation useful to developers for debugging the application.\\t \\n*/\\n\\nfunction levelToSeverityCode(level) {\\n switch (msg.payload.level) {\\n case \\\"error\\\":\\n return 3;\\n case \\\"warn\\\":\\n return 4;\\n case \\\"info\\\":\\n return 6;\\n default:\\n return 7;\\n }\\n}\\n\\nfunction levelToSeverity(level) {\\n switch (level) {\\n case \\\"error\\\":\\n return \\\"err\\\";\\n case \\\"warn\\\":\\n return \\\"warning\\\";\\n case \\\"info\\\":\\n return \\\"info\\\";\\n default:\\n return \\\"debug\\\"\\n }\\n}\",\"outputs\":1,\"noerr\":0,\"x\":600,\"y\":200,\"wires\":[[\"d2eee62c.f29988\"]]},{\"id\":\"d2eee62c.f29988\",\"type\":\"batch\",\"z\":\"3d1f1994.a4d226\",\"name\":\"\",\"mode\":\"interval\",\"count\":10,\"overlap\":0,\"interval\":10,\"allowEmptySequence\":false,\"topics\":[],\"x\":770,\"y\":200,\"wires\":[[\"bb0988e7.032bf8\"]]},{\"id\":\"9367365.4710bc8\",\"type\":\"websocket-client\",\"path\":\"ws://192.168.1.70/logsocket\",\"tls\":\"\",\"wholemsg\":\"false\"},{\"id\":\"991c0352.4c569\",\"type\":\"influxdb\",\"hostname\":\"192.168.1.177\",\"port\":\"8086\",\"protocol\":\"http\",\"database\":\"hubitat\",\"name\":\"\",\"usetls\":false,\"tls\":\"\"}]","outputs":1,"noerr":0,"initialize":"","finalize":"","libs":[],"x":700,"y":740,"wires":[[]]},{"id":"1613bf567b05cec3","type":"websocket-client","path":"ws://192.168.86.35/logsocket","tls":"","wholemsg":"false","hb":"15","subprotocol":""},{"id":"f6a6c83f5c860ed2","type":"influxdb","hostname":"192.168.86.10","port":"8086","protocol":"http","database":"HubitatLog","name":"Hubitat Logs","usetls":false,"tls":"","influxdbVersion":"1.x","url":"http://localhost:8086","rejectUnauthorized":true},{"id":"28c23ac040b5d5c7","type":"influxdb","hostname":"127.0.0.1","port":"8086","protocol":"http","database":"database","name":"Influxdb2.0","usetls":false,"tls":"","influxdbVersion":"2.0","url":"http://192.168.86.10:8087","rejectUnauthorized":false}]
2 Likes
Maker API lets you set a URL to which every event is POSTed. Point the URL at some web server and have a CGI script save the events into your favourite database. I outlined saving events into a file and using gnuplot here: Simple event graphing using Linux tools and gnuplot
I got tired of having the web server constantly servicing events and filling up my Apache logs, so I changed the Maker API URL to point to a different port and used xinetd to listen on that port and run the program that adds the date and saves the JSON records. I could have used the same script, but I took the opportunity to write some C code instead. (That's the first C program I've written in about a decade.)
Feature request: Have Maker API put the date (seconds since epoch, UTC) into the event record so that I don't have to do it.
I have this Hubitat with a lot of empty disk space; why wouldn't I save everything I can? I don't have CPU or database size problems yet, so I'll continue.
I do use Maker API to send events via URL to another machine for logging, but with network rewiring and machine reboots and downtime, a few events get lost. I like to know that I can get at all the events even when the external logging drops a few for whatever reason.
I haven't checked the contents of my external Maker API event log file against the records kept on Hubitat. I'd be interested to see how many records go missing.
Feature Request: Have Maker API put the date (seconds since epoch, UTC) into the event record so that I don't have to do it.
Feature Request: A button (and web API) to download all the events for a device. I know you can write a crazy URL to do it, but that's crazy: Downloading events, is there a method to download all at once? - #8 by DriftN2Forty
FYI, it would be much more efficient to make use of the eventlog logsocket websocket. In addition, it has the time stamps that you desire.
3 Likes
Sure, but when I search for variations on eventlog websocket in the documentation, it says "No pages matching your query." Please give me some words that match the documentation, or a pointer to the actual documentation?
Just curious, but are you going to, for example, look at when you triggered a motion sensor a year ago? What does data like that do for you for you or your home? Is there something I am missing in home automation that I should be doing by analyzing data like this?
That is where I think you are overlooking a some things. As one example, solid state memory has limited read/write cycles. You are wearing on the memory by doing this. It would not surprise me to see a premature failure from this excessive read and writes.
3 Likes
Chuck Schwer described eventsocket and logsocket on the forum probably sometime in 2018. You'll have to search for those terms - that's the only documentation that I know of, because both of these websocket endpoints are unofficial.
That being said, here are the websocket endpoints that I am aware of (replace hubitat_ip with the IP address of your hub)
Event Socket
ws://hubitat_ip/eventsocket
Log Socket
ws://hubitat_ip/logsocket
Zigbee Log Socket
ws://hubitat_ip/zigbeeLogsocket
Z-Wave Log Socket
ws://hubitat_ip/zwaveLogsocket
They're all pretty easy to parse
1 Like
Respectfully, I don’t think this is a convincing rationale, whether one is referring to digital bits or physical objects.
I’m not really here to convince anyone otherwise, but to the extent that feature requests have to be prioritized, IMHO the requests made here should be nowhere near the top of the staff’s presumably long list.
4 Likes
They don't make the list. This falls squarely within the domain of a custom app or on an outside system.
5 Likes
And therein lies one of the great advantages of a system like Hubitat.
For edge use cases, anyone that’s sufficiently motivated can do as they please.
4 Likes
This is the approach that most people who need that kind of data have taken. And it is pretty easy to implement using the websocket endpoints that I indicated. And while those are unofficial, staff have indicated that they are not likely to go away.
You could even do it as a little NodeJS app running on a Mac/Windows computer or an RPi.
3 Likes
The Node-Red flow above actually uses the log websocket to capture the data.
3 Likes
Using the Maker API URL I don't need to install any other packages, not NodeJS or NodeRED or anything. I'll read up on these websocket things, but even a little beta-version command-line program to dump the websocket feed is 495 lines of Java: Releases · ianparkinson/helog · GitHub My CGI script to save the JSON record from Maker API is three lines of shell script, one of which defines a variable and one is echo. Even the C program I wrote to replace the script under xinetd is only 72 lines. I'd love a much more efficient interface, but do I have to use 495 lines of Java to get it?

