I've been having issues with one of my network devices resetting randomly. I believe I've tracked it down to Hubitat generating excessive multicast queries. Using wireshark I can see where normally the Hubitat hub sends 5-10 requests a second. Then randomly it will have a 'storm' and do in excess of a 1000 a second.
What can I do to start hunting down what's causing this?
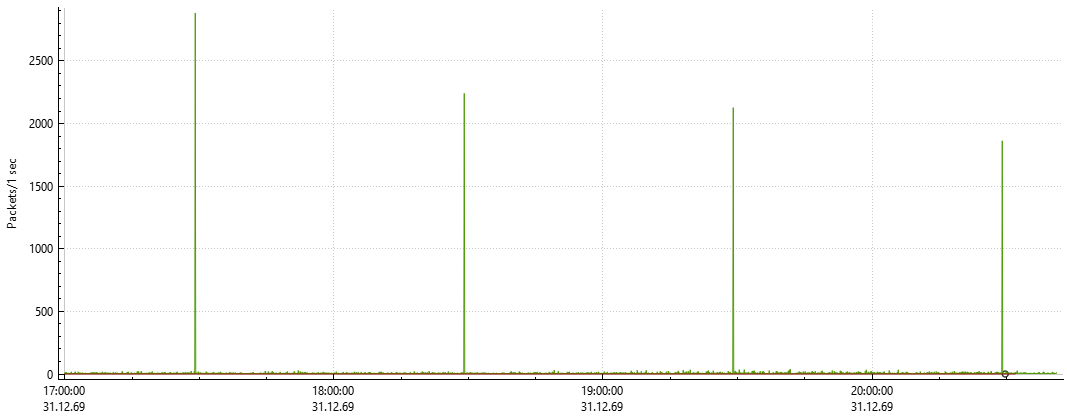
I ran WireShark and captured several hours of traffic. The MDNS storms occur exactly every hour from each other. I'm not sure if that's also correlated to being on the hour or half hour and haven't seen a way to get a world time out of the logs.
I didn't capture hours but I did run TCPDUMP for more than half an hour... On average there were 10 packets-per-second (pps) of mDNS data. Within that, there were bursts of ~200 packets in 2 seconds from a single Hubitat hub. I saw that burst twice, from different Hubs. I was not able to confirm any 1000 pps 'floods' during the sampling window.
I mis-read one of your statements and thought that I could capture 1 flood in any 35 min slice of time. I'll try again on the other half and see if I get one too.
I ran tcpdump to cover the half hour window, the 100pps burst I did see (and count) occurred at 22:13:37
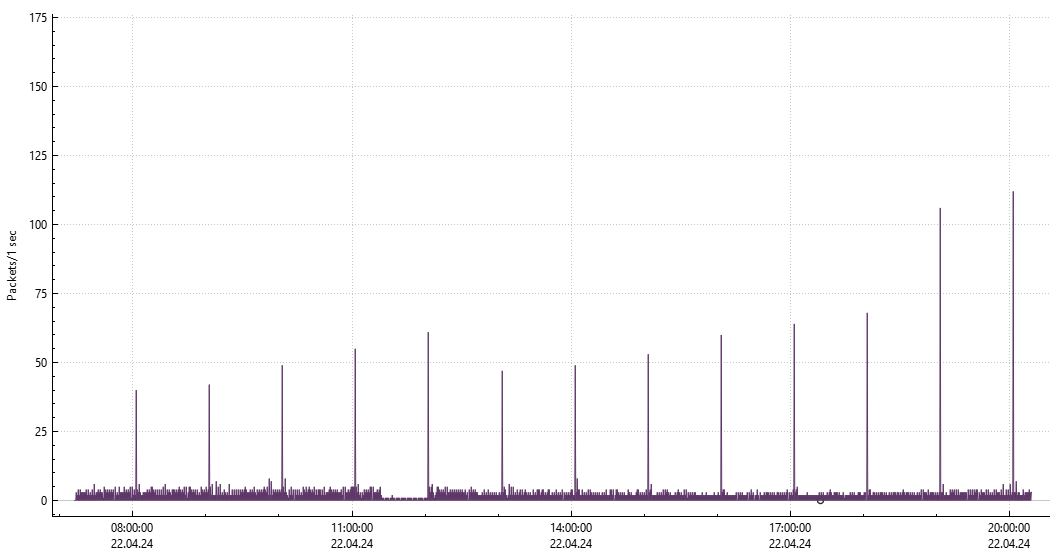
I collected data all day after updating to the newest firmware on Hubitat. Its no longer sending out a burst in the 1000's, but it is still doing a large jump every hour. It looks like the amount is growing each time, so maybe over the course of a week the amount would be even greater? Some type of error in the mDNS implementation maybe?
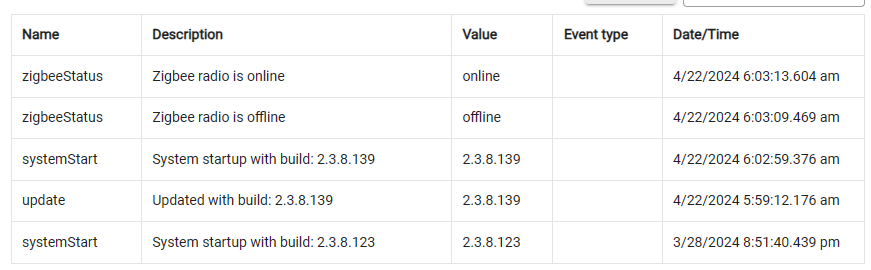
The startup time in the hubitat log shows it coming up at 6:02AM and the spikes are an hour apart at 2 minutes past the hour. This suggests the hub is doing this independently.
What is the network device that is resetting? I have recently had some issues with some WLED ESP32 boards randomly crashing consistently. I shut down the C7 and problem 100% went away. Now I need a workaround.
I have an ESP32 running the latest WLED, as well as an ESP8266 and this mDNS issue causes the ESP32 to reboot itself. My current theory is that the amount of messages the Hubitat hub transmits each hour grows and given enough time, it hits a level where the ESP32 can no longer handle it.
Unfortunately, I upgraded my hub before trying just a reboot. I can't tell if the behaviour change was due to the new firmware or the reboot, maybe both? I plan on sampling data tomorrow to see if the traffic is growing over time as predicted.
I finally got a moment to do that top-of-the-hour tcpdump and the average remains ~10pps
However, there is a burst and it's big enough to go up a category to Flood. 2375 packets: 1 second. One hub, almost 2400 packets in just under 1 second. Downright chatty
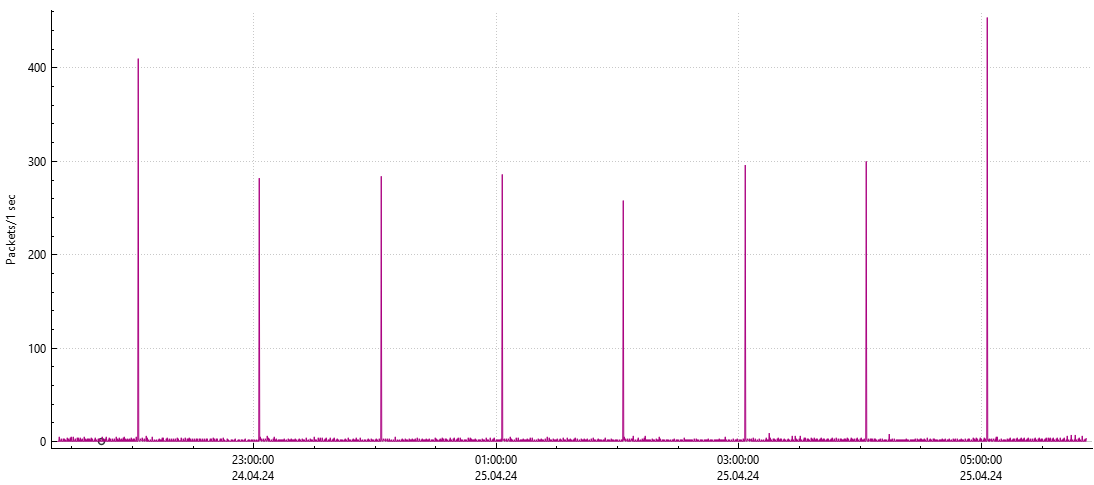
I ran another capture last night and the amount of packets continues to grow. Below is data from last night to this AM. Note they are all around 300'ish. A day ago, just after resetting (see earlier post), the hourly surge was around 50. There is definitely growth of the issue.
Do you have any special setup to do this or are you just running Wireshark with promiscuous mode? If I recall correctly I think you may need to have a switch you can configure to send all packets to the sniffing device? I don't think I can do that on my basic home router. I would have to put a dumb switch inline with my hub and another PC so that it could capture the traffic.