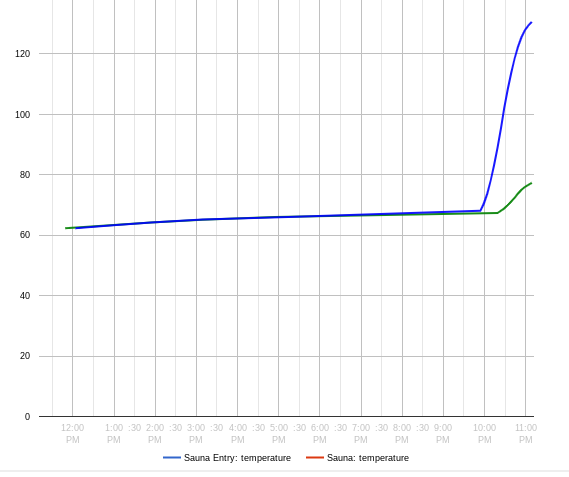
I'm running the most recent version and seeing unusual behavior for the legend with my Time Graph - Line graph. I mostly picked the defaults for a graph of 2 temperature sensors and am seeing two issues:
Colors on the legend don't match the plot (plot is blue and green, legend is blue and red) In my configuration page it shows blue for Sauna and green for Sauna Entry.
The sensor names are reversed in the legend. I checked on a dashboard with the sensors and names are correct there. [Edit: I guess I don't really know what is going on here since the colors in legend don't match the plot]
I'm using Package Manager to do the installs/upgrades. For what it is worth I also have two other active graphs using the Line Graph module that I haven't moved over to Time Graph (legend is correct on those).
I left both Time Graphs installed in case you want me to try something for you to fix.
Thanks for looking; no, I would delete the old one. Something has happened in package manager... I need to figure it out. As far as Line Graphs goes, I would move over to Time Graphs. It supports more options and has a few memory leaks fixed if you are using them on a dashboard (like I am)
My graph was definitely using the older version, had to delete the graph child before it would let me delete the old app code. Also noticed that newer features were not showing up like the long term storage and longer than a week of data until I deleted the older app. Everything is good with the legend now (and I updated my Line Graph to Time Graph).
Just thought I would point out the graphs don't work if you are using the local https url instead. I am assuming you are using hardcoded url's instead of relative ?
@thomas.c.howard - I found today while adding some devices to my heat map that the order got scrambled...
Is there a way to have the app "Remember" the order of devices when new ones are added?
As you know, it can take quite some time to odder devices on a large heat map...
Also, is there any way to make the Graph Order device boxes less tall so that more of them can be seen at once? This would help when ordering them, because otherwise, it is difficult to move them from the top to the bottom or vice-versa...
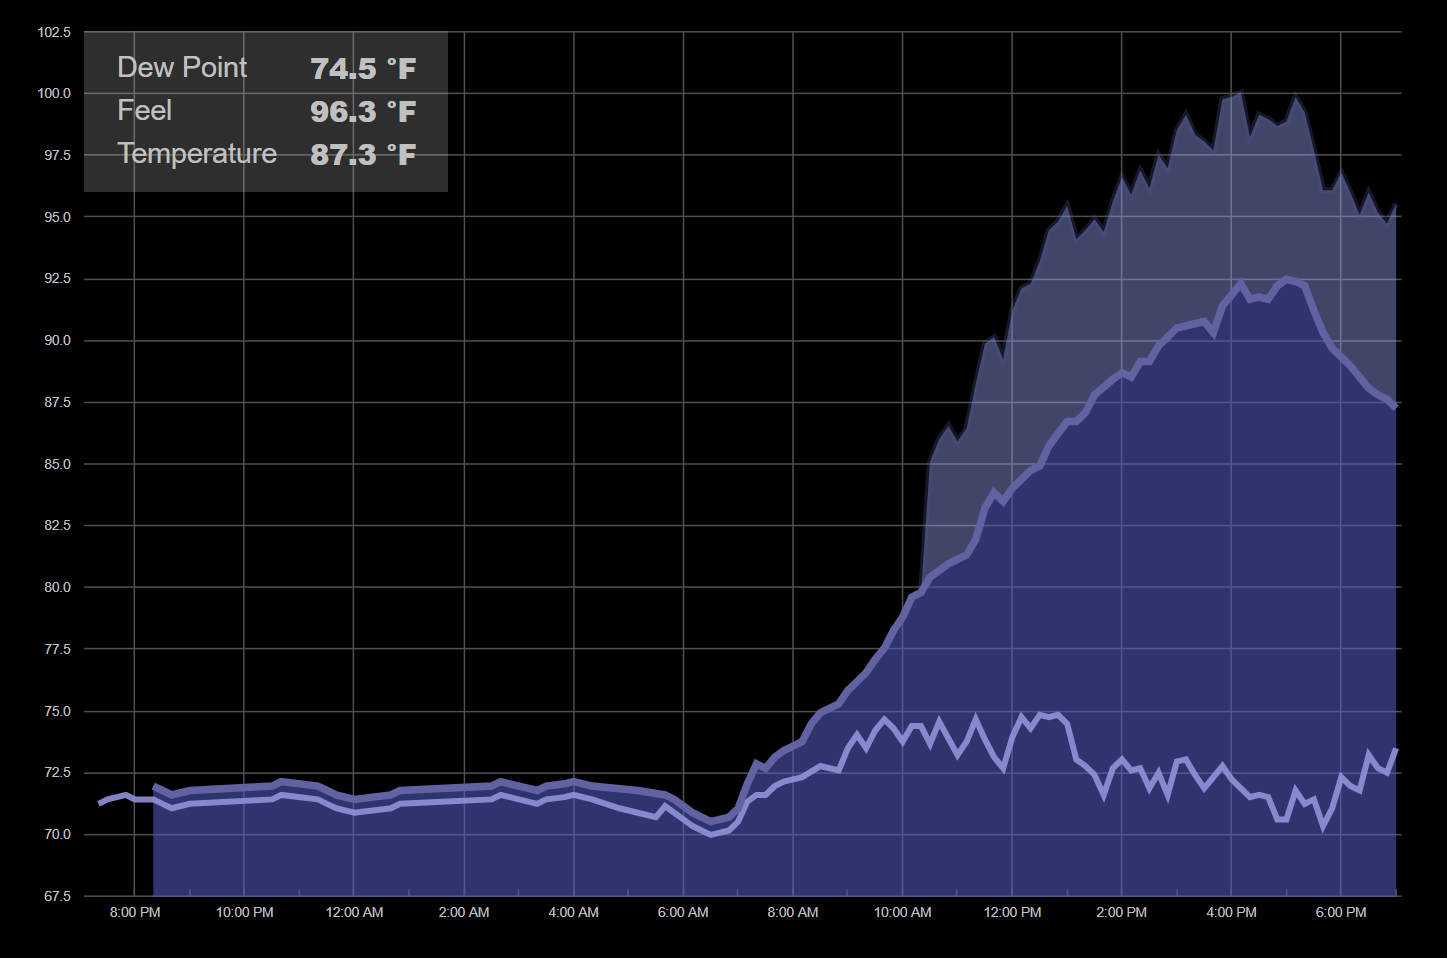
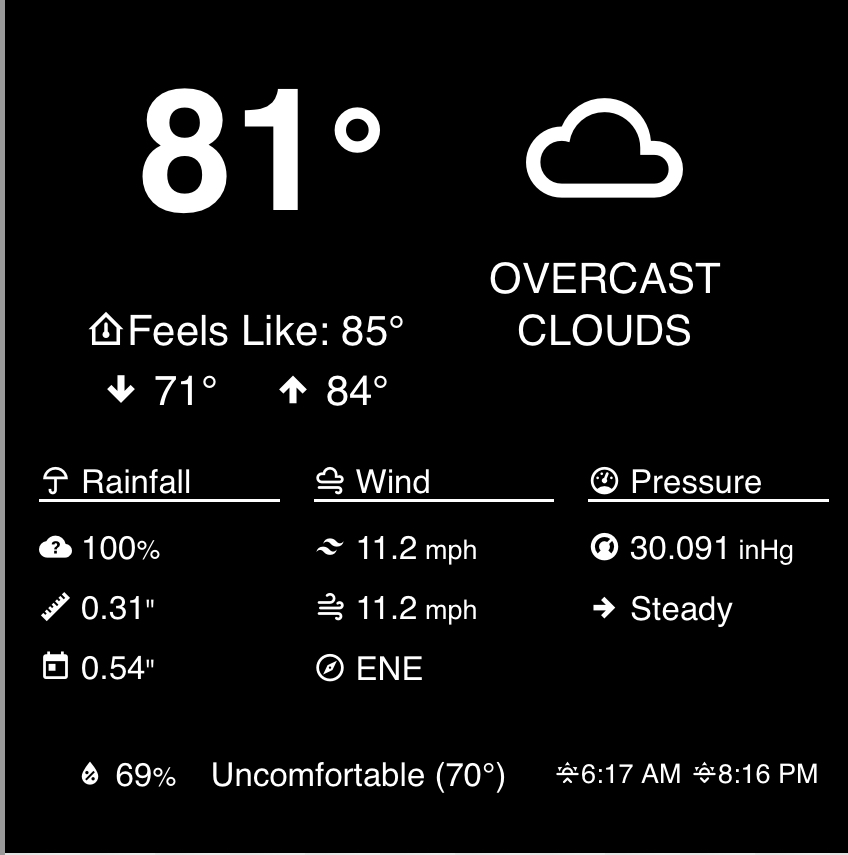
I saw you put the dewpoint feeling up by the weather icon. Nicer this way. Small bugs: "OPPERESSIVE" is misspelled (OPPRESSIVE; line 1668), and "PLEASENT" is misspelled (PLEASANT; line 1664).
Again, I have problems with the size increasing. It maxes at 150px high, no matter what size the tile is. If I add the following custom CSS that fixes it:
Great job on the tile, I just installed it and it looks great. A couple of requests if I may...
Can you report pressure in hPa and wind speed in km/h?
Also, I would like to get this working with my EcoWitt PWS, are able to provide details of what you are expecting in terms of attributes or whatever the method is you have used so I can pass it over to the developer?
Thanks again for your efforts in setting this up,
Simon
I don't know if it was mentioned before, but I'd love it if your color selection could use alpha values. I don't know if that was discussed and not easy to implement. Would be nice if I could set the background to partially transparent, which my other tiles are.
That said, these are really great looking tiles. You've made some useful and beautiful graphs and tiles!