LOL I can't believe I didn't see that! And I looked twice! I guess I'm more tired than I thought...
1 Like
Going on 10 minutes, and still stuck on step 4. 
Oh wow! Yea, that's long...
@mluck: Then something is broken... Possibly a non-numeric value? Make sure all the devices have a value selected AND there is a valid number. Do you know how to look at the console on the browser?
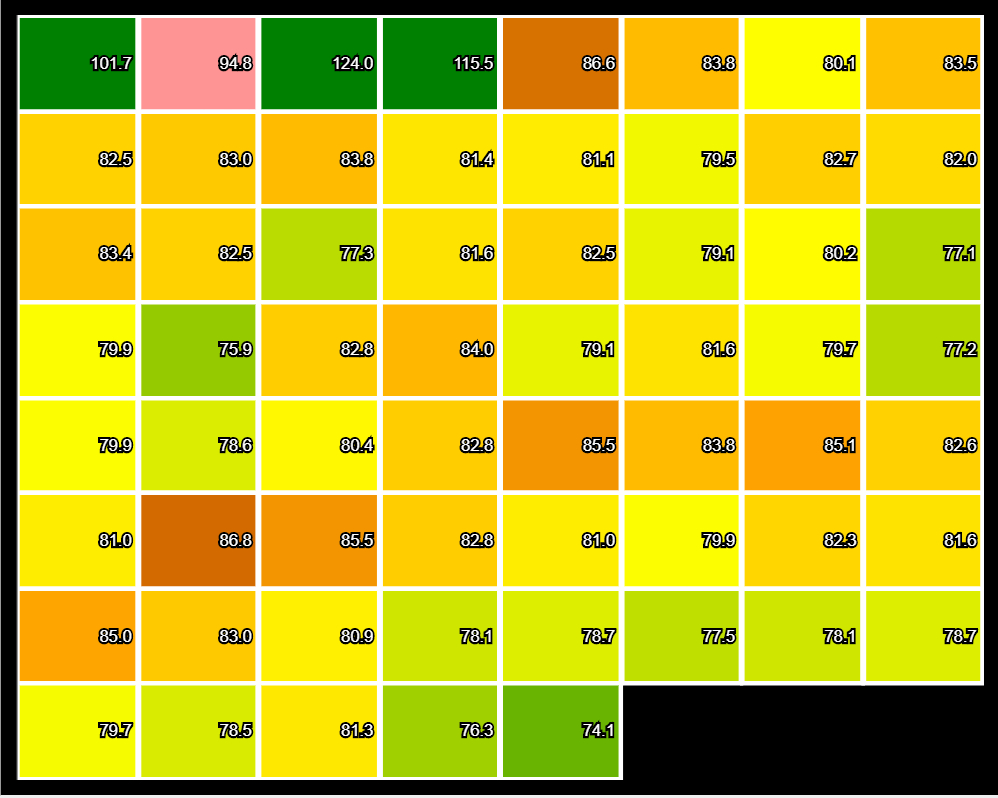
@Sebastien, as much as I appreciate the compliment, I disagree. Some things bothered me about your graph. The zero fields, and the differing number of decimal places. So, I have added an option to choose the same number of decimal places and got rid of the "blank" tiles. See below. Code is updated. By the way mine takes 5 seconds to generate.
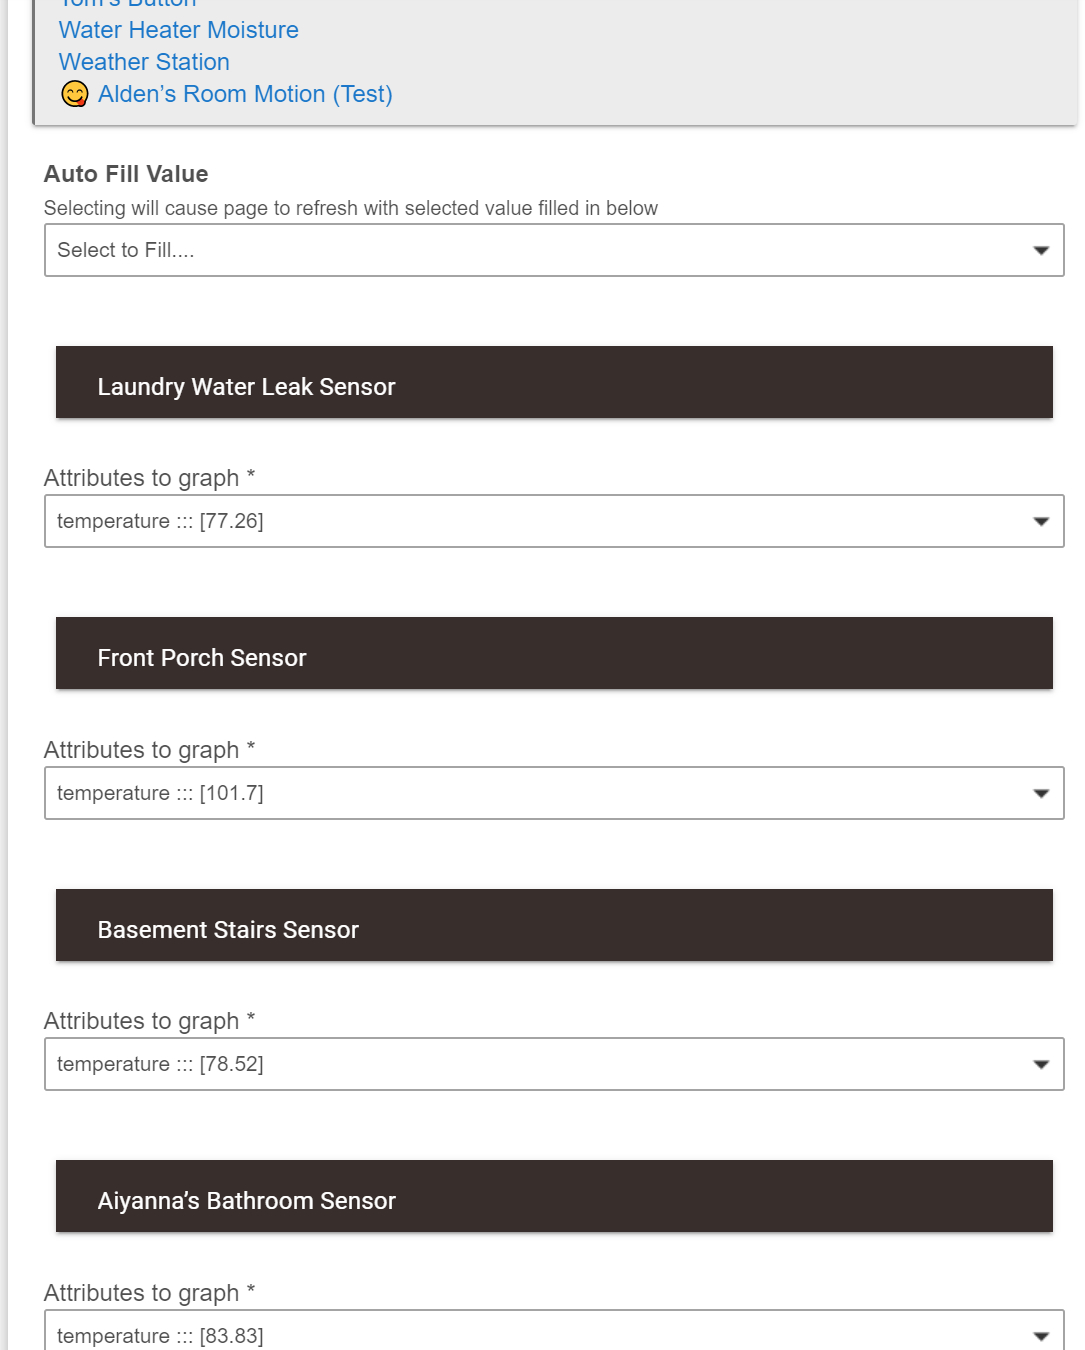
Definitely numeric. I've tried with battery level and with temperature, same result.
I do now ![]() Should I look at something?
Should I look at something?
Chrome? When the page gets stuck at 4/4 hit CTRL-SHIFT-I what is the error that it shows?
I'm an idiot. Because I was using HPM to keep the code current, I neglected to keep HubiGraph.js current as well. Problem solved as soon as I uploaded the latest javascript.
For those who follow (and I'm gonna guess this has been said above in seven places): you can't rely exclusively on HPM for HubiGraphs. You have to also make sure you have the latest HubiGraph.js in your file manager, at least when it changes.
Glad you got it figured out. In the post (a week ago, I did mention I updated the JS). Unfortunately, some things require the JS file (the Gradient computations as an example) and HPM doesn't support...yet. I change things too much I think...
1 Like
This must frustrate you? You provide instructions, maybe you even lay them out multiple times, then some schmuck like me comes along, skips over the details, and causes unnecessary noise.
Er, umm, sorry. Still this is an amazing app. Props.
2 Likes
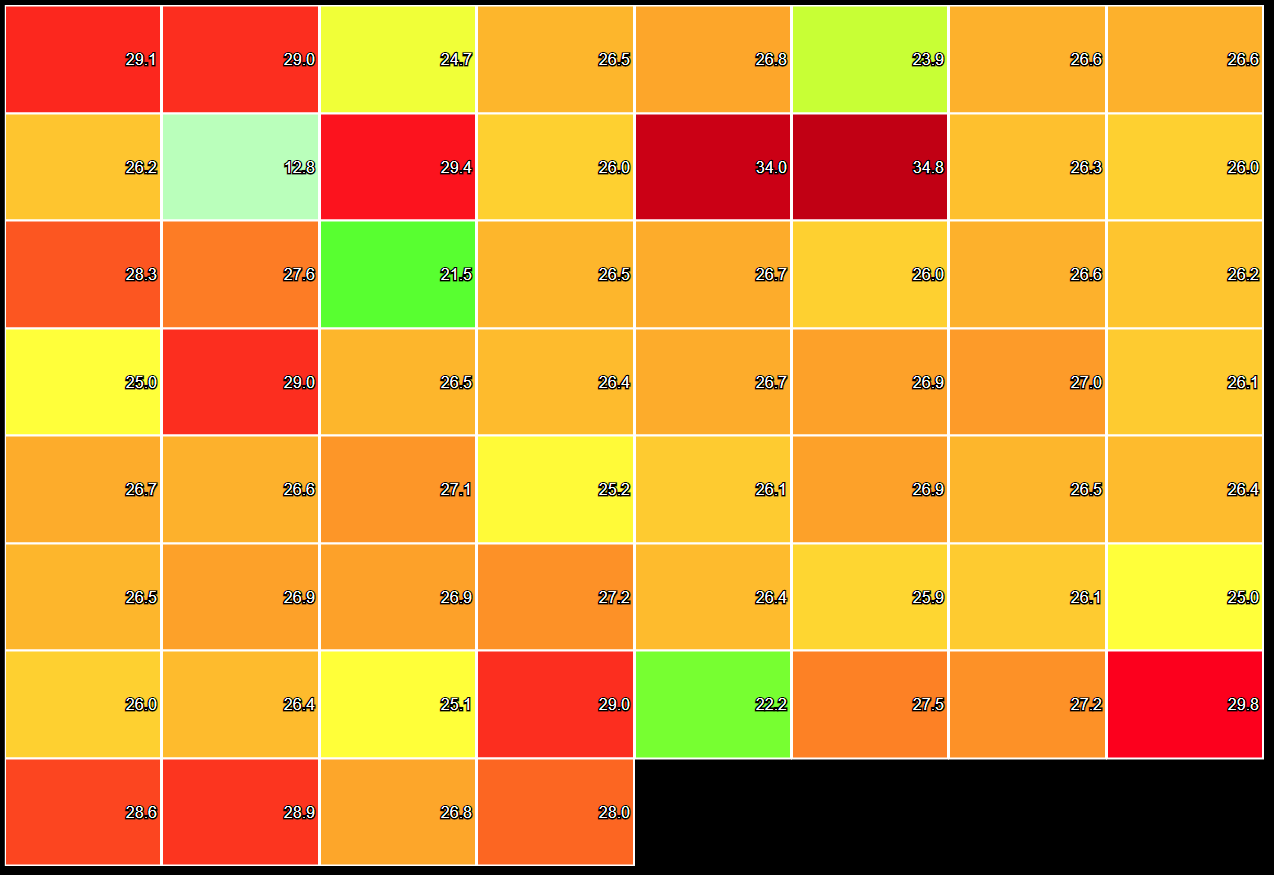
Well, I don't say this often, but I really appreciate that you disagreed with me! ![]() I also really like the white lines on black back background. I have copied it for mine. Now how do you like the numbers being on the right?... Might be even nicer if they were centered?
I also really like the white lines on black back background. I have copied it for mine. Now how do you like the numbers being on the right?... Might be even nicer if they were centered? ![]()
Wow!!! I suspect the time it takes mine is due to the "slowness" of my hub... (If I don't reboot it, daily, it becomes slow as molasses on a cold Canadian day... but that's another issue...)
- Getting... (1/2) takes less than a second - (I don't even have time to see the event name...)
- Getting device data (2/4) - over 45 seconds
- Getting events (3/4) - less than 1 second
- ... (1/4) - a fraction of a second
No issues; I principally do this because I want it on my home dashboard (I run 5 graphs in tiles). That said, I actually enjoy helping people debug; it helps me find issues and improve the app. Thanks for trying it out.
1 Like
The slowness at stage 2 is strange. How much is your log printing? Stage 2 is less than a second for me.
Centered numbers? Now THAT is a frustration. I have been researching for a few hours here and there how to fix it. Sometimes Google drives me nuts! It is by far the easiest and most capable solution (I have looked at others), but it has some "unavailable options" that kill me!
If you mean how much stuff gets written to the log, right now I see about 2-3 events every second...
Hehe... Sounds like it is! ![]()
So... not to debug your hub, but I have noticed that if I turn off all logging (info & debug) my hub performs MUCH better. In fact, my log only prints something that is an error, or something I cannot turn off. Doing that, I have not experienced hub slowness in months! (I never reboot). Just a suggestion.
1 Like
You know, that sounds like a very good idea! I will give that a try, if it can speed things up, I would be very happy!
On an unrelated note. I was wondering, the new option to save the data, is there some way that that data could be exported? I am worried about saving too much and filling my hub's disk/memory space, but am thinking that it would be nice if somehow I could export the data for future use/reporting...
As soon as the powers that be open up the api to write files, I have the HubiGraph code ready to support it. Exporting to file would not be hard, but importing it....
1 Like
I went through and disabled all logging. I already see a really big difference! Who knew! I guess if you reduce the amount of activity, the hub performs better! ![]() It is the little things sometimes that can make a big difference!
It is the little things sometimes that can make a big difference!
Now to see if I can get the owners of the custom drivers that continue to add to the logs to see if there is something they can do about it...
1 Like
I went through the custom drivers I had and just commented out the log statements and it worked for me.
2 Likes
That sounds easy! Thanks! I might try that out!
Yea just stick // at the beginning of the line.
Here's an example:
// log.debug "Parsing '${description}'"
2 Likes

