Package manager is complaining about the format of the manifest...? I'll update the tile driver manually for now.
@sburke781, I was making another update. Probably conflicted...
@BrianP, opacity added as an option in the tile config page. new version uploaded.
2 Likes
Thanks for the updates and in such quick time.
I still needed to update the app code manually, not sure what was happening... could be something in package manager as well, I updated it earlier when I installed HubiGraphs. I'll check it again in an hour or so and see if it sorts itself out.
The km/h and hPa are now coming through, though the value for the pressure now says UNSUPPORTED instead of a value....?
No rush to fix any of this btw.. it can wait.
1 Like
@sburke781, I was trying to be way to clever in my coding and missed something. It is fixed. Also found another issue when mixing PWS and Openweather. So, all's good. New upload 3.05.
2 Likes
@thomas.c.howard Great work on this App man however I feel this highlights the regional differences in weather reporting.
As this is using OpenWeatherMap data from the UK, they're obviously used to different weather profiles from me in Aus !
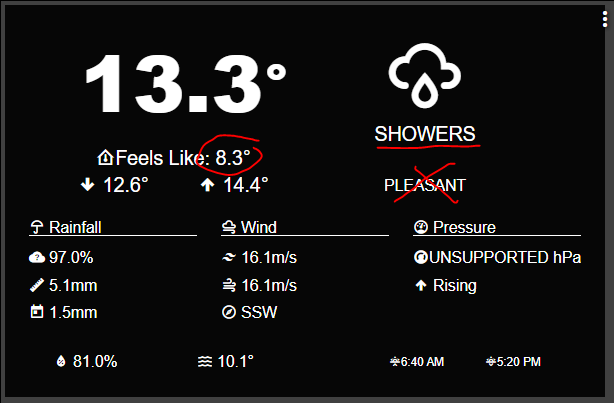
For me 8.3 degree C and showers is definitely NOT pleasant. LOL
1 Like
Awesome work @thomas.c.howard, I think that last set of changes ticked most of what I was after, it came through in package manager, the pressure reading appears, and I can now select the attributes from my pws in the setup screen. Thanks so much for fixing all those so quickly.
There are a couple of readings I would like to still get from my pws, but will go through those in more detail later and post back here with some more requests.
The text seems a little small on some of my smartly adjusted dashboards, not sure if it is to do with smartly or some other settings... Anyway, I can play with that myself and let you know what I find.
Thanks again,
Simon
Just installed the weather tile... noticed that it thinks it’s something else.
Actually the “Pleasant” reading is based on your dew point reading. I can’t decide if I should add some “smarts” or allow the user to turn it off. Maybe both?
2 Likes
Edit - Nevermind, looks like even though I have an API key it's not activated yet.
Nice suggestions and I suppose we could get wind in m/s also ? 
1 Like
m/s for wind is already supported by selecting it on the tile setup. Just change the units you want to display.
I would be interested to see your suggestions. I have tried to make things seamless:
- Auto detect the units from the PWS (I might have missed some since there is not standadardization)
- Override the input units if not detected
- Support to auto convert between input units and output units
What are the readings you want from your PWS ? I built this based on the WeatherFlow device (because I own one )
1 Like
I really appreciate the app. It is working well and I am going to now be able to move all my temp and energy graphs to HE.
This last update may have an issue. I saw in the package manager there was an update this morning. So I updated. I was then going to add a gauge to a power meter tile in a dashboard but noticed that there was no longer a gauge but a gadget listed. When I click the gadget I get a page not found error.
I have two hubs and I have a couple of gauges setup on the other hub. I had updated hubigraphs on it as well. When I look under the apps section my two graphs are not listed so that they can be edited. They do work, however.
I haven’t had to chance to check yet as I had some other task to get done this morning but is there an update to the js file on the hub? Perhaps that needs to be updated?
Hi @thomas.c.howard,
You certainly did make it easy to setup, I was impressed with the whole setup process and the auto-detection features. It turns out the readings I couldn't find on my pws when setting up the weather tile are actually not captured on my pws HE device. They are captured by my EcoWitt system, so need to follow up on that with the developers of the driver.
Edit: what is the third rain figure? I can see the likelihood in % and the daily figure from my pws, what's the other figure? Just read back through the notes.. it's remaining precipitation from open weather...
The next thing I would like, which I did not mention earlier, is the ability to refer to another device in place of open weather. We have a government based Bureau of Meteorology here in Aus and I have a device capturing the local conditions and daily forecast. Would love it if I could make use of it here.
In terms of requests beyond this exact tile, I would love to see a forecast variation, e.g. 3-5 day forecast, but obviously that is a bigger piece of work for another day...
Again, awesome work,
Simon
1 Like
Thanks @Kulfsson. Yes, that's what the wind reading was coming through as to begin with (m/s), whereas the value being reported was actually km/h for me.
Could it be possible to calculate (instead of displaying from device or provider) the dew point from the declared temperature & umidity sources? I'm currently using an external local device but I'm must use the provider dp that is not correct.
Thank for the tile!
You sir, are a super star.
Fantastic job.
Love it.............
4 Likes
Minor-ish update to Weather Tile (version 3.10)
- Enabled Main Icon to have colors (wife's request).
- Made Feels Like Temperature a bit bigger and heavier.
- Fix the dewpoint "text" to trigger when it is greater than 65 F. I have no idea what C is.
- Refactored the code so I can now easily support other data feeds and units.
Upcoming Features
- 3-Day forecast option
- Daily rain/snow prediction graph
- Full weather detail via pop-up when tapped
- Allow multiple sensor feeds to override "main" feed
2 Likes
Please pass on my gratitude to your wife for her excellent suggestions.
Thanks for the awesome app! Is there any way to copy a graph so you don't have to start over from scratch? Specifically, I have six temperatures (sensors) on a 7 day graph and would like to create a second graph (dashboard tile) showing a single day for all of the same sensors just for more detail - but I didn't want to go through all the settings, changing colors, etc. again if there was a quicker way. Didn't see anything searching through this post/the forum... Thanks!
1 Like

