Hub load severe, over active Third Reality plugs?

Ethernet hardlined C-8 Pro, platform version 2.4.4.156

I’m getting alerts that my Hub load is severe, and when I review the apps and drivers, there are two major strand outs. I’ve posted about these before, but wasn’t able to resolve the problem, but now it seems to be much more of an issue.

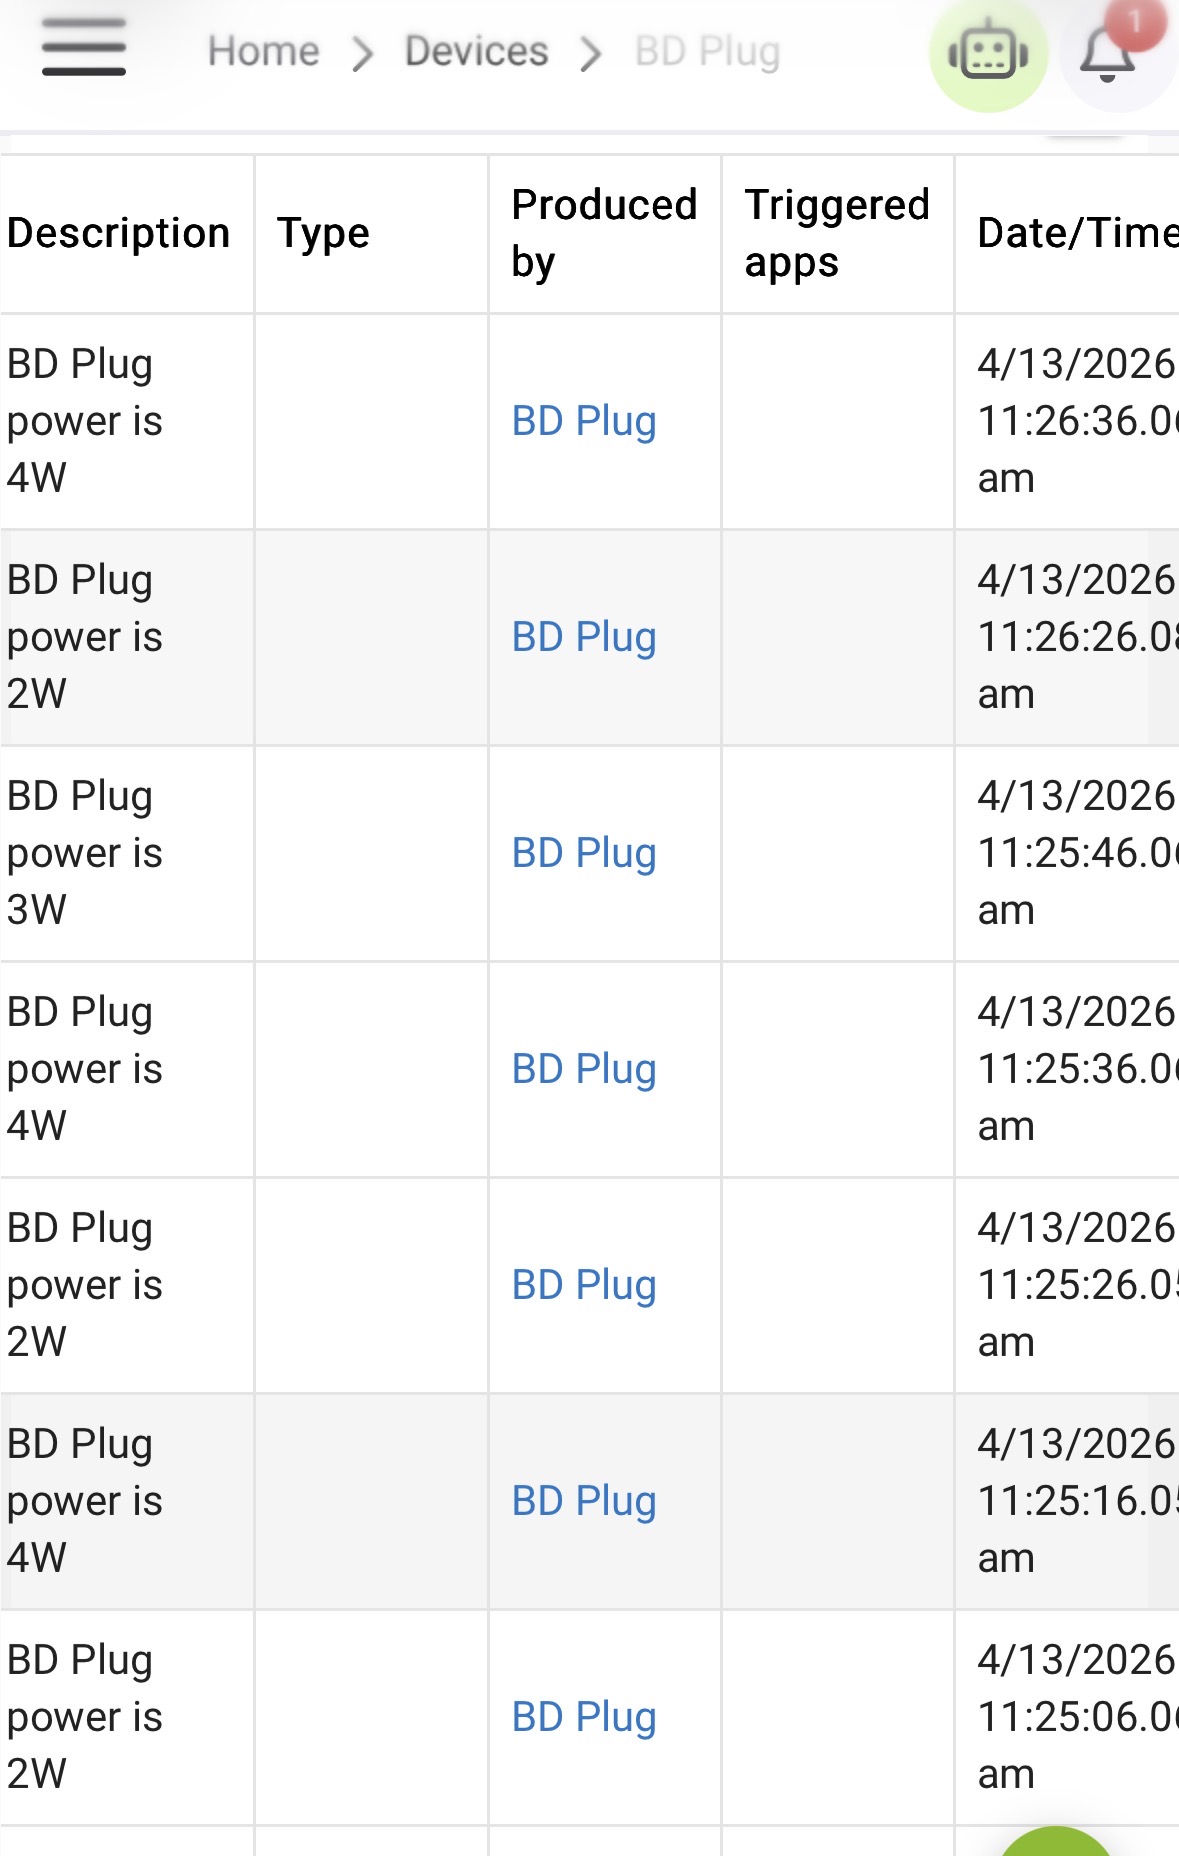
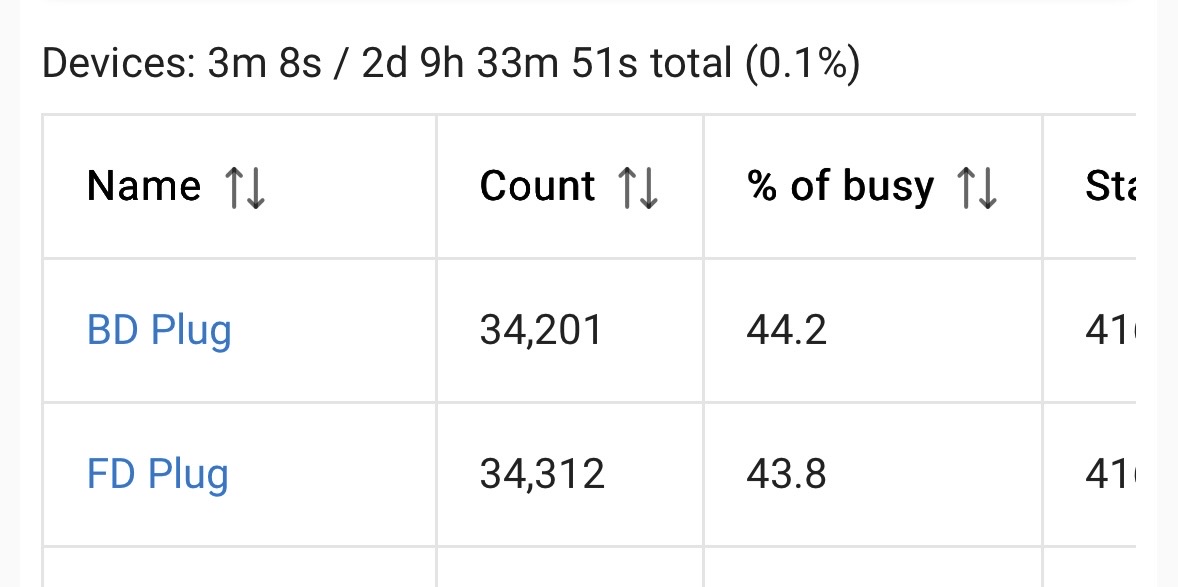
As you can see, these two plugs account for 44.2% & 43.8% of the Hub busy time. 99.99% of their activity is unwanted wattage reporting.

This is a snippet of the miles long list of wattage reporting these plugs report around the clock. I do not know how to make it stop.

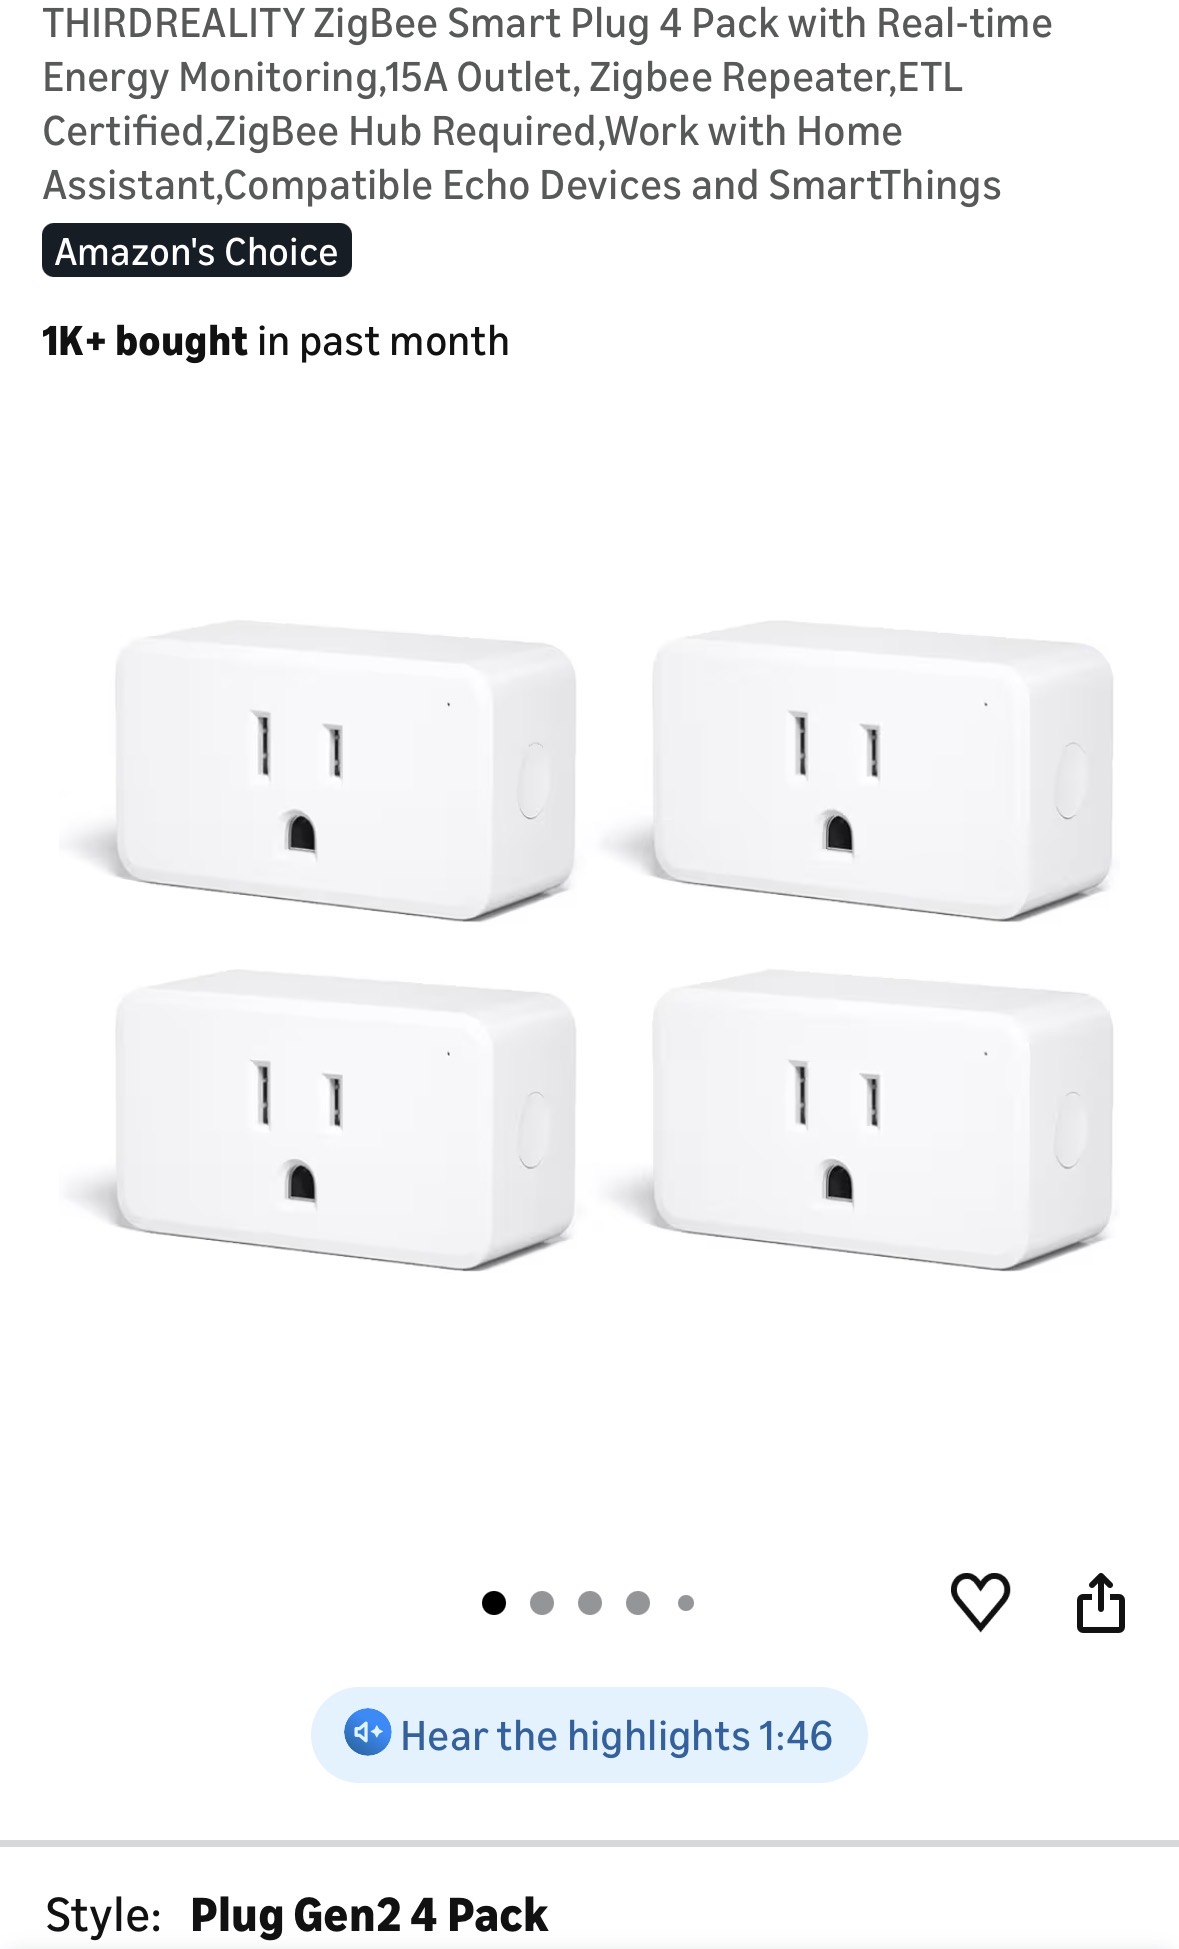
Here is what I bought.

The plugs are currently using the “Generic Zigbee Outlet” driver/type. They are both currently disabled to aleviate load stress. Any thoughts on how to use these without the superfluous wattage reporting?

Those don't appear to actually be problem. Yes they are 44%, but they are 44% of your busy time which is .1% so not much overall.

Did your cpu load message go away once you disalbled them?

1 Like

Power-reporting devices running amok can be a bear on the system.

I'd make sure those devices have the latest available firmware, and then use whatever device-level options you have to limit the power-reporting options to only what you need.

I don't have those plugs myself, but IIRC, there's a community-developed driver for them... If that's true, it may offer some more granular setting of options.

2 Likes

Did you disable the device or just the power reporting on the Preferences tab of the device settings?

Oh yeah the gen2’s… yeah i had that problem with them too. Bad enough it would cause my zigbee radio to reboot. SO the power metering settings on these bad boys doesn’t seam to use standard zigbee clusters. if you try to change the power metering options with the Generic Zigbee Outlet drive as i did… several times… it wont stick. If you enable debug logging when you try this, you’ll see the error in the logs.

I found this driver in an old community post and disabled power metering, so far the issue has gone away.

https://raw.githubusercontent.com/bradsjm/hubitat-public/main/ThirdReality/ThirdRealityPowerMonitorPlug.groovy

1 Like

Well, the severe load warning seems significant and the next largest device/app count is 2,000, so I’d say they are not just a problem, but the problem. Otherwise, what causes the severe load warning? That’s a genuine question, in case I’m misunderstanding this.

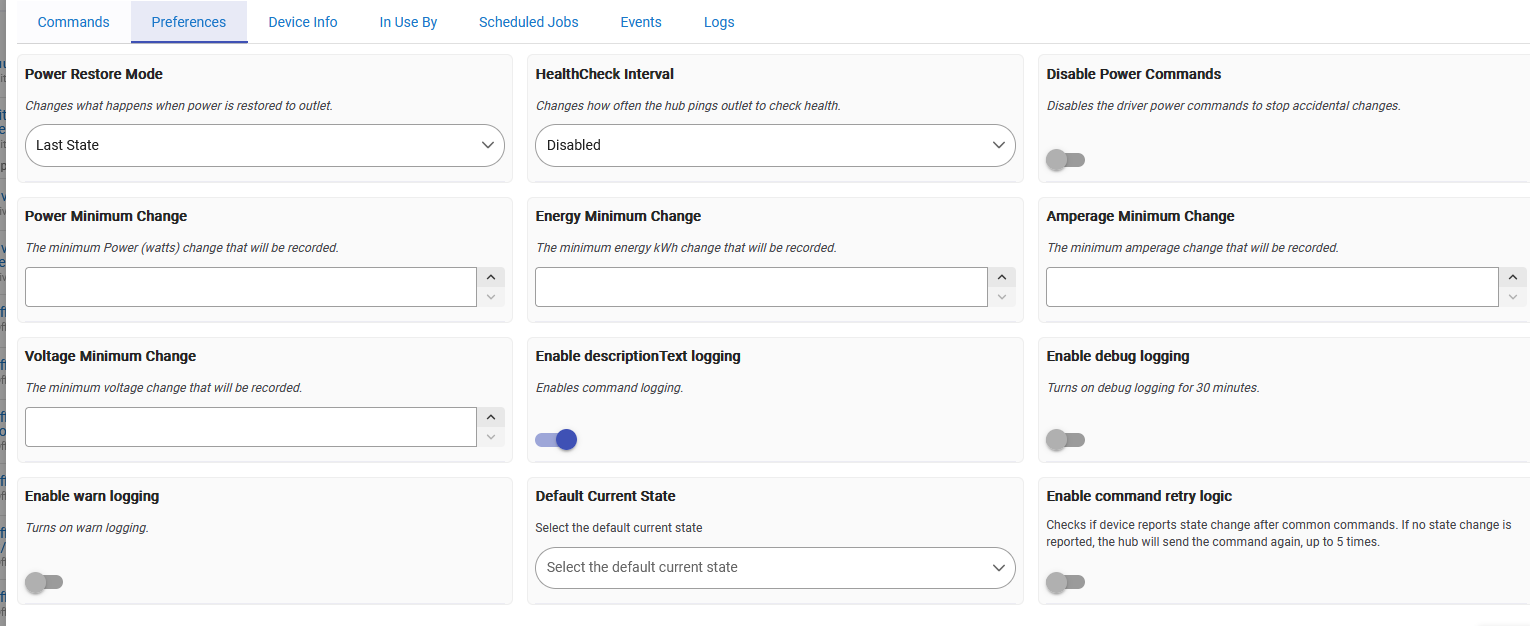
There is no device level reporting control, and the firmware is up to date. @sidjohn1 has provided a driver code that may solve this.

The devices, temporarily. There is no option to disable the reporting, which is why I’m here. Otherwise I’d simply turn that off, haha.

This is just what I was hoping for! Thank you so much. I’ve installed this and switched them over. Gonna track these and see if the issue goes away now. Thanks again!

1 Like

Just to confirm, the Third Reality Plug Firmware is up to date.
Third Reality did a few firmware updates to get the reporting under control with these plugs.
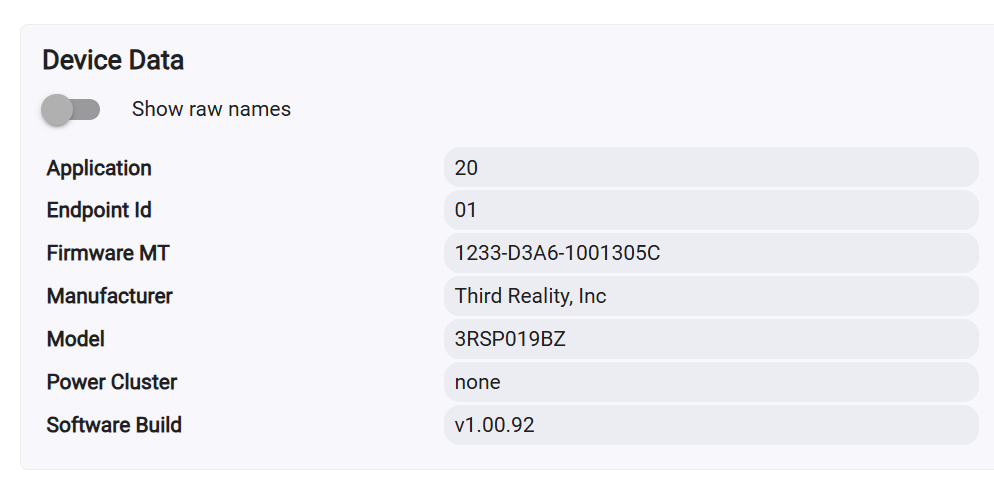
Not sure where they landed but my 3RSP019BZ's are at Software Build v1.00.92.

2 Likes

Correct. The firmware of the third reality smart plugs I’m posting about is up-to-date. I’ve updated them many times over the few months that I’ve owned these plugs.

It is significant. It means that your system has something creating high load.

This is irrelevant without context. That number probably is higher due to the power method of the driver being called every 10 seconds, but that is not indicative of a problem. just that your driver is doing something.

Very well could be but again the information you showed that your hub is fairly idle in general. Your cpu for all devices is .1% and those two devices are 44.2% and 43.8% of .1 % of cpu time. or .044% and .043% cpu of of actual total cpu time. Devices that do power monitoring will use some additional cpu and have higher counts becuase they are doing more activity then devices that don't, but if everything is working well that wouldn't be a problem.

That said if the device has poor quality firmware and are blowing up the Zigbee radio before the calls even get to the device driver that could cause high load. If what @sidjohn1 is talking about is the cause then it could present like this.

On a comoputer "Load" is a term that actually relates to allot of things. Load can be cpu usage, but it can also be the cpu and system waiting on other stuff, like the zigbee radio talking to the hub software, storage being slow, or a TCP connection for network stuff. It can also indicate a program/app/rule has gotten into a condition and is stuck in a loop if there is a programing problem.

So back to the question i asked earlier.

If you disabled them and the load did not improve then it is unlikely the devices are related.

Have you rebooted your hub since this appeared? Does it come back quickly, or does it take a while for it to occur again? Did you make any changes recently?

If you have had them for months is this the first time this has occured?

Reading the thread I see someone else beat me to it. I have a large qty of the 2nd and 3rd gen units. The 3rd gen don't seem to have the problem afaict but the gen 2 got 'clean' after I switched to this more specific driver.

It's got a health status which is great and you can really get tweaky on the power config logging settings:

If you really want options, use @kkossev's driver.

3 Likes

No, nor did it go away after changing the device types to the recommended drivers that have greatly reduced the energy reporting. You were absolutely right, this isn’t the problem.

Yes, multiple times. It reappears within a day or two. I fiddle with rules and setups fairly often but no major additions or changes. Just gradually increasing the number of rules, which may be the issue. Could it be that I have built too many rules, that are each poorly crafted or inefficient/redundant? I’m no pro, and learned how to do a lot of this on my own with this system.

I’ve seen this message once several weeks ago but the hub load was “heavy”. I didn’t see it for a while until last week or so when I saw it multiple times and it was “severe”, as it is still.

Darn. Honestly, i wish i wasn't because load issues can be hard to track down.

Probably not to many, but they may be setup in a way that isn't load friendly and so they carry allot of weight. I always suggest for users when setting up rules to try to keep them event based to prevent them from running frequently. If you have a bunch that repeat loops or run over and over in short intervals that can add up and cause load issues. It wouldn't hurt to look at your rules and see if you can adjust the triggers so they only happen when specific events occur.

Likely that was the sign you were starting to get close to the straw that pushes it over the edge.

To troubleshoot this the first thing I would do is just do a reboot and use the advanced restart option to "Rebuild the database on reboot". It is amazing some of the strange things that will fix. It is always good to do that when strange things start to happen.

Also check your app stats. Remember to look at the cpu relative to the total cpu time used by apps.

Do you use any LAN connected devices, or is it all zigbee/zwave. LAN Devices or services can be heavy on the hub.

Oh, what version of the hub is this. Is it a C8 Pro or a older model and what older model

All of my triggers are event based, like when a contact sensor opens, or my presence sensing switches, or I push a button or flip a switch. I don’t think I have any rules that rely on variables that could occur at any time, and none of them loop or repeat except for maybe one which is basically my “you’re being robbed” alarm, which is rarely ever triggered, and therefore never runs or loops.

Amazing I’ve always wondered what that was, but I was a little too scared to use it. I will do this immediately. However, I do reset the hub about once a week because I noticed a while back that every now and then my door chime, for when the door opens, was firing 5 to 10 seconds after the event and it should’ve been immediate. I think I was already starting to see these lags, but the hub wasn’t warning me of a severe load issue yet.

Are there any rules of thumb for red flags here? A percentage or threshold or some kind of correlation that you would raise an eyebrow at immediately?

No LAN devices, almost all Zigbee with a few Z-Wave.

C-8 Pro w/ wired Ethernet connection. Running version 2.4.4.156.

And just for reference in case anything about these numbers jumps out at you, I have 63 “devices” of which only 18 are actual physical devices in my home. The rest are virtual devices, like switches or buttons that are part of a rule to trigger something else. I have 10 apps on the hub one of which is the rule machine which contains about 52 rules.

That is fantastic.

Yea.. It is basically a easy way to rebuild the DB like a soft reset.

That is likely a sign of something. I generally don't reboot or reset my hubs unless something is strange is happening. Weekly soft resets is certainly a sign of a problem.

It really depends on your environment. I would just make sure you look at the top number so you know how much CPU Total time all of your apps are using. Then you can use that to determine how much time a app is actually using.

Keep in mind that load can be hard to pin down. Espcially if what is creating a load in a way that isn't very well observed.

Well that is good and bad. If everything is Zigbee/zwave they tend to be super easy on the CPU, but that just makes it harder to pin down.

Well the C8 Pro has the extra punch to muscle through stuff with it's more ram and faster SOC. That says something if you are still getting the load messages.

Nothing stands out about that. I have 55 Zwave Devices 17 Zigbee devices and whole bunch of wifi connected devices. The hub can handle allot more then what you have connected to it. I don't have 52 RM rules, but i have several other apps. I am probably not far behind in rules when you add the other apps.

Can you list your Zwave and Zigbee devices. Maybe you have a proematic device blowing up the radio.

Also when was the list time you removed power from the hub and let it sit for 30 seconds. This is just to give your radios a fullly power cycle.

Can you load the Hubinfo driver and collect performance metrics.

Also how busy are your debug logs?

No problem:

Z-Wave:

Aeotec Range Extender 7 (1)

Aeotec Siren 6 (1)

Yale Assure Lock 2 Touch w/ Z-Wave (2)

Zigbee:

Aeotec Range Extender Zi (1)

Aqara Zigbee Door and Window Sensor (14)

ThirdReality Zigbee smart plug (3)

SONOFF Orb 4-in-1 Zigbee Smart Scene Button (SZNB-01M) (1)

Aqara Water Leak Sensor (2)

30 seconds ago after reading this. Before that? Probably when I set it up six months ago or so.

I had this app installed for a while, but never used it, so I uninstalled it. I have reinstalled it from the HPM but I can’t find it anywhere and I don’t know how to use it. Could you provide some guidance on this please?

Um, what is the metric for this measurement? haha. I assume "Kinda Busy" isn't the answer you want.

However, I did drop a days worth of my logs into my AI and asked it to try to identify severe load issues. Here’s what it told me:

The following are likely causing the severe load issues on your Hubitat C8 Pro:

• App 211: This is an extremely heavy rule. It executes dozens of logic checks, notifications, and device commands within a single second during arming/disarming sequences.

(True, it is one of my largest rules, but I don’t think this one rule that triggers only when arming my alarm system, is the source of this. Still, though I’m gonna try to streamline this one and clean it up a bit)

• Event Storming: Apps 142, 231, 235, 245, 246, 247, and 315 all trigger simultaneously whenever the HSM status changes, creating a massive CPU spike.

(sort of true sort of not. Each of these rules is very small and very simple and specific, and yes, many of them do fire at the same time, but that’s sort of the point.)

• App 183: This is in debug mode. Disable debug logging to reduce unnecessary overhead.

(This is my lock code manager, and it was set to verbose debug. I have disabled debug entirely for this app now)

• App 123: Running a high volume of update checks at midnight.

(This is the HPM, and I can’t find a simple way to disable updates, but I did manually remove all of the repositories from its update list)

Consolidating your HSM-dependent rules would significantly improve performance.
@krstevens87 just a question. Do you have the remote admin service with Hubitat? If so have you noticed these sever hub load warnings a few minutes after you remote admin into your system?

1 Like