Nothing about the devices you listed screams problem to me. I didn't know Aeotec made a Zigbee range extender. The Aqara sensors when they first came out were a mixed bag and could be problematic for reliability, but i don't ever remember hearing of them causing extreme load.
Lets see if that makes a difference. It is a bit of a stretch it will help, but not impossible.
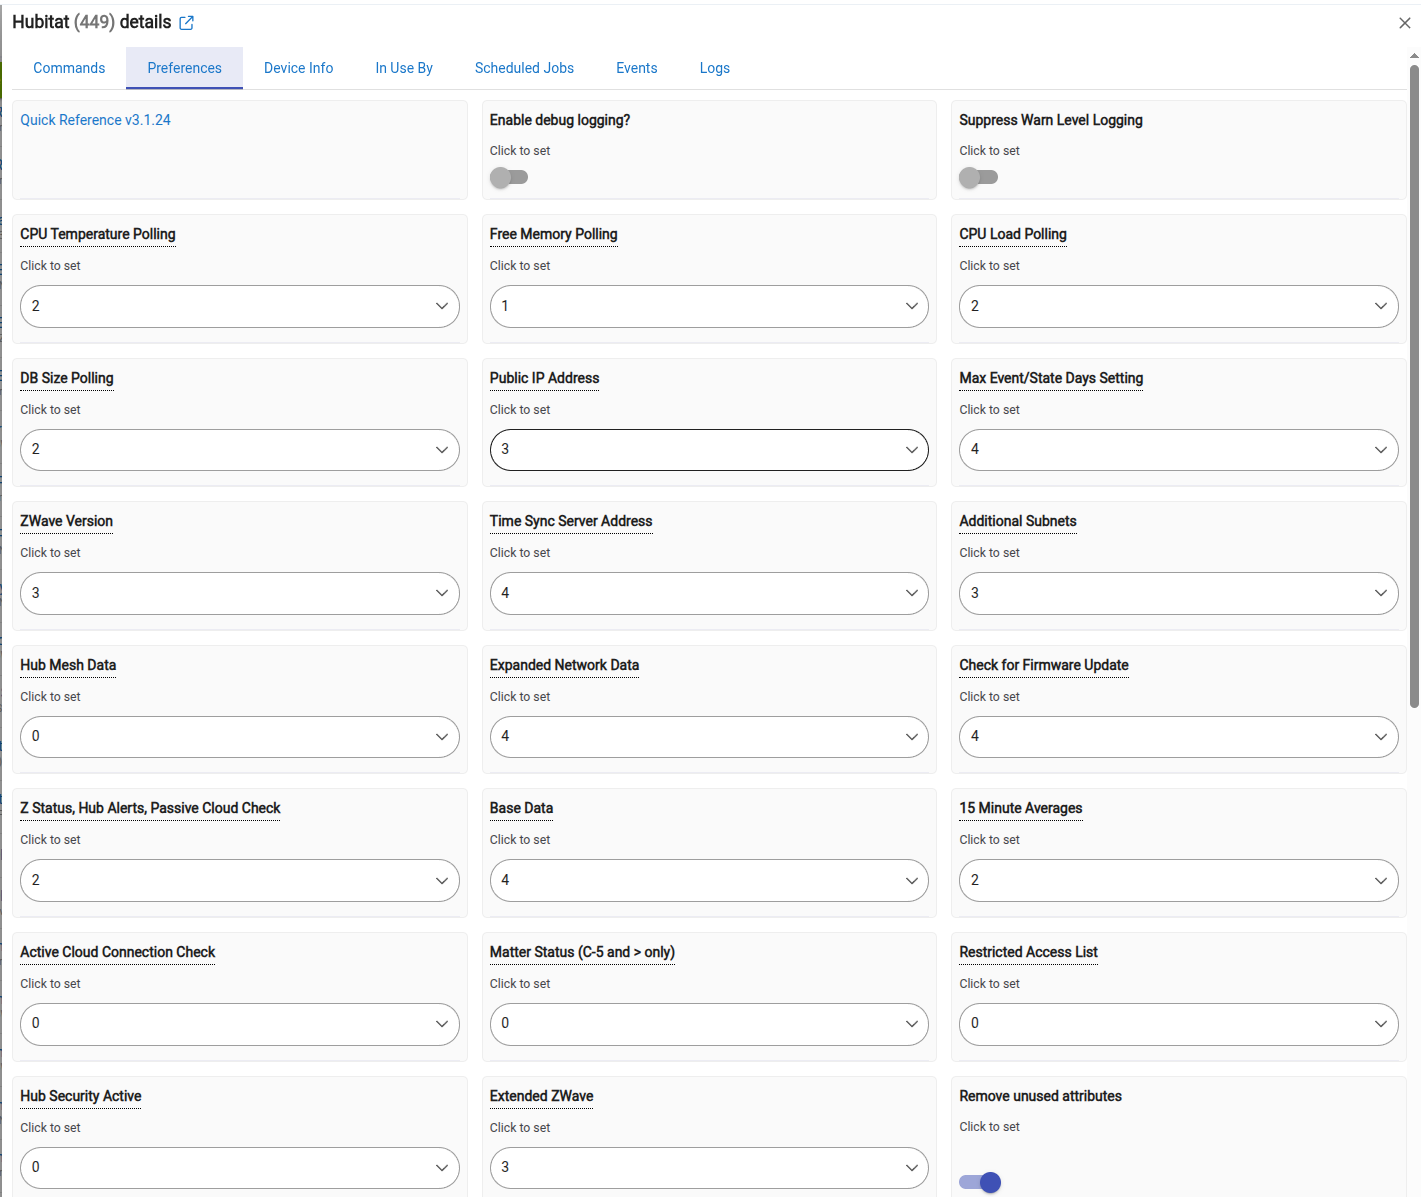
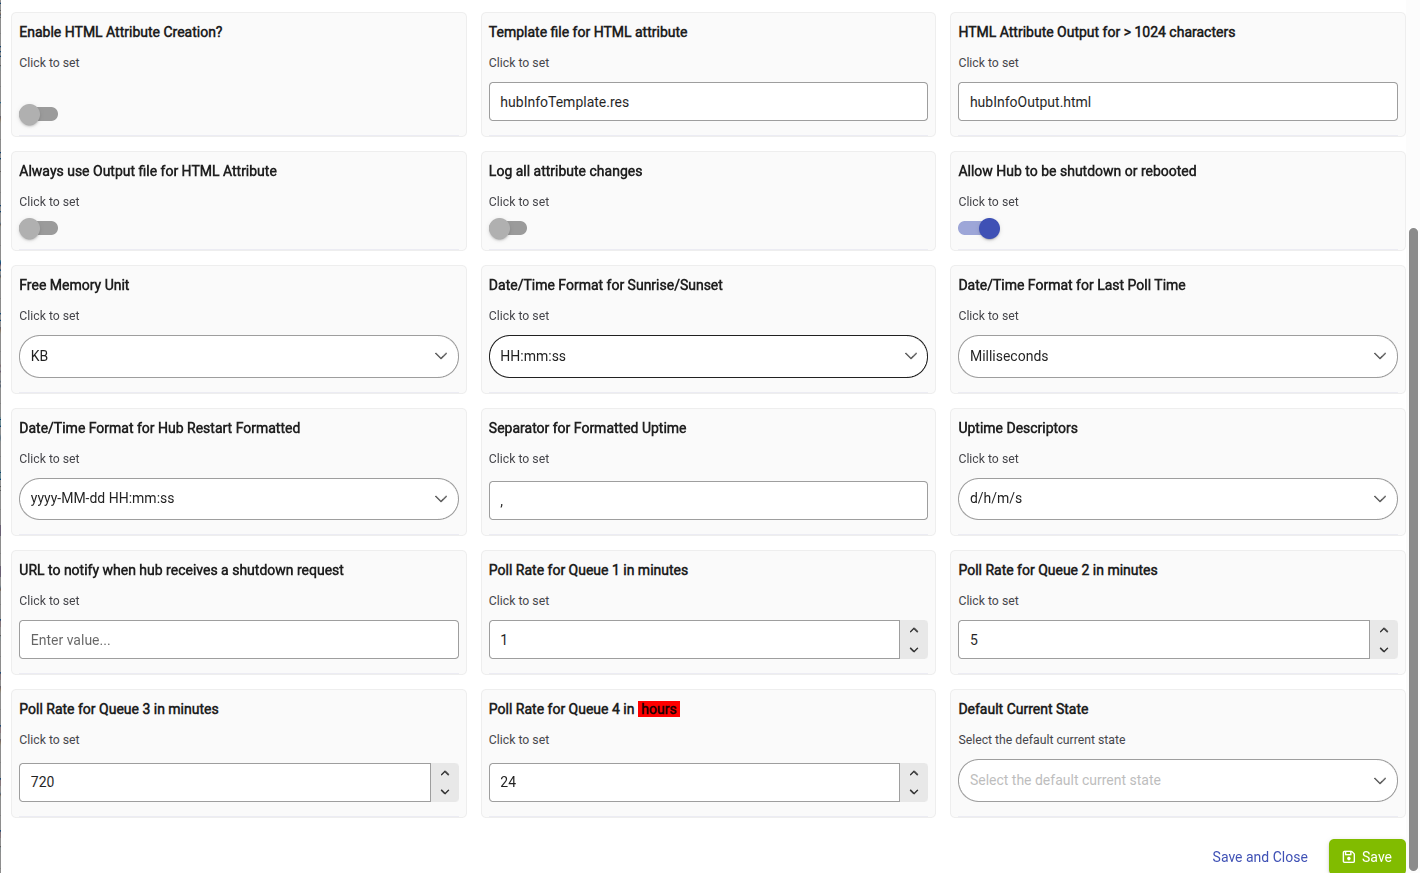
It is a driver not a app. Go into the devices page and click on the option to install a virtual device. Then when selecting the driver for it to be use the Hubinfo Driver. The driver acts as a central point to retrieve certain metrics of the system at a few different poll rates. Once it is installed go into the virtual device and access it's preferences tab. From their you will setup the preferences to determine when groups of metrics are collecting by selecting the Poll group they belong to. Then at the bottom you set the value for how often the Poll groups are collected. In this case the most important metrics are the memory, CPU, and DB Values. the rest don't exactly help us in this discussion. Memory can be collected fairly frequently. It doesn't do any good to collect the others any more frequently then 5 min general. At least for testing and validation i would set poll group 1 to 30 seconds and then poll group 2 to 5 min. Then only have memory in poll group 1. Then the CPU and DB metric groups to poll group 2. Here are my preferences settings as a point of reference. But this is based on my desire to collect them. If you don't need everything you can turn them off. I actually have some turned off myself
To graph it you have a few options. You can use a Dashboard with it's graphing option, webcore with its integration of Hubigraphs, WatchTower, or i use InfluxDB and Grafana, Each of them have their pro's-con's.
I have only tested the first and last option myself. The big problem with using the Dashboards is that it can only graph based on the event retention your hub keeps. So if you only keep 10 values of event history you can only graph 10 points of data ever. InfluxDB and Grafana are great becuase they take most of the weight of the task of graphing off the hub. They are commercial tools with free options for home use. That said because they are commercial options they tend to be a bit more complicated to setup. Once configured though i have found it to be a rock solid option.
The other two options are probably in the middle of complexity and such, but still keep all the data and load on the hub for performing those tasks. If you are not a Webcore use i would probably suggest just using Watchtower. That said all of them are better then not having anything to do that task.
Here is an example of using the dashboard for graphing.
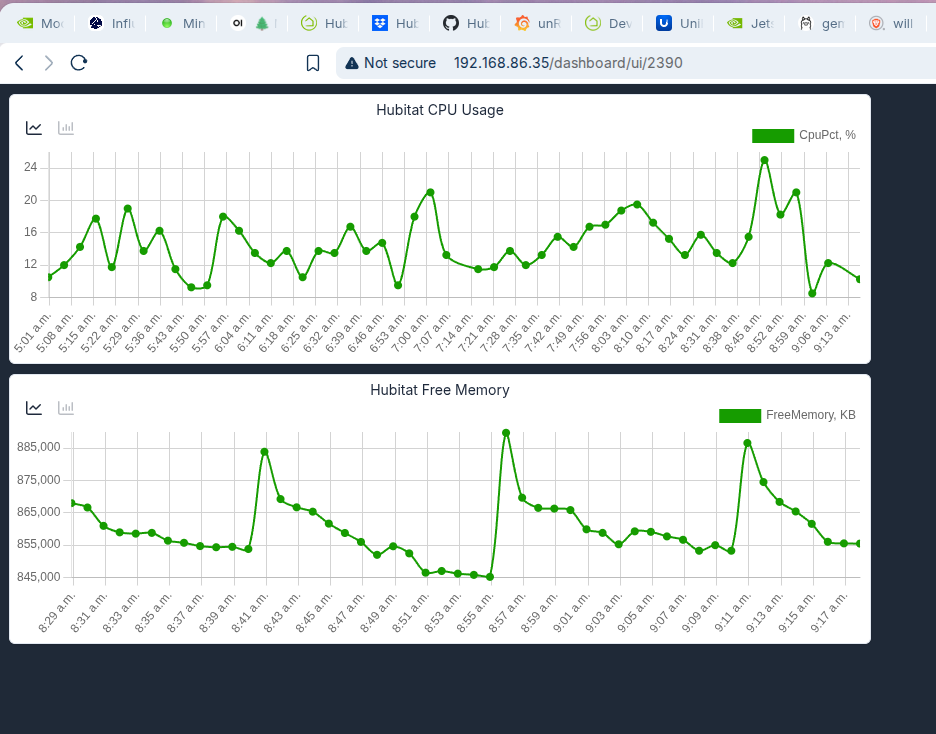
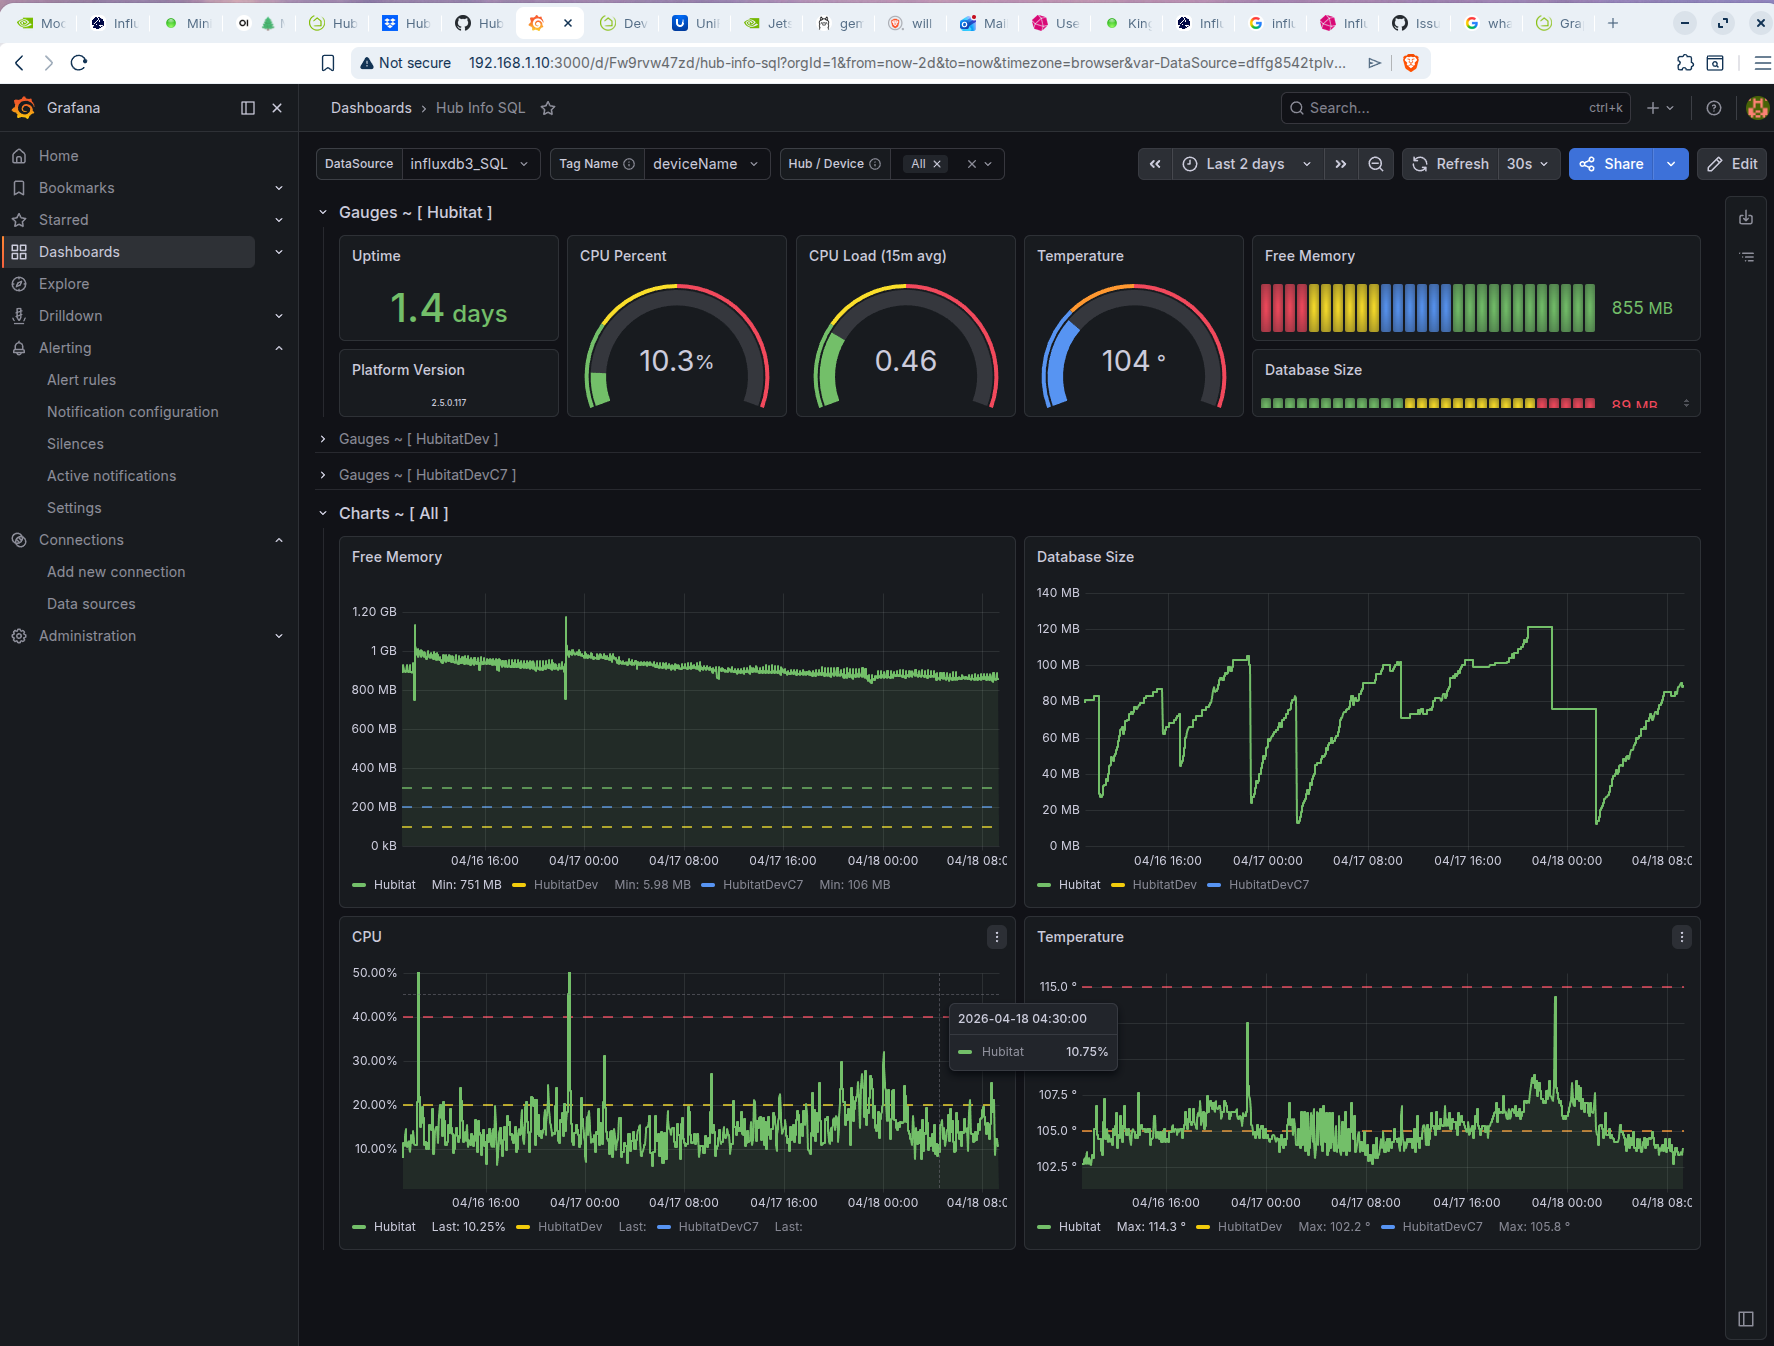
And here is an example of using InfluxDB and Grafana with a dashboard design by @jtp10181
That is a good point. I would think if it is constantly scrolling maybe how many lines per second, That said i was looking to just see if we could find something that is very busy in the logs. and consistantly busy.
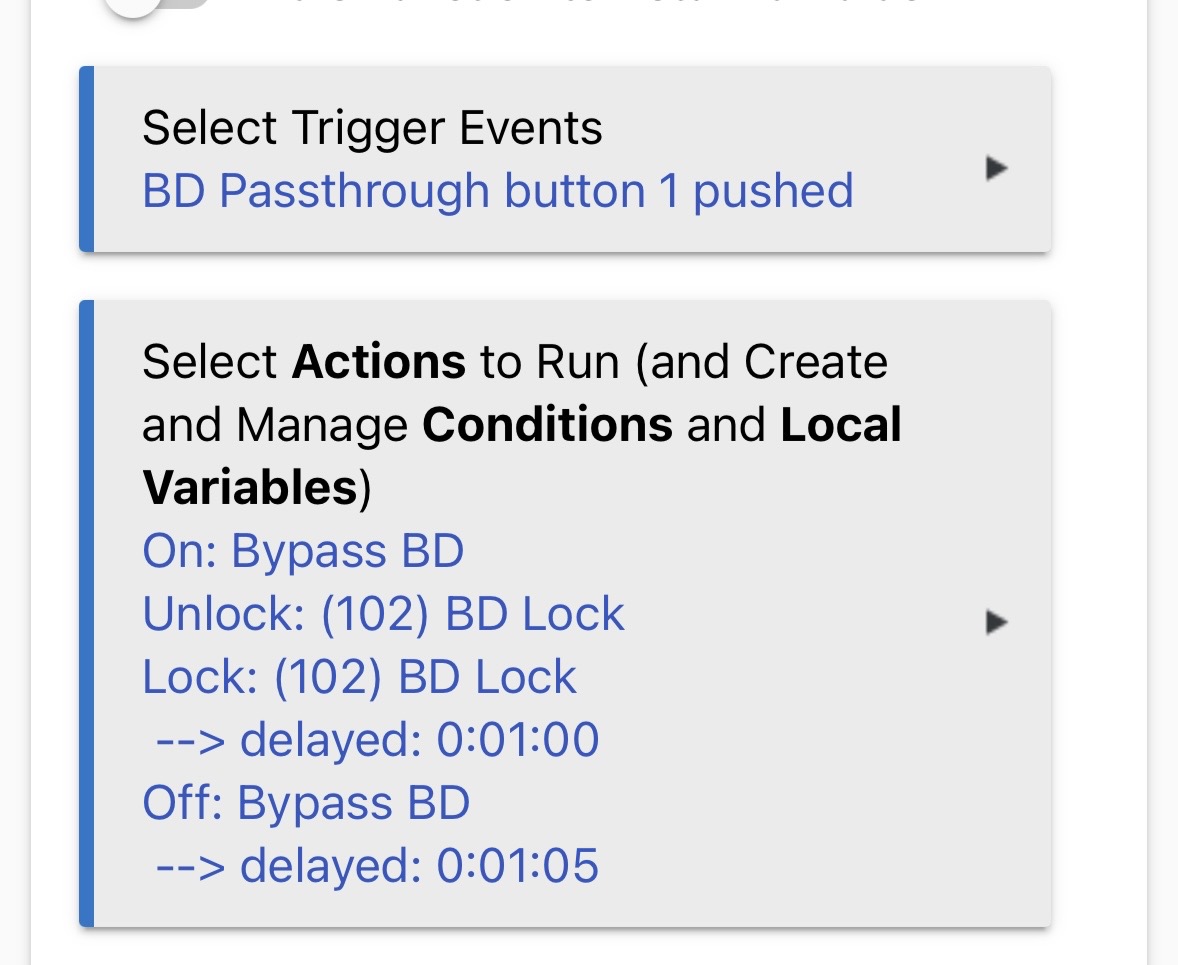
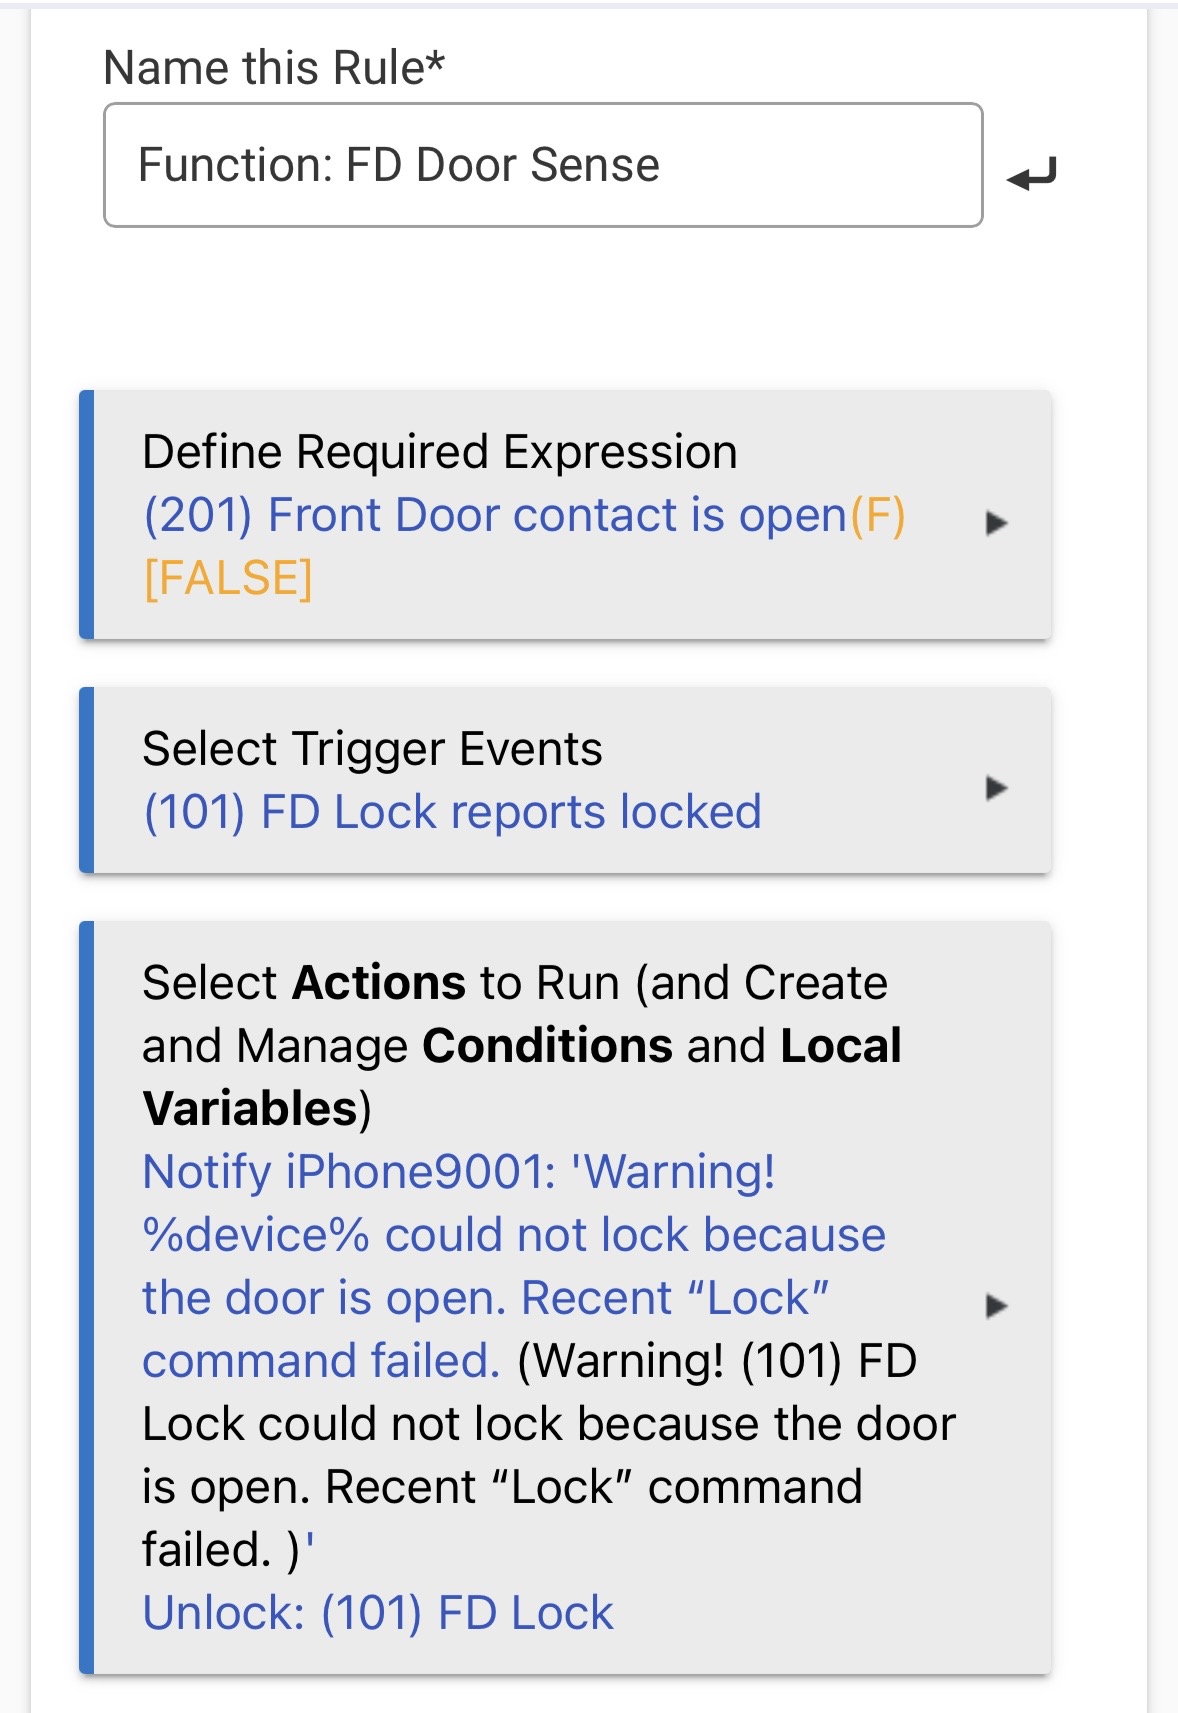
If it is only triggering at that action unless you are arming and disarming frequently it is unlike to cause heavy load.
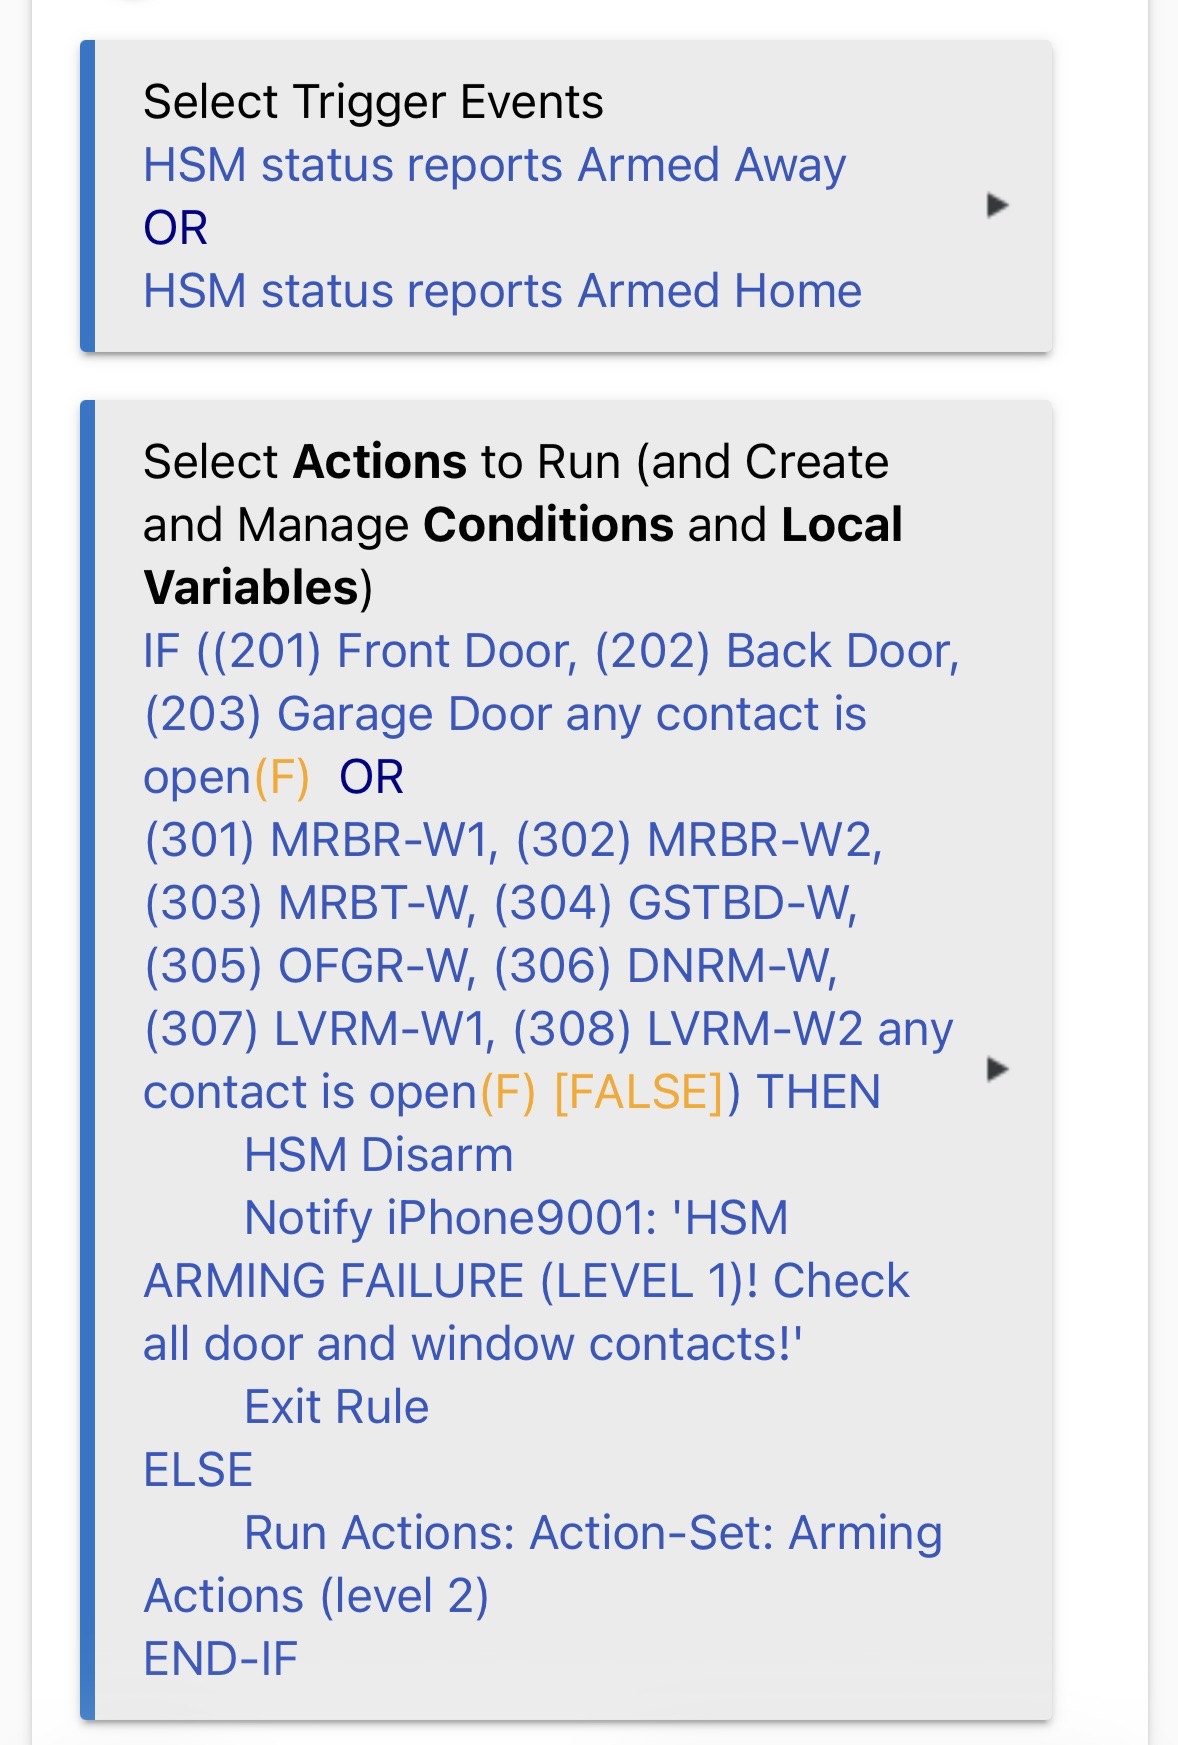
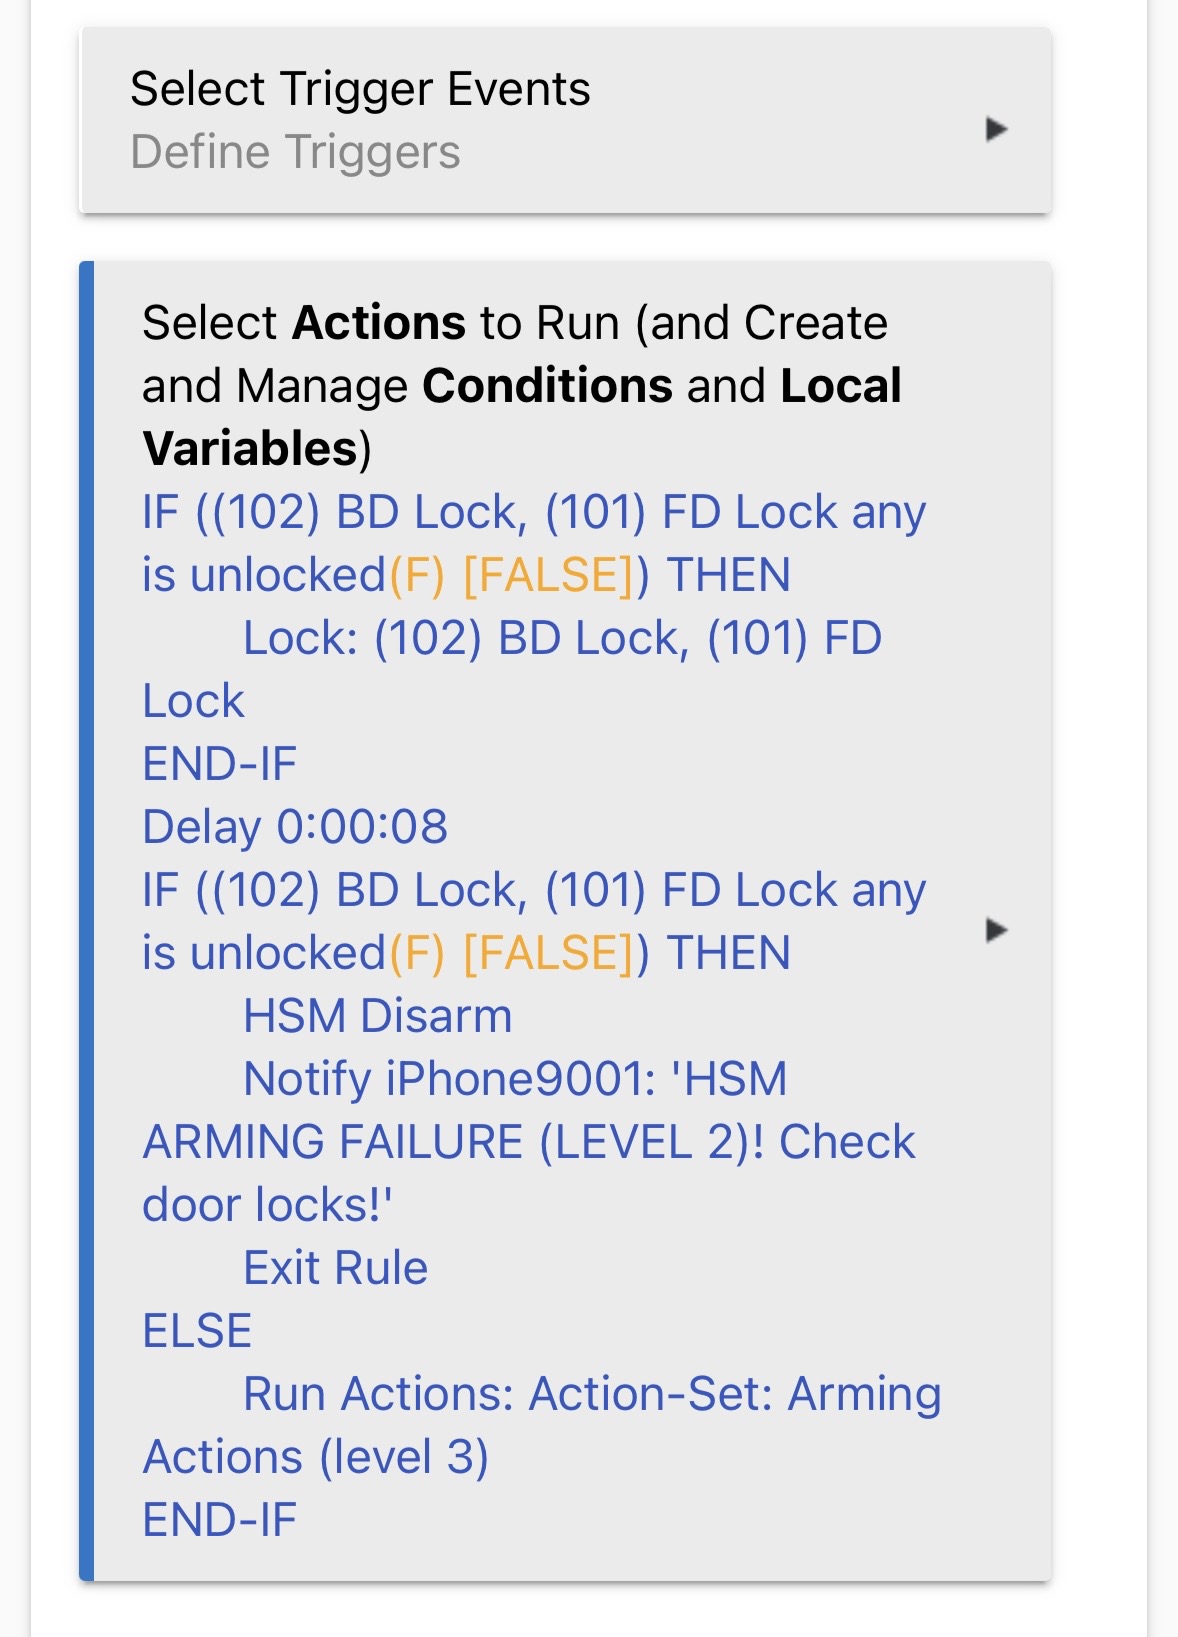
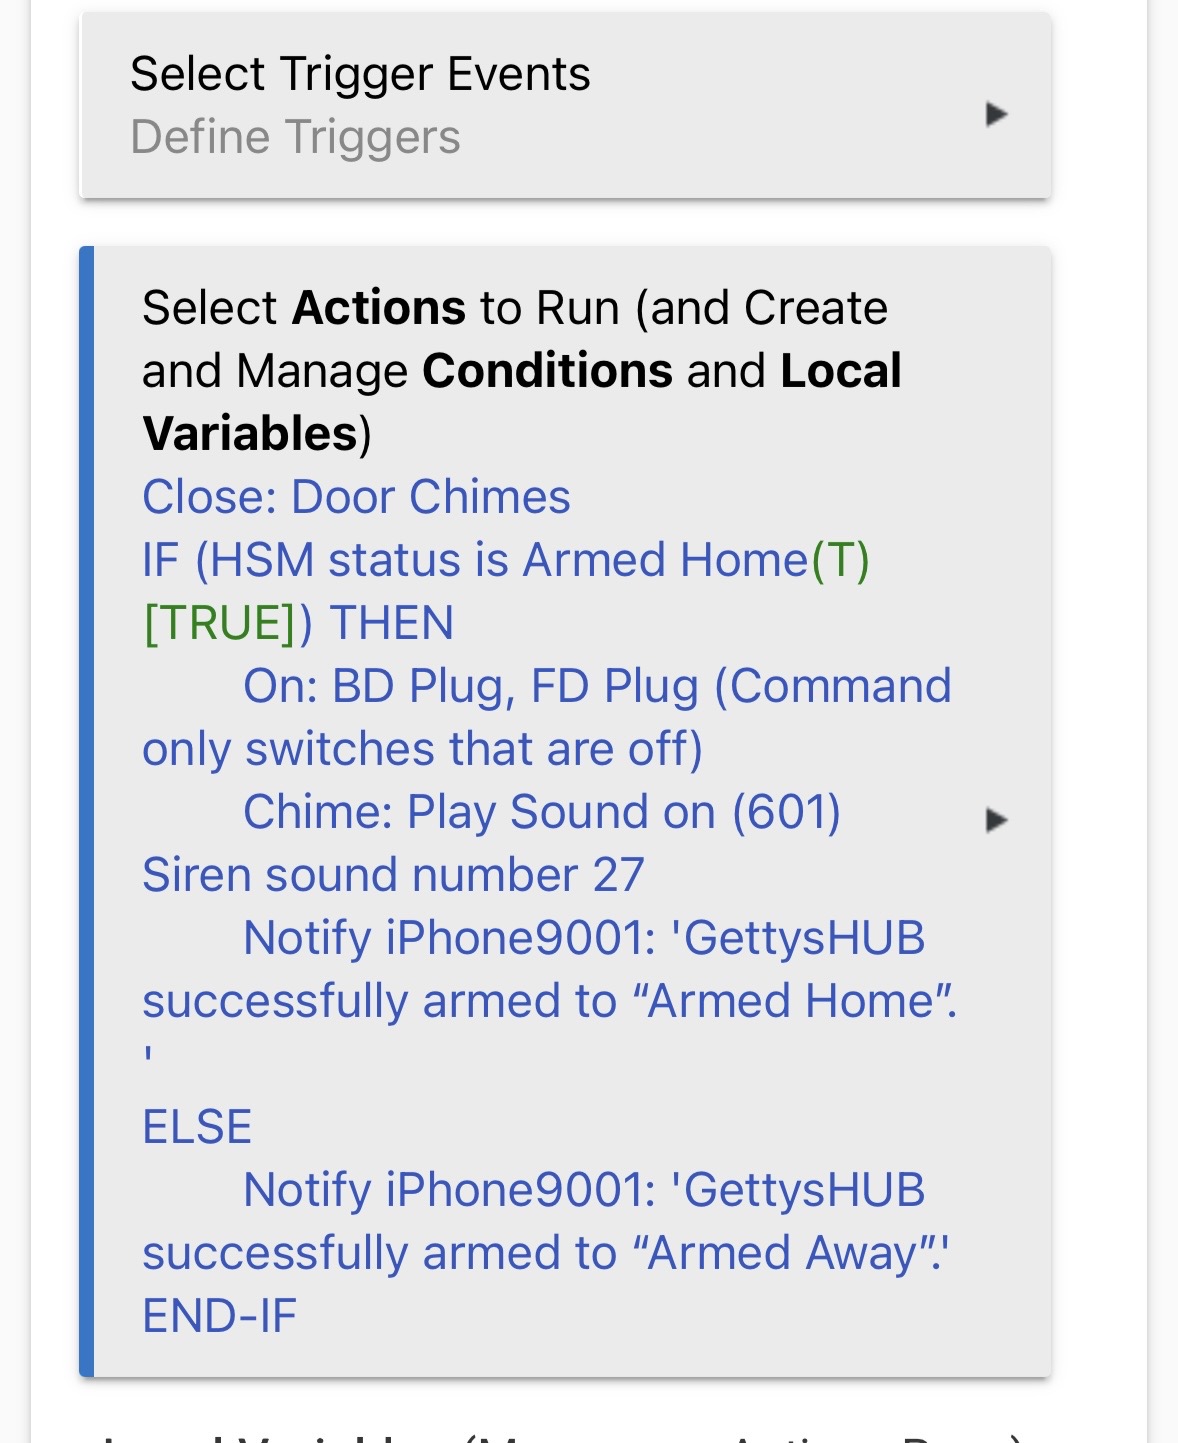
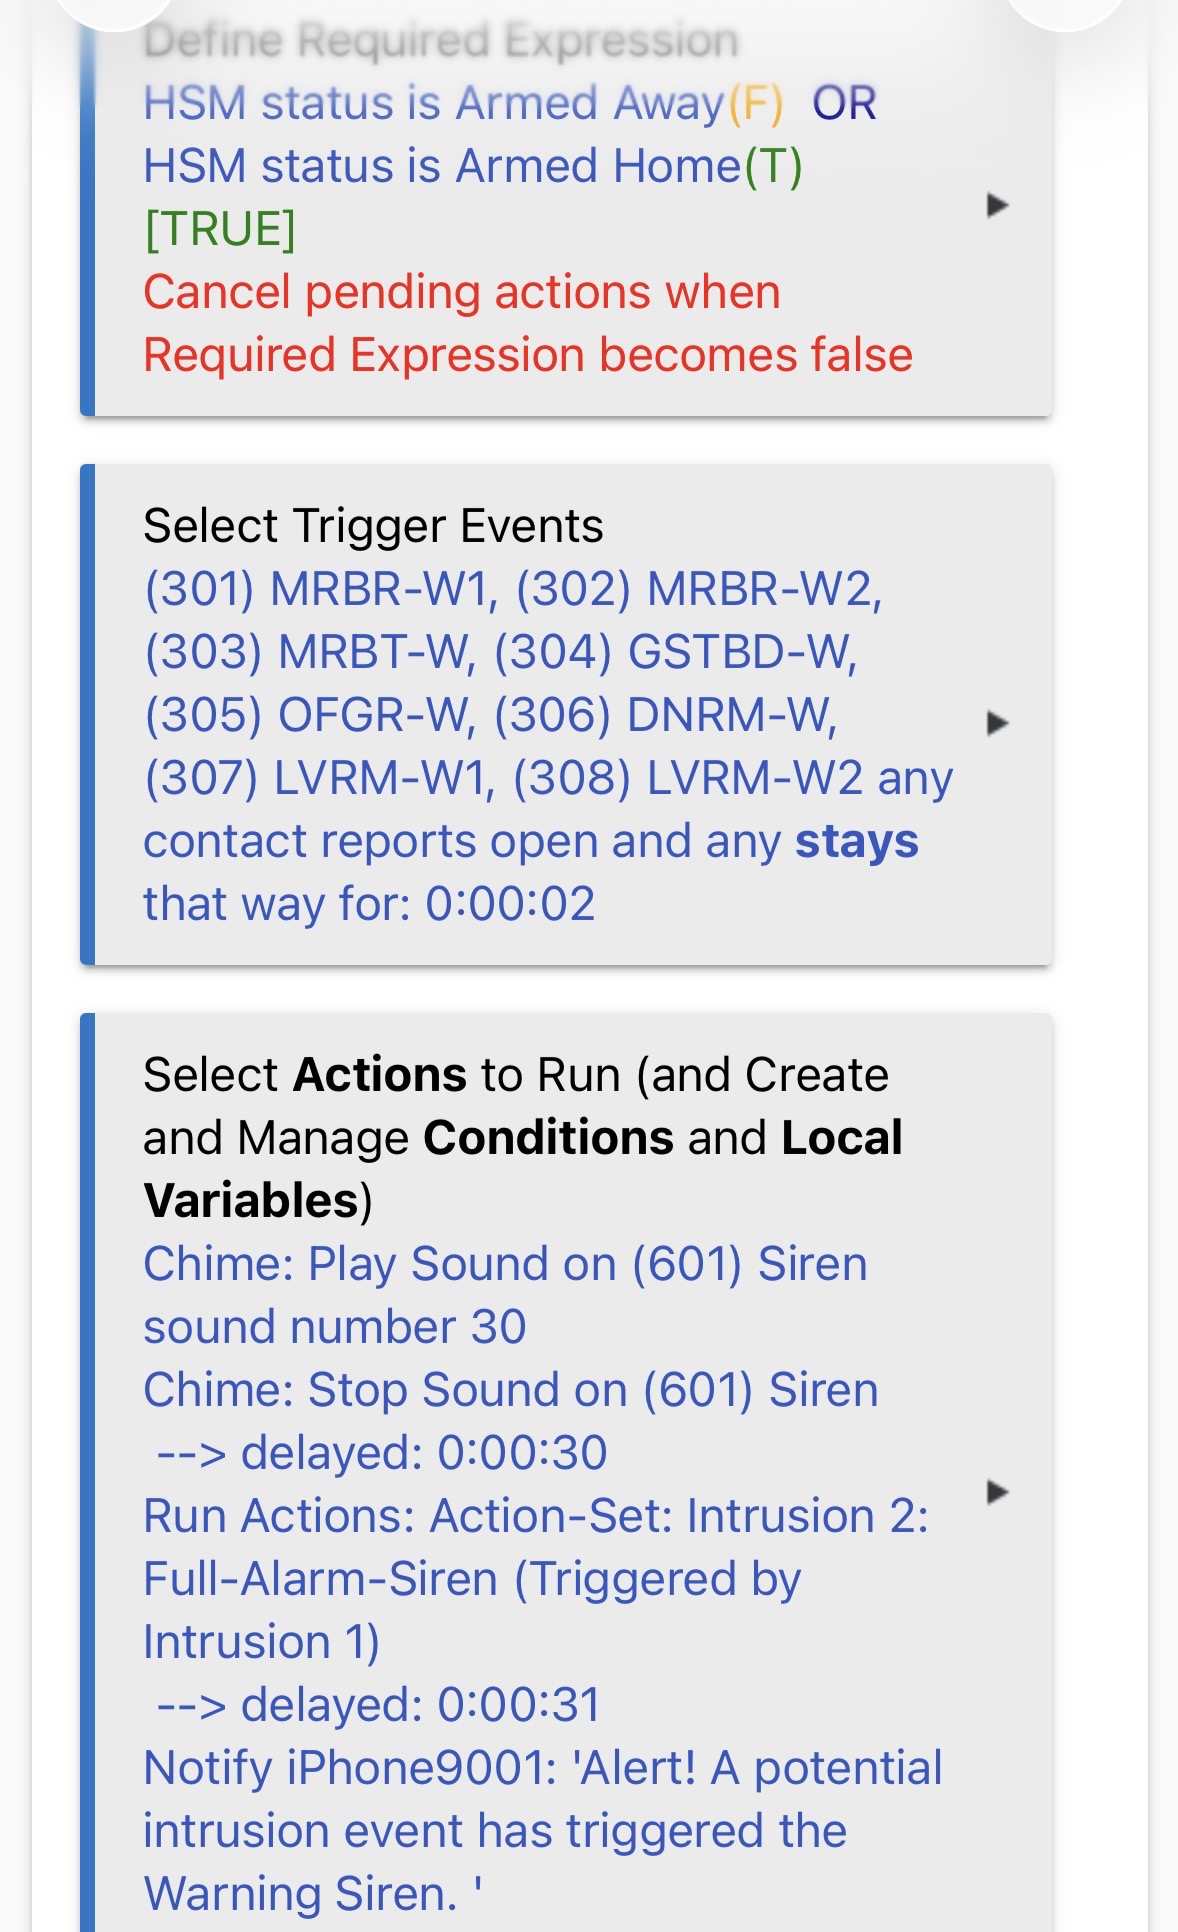
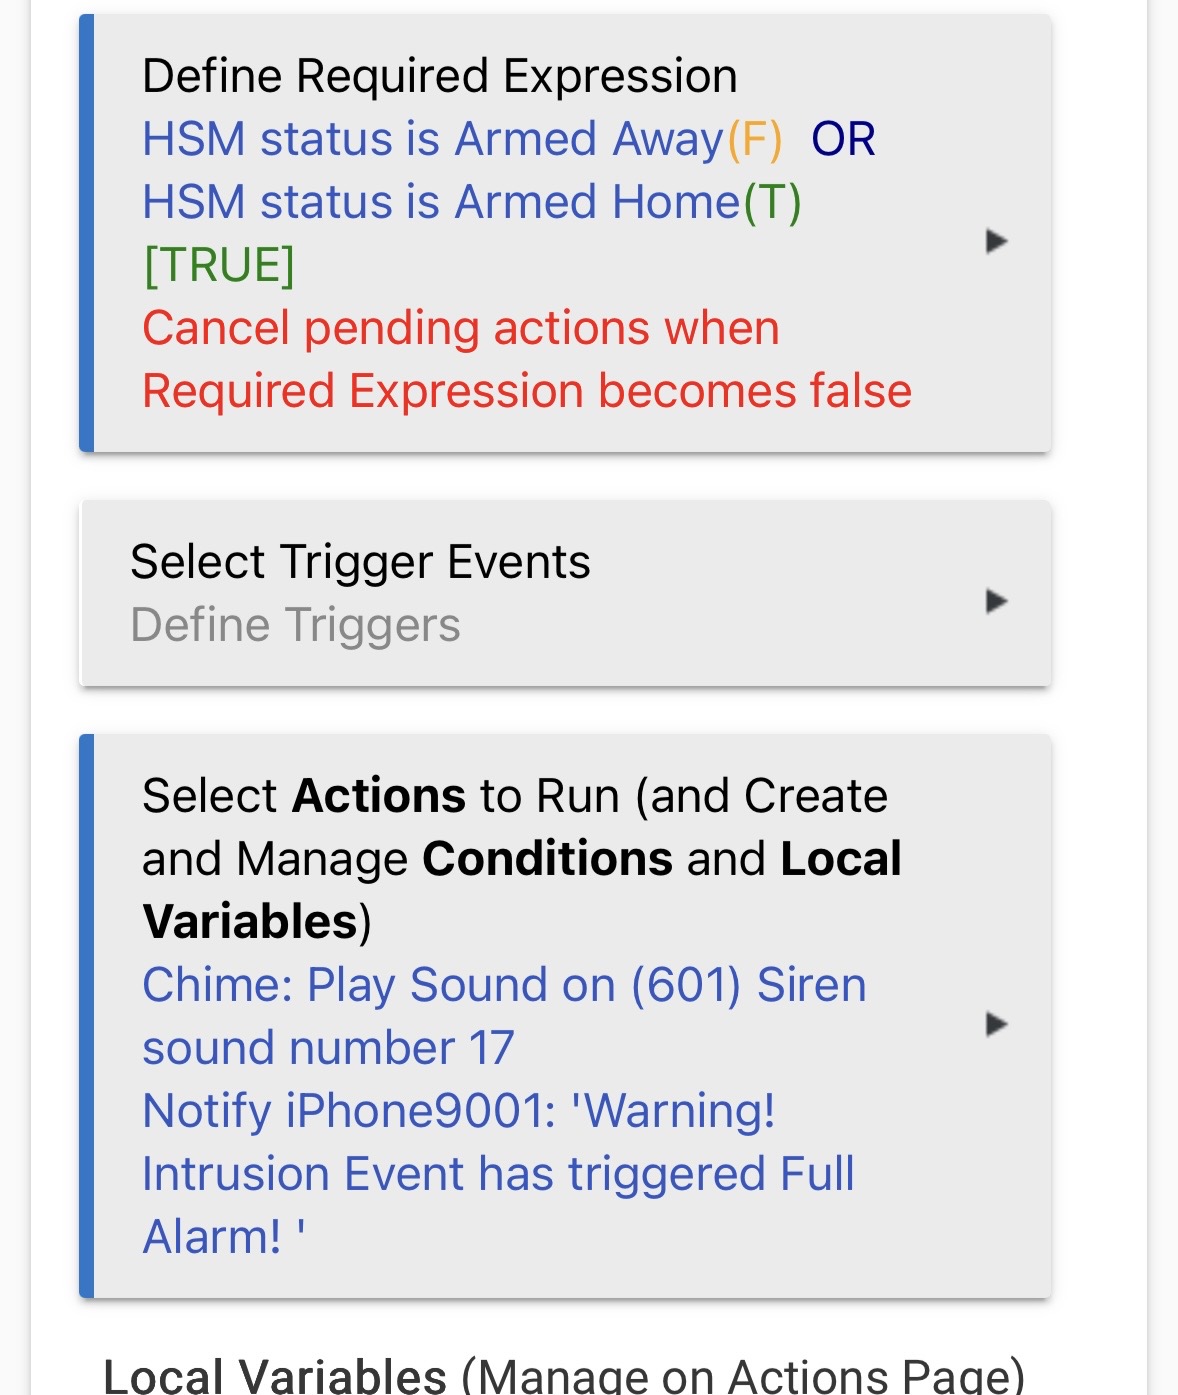
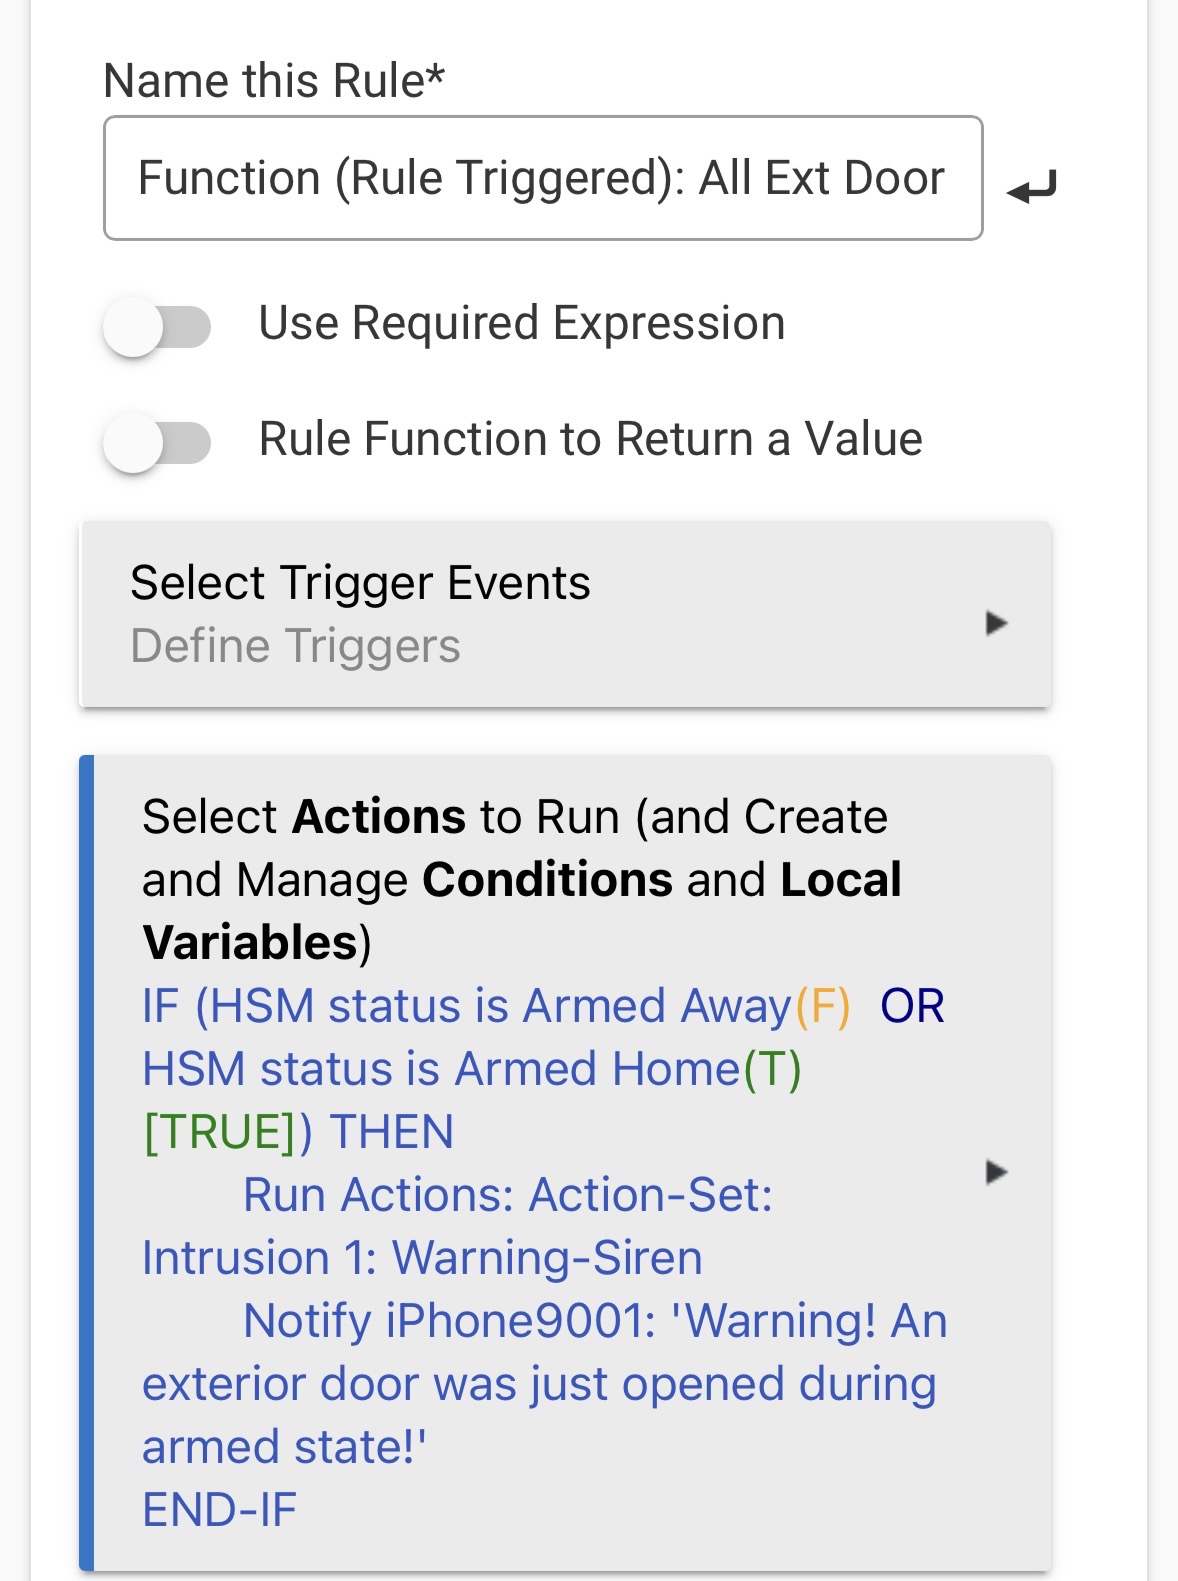
In some cases a bunch of small tasks can create short spikes of load that are impact. Again these seem to be related to HSM which in of itself should limit by how often they are triggered. Another item to consider is any of these rules could create conflicting logic and create a circle of actions between other rules.
I can't say much with this. I used it for a while, but then ended up having issues with my locks and keypads because of it. I ended up removing it and managing codes independently on my devices.
Yea this is typical. I can watch my graphs and sometimes see when HPM runs. The key thing is that it's load doesn't persist. It is momentary and then goes down.
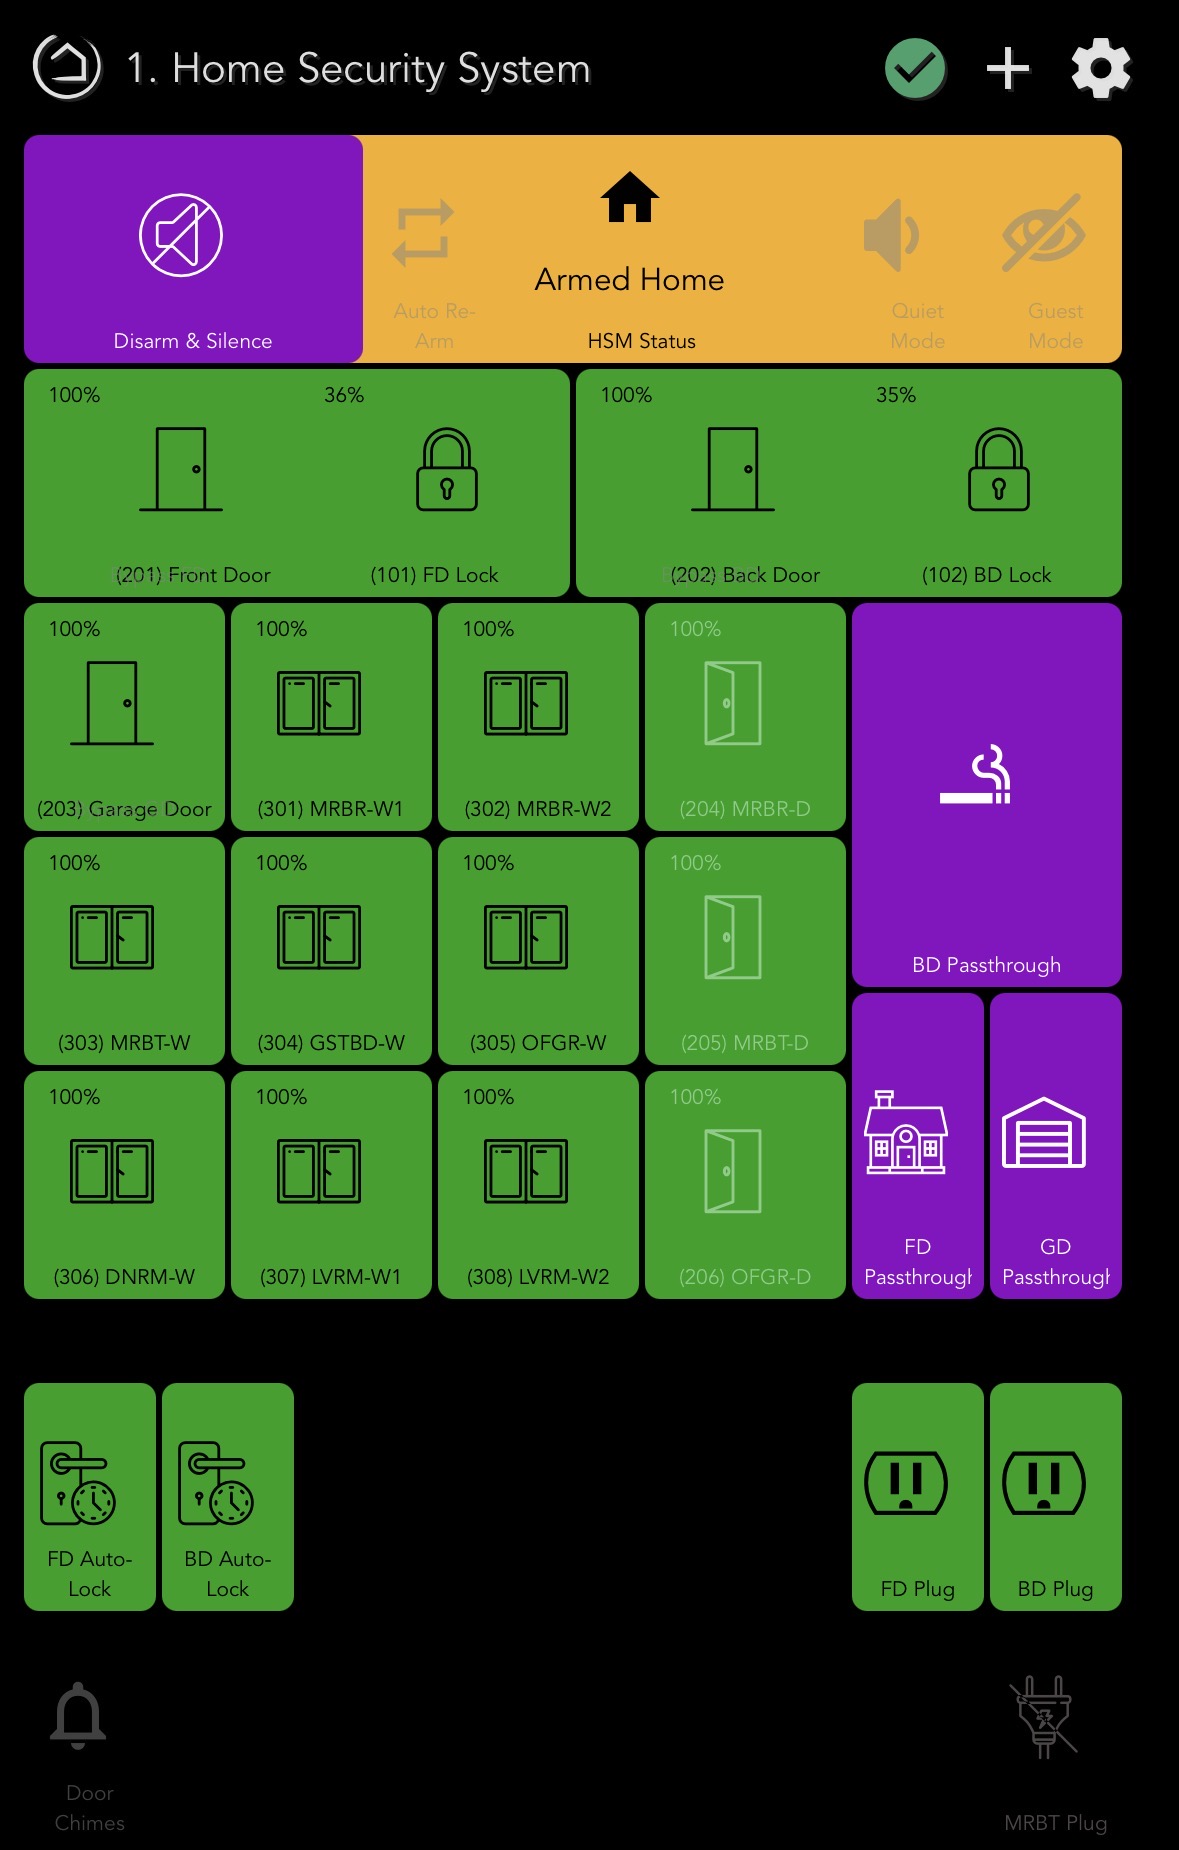
What apps do you have loaded on your hub. Clearly Rule Machine, Lock Code Manager and HSM, but what else.
If you reboot the hub, then wait for it to settle down, how long does it take for the load to reoccur. Does it happen fairly quickly, or later in the day at some point.
It seems you have done allot of automation around HSM and i am wondering if that has something do with it. If you disarm hsm and then perform a reboot and don't touch HSM and leave it disarmed I wonder if the problem would return.
I feel like this is either a race condition you are getting into either by something happening faster then it can update, or more likely a loop being created based on logic between things.
Both of those can be hard to pin down.